The industry knee-jerk when MPG drops is to blame the driver. Real fleet data says otherwise: roughly 60% of diesel fuel economy loss traces back to maintenance issues, not driver behavior. Under-inflated tires alone can cost 3% MPG. A clogged air filter costs 2%. A single dragging brake can cost 4% and you won't feel it on the pedal. Add them up across a fleet and the fuel line item is quietly bleeding six figures a year on preventable issues. This guide breaks down which maintenance items steal MPG, by how much, how to spot them, and how to build fuel economy into the PM program as a first-class KPI. Truck Inspection & Maintenance tracks MPG per truck against every PM tier — sign up free or contact our team.
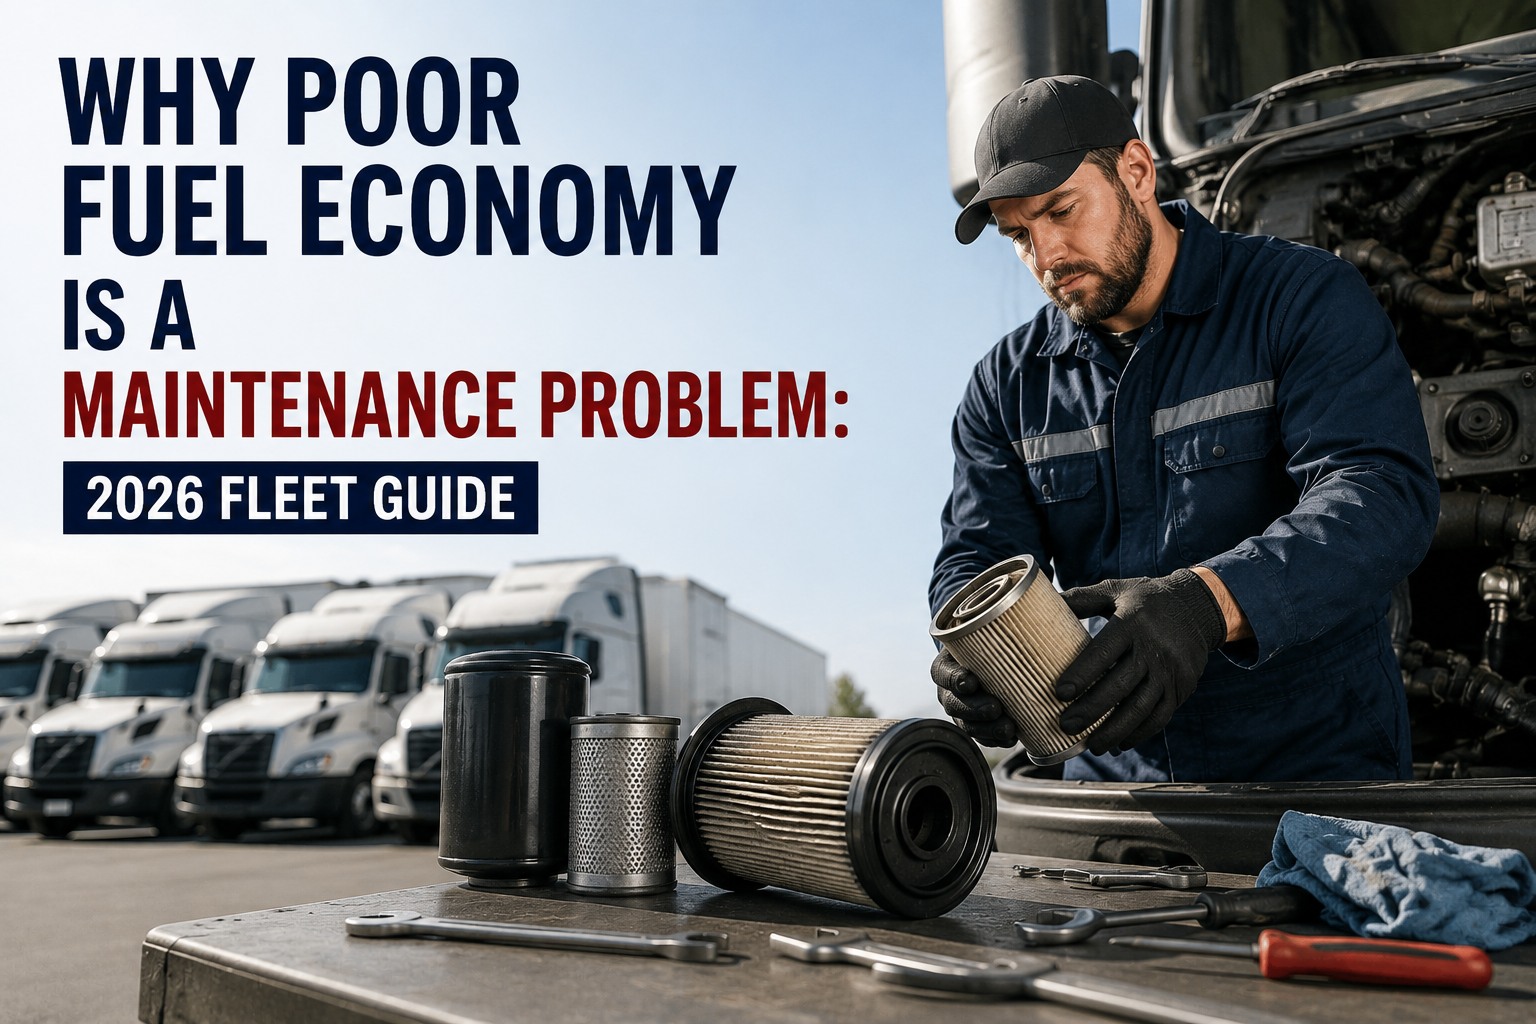
Why Poor Fuel Economy Is a Maintenance Problem — 2026 Fleet Guide
60% of MPG loss is maintenance. Only 40% is driver behavior. Fix the truck first.
Why Fuel Economy Belongs on the Maintenance Scoreboard
Fleets that treat MPG as a driver-behavior number miss most of the actual loss. Three data points reframe the conversation:
At $4.10/gal diesel and 110K mi/truck/yr, one point of fleet-wide MPG improvement is worth roughly $95K/yr on a 100-truck fleet. Two points = $190K. Real numbers, real budget.
Fleets that add fuel economy tracking to their PM program typically recover 15–20% of prior MPG loss in the first 6 months — no driver behavior change, just fixing the trucks that were quietly losing.
Same fleet, same routes, same driver assignments: the bottom-quartile truck runs 6.2 MPG while the top-quartile runs 7.4. The gap is almost entirely maintenance — same drivers rotate through both.
Every point of MPG per 100 trucks = $95K/yr. Start a free account and put MPG on the maintenance scoreboard.
The MPG Loss Breakdown — What Steals Fuel
Every one of these maintenance issues costs measurable MPG. The percentages compound — a truck with three of them loses roughly the sum of all three:
Stuck caliper, misadjusted slack adjuster, or seized brake shoe drags for miles unnoticed. Costs up to 4% MPG per dragging wheel. Detected on pre-trip by heat check on wheel hub after short drive.
Tires 10 PSI under target increase rolling resistance and cost roughly 3% MPG on the average tractor-trailer. On duals, one soft inside tire drags on the outside partner too.
Front-end alignment drift from curb hits and worn tie-rod ends adds rolling resistance and cocks the drive axle. 2–3% MPG plus accelerated tire wear on both steer positions.
Restricted intake makes the engine work harder for the same air mass. 2% MPG on a badly clogged filter. Modern engines mask this in the ECM but the fuel cost is still there.
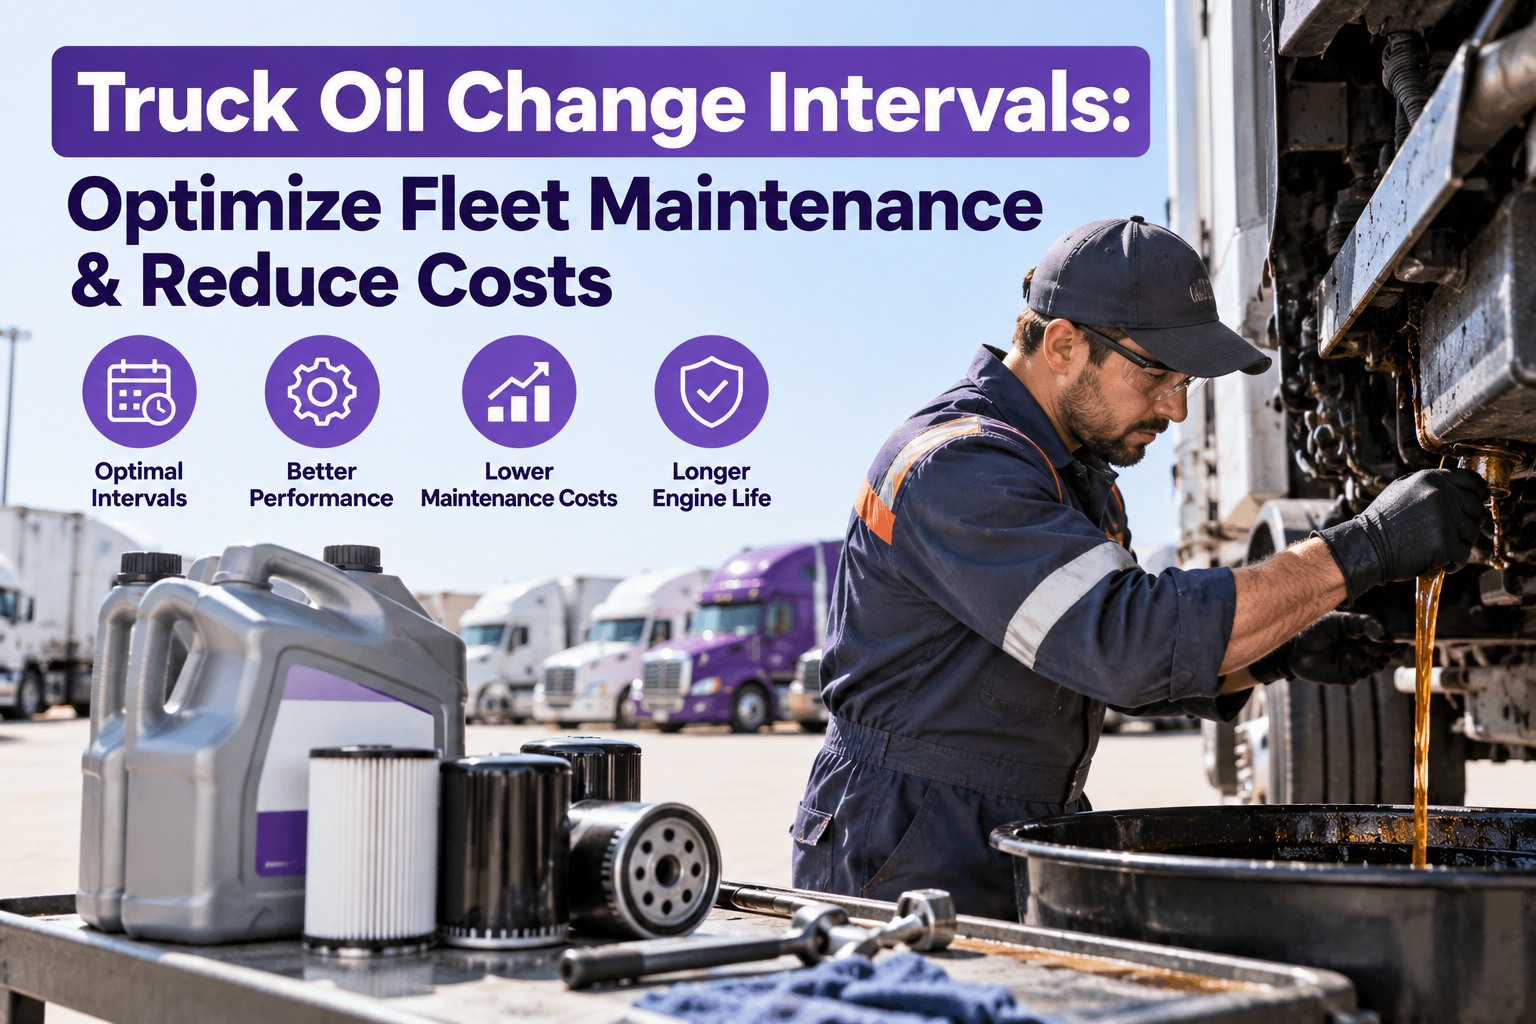
Oil past its viscosity spec runs thicker, increases internal friction. 2% MPG when oil is 25%+ past interval. Fleet oil analysis often catches this before the change interval.
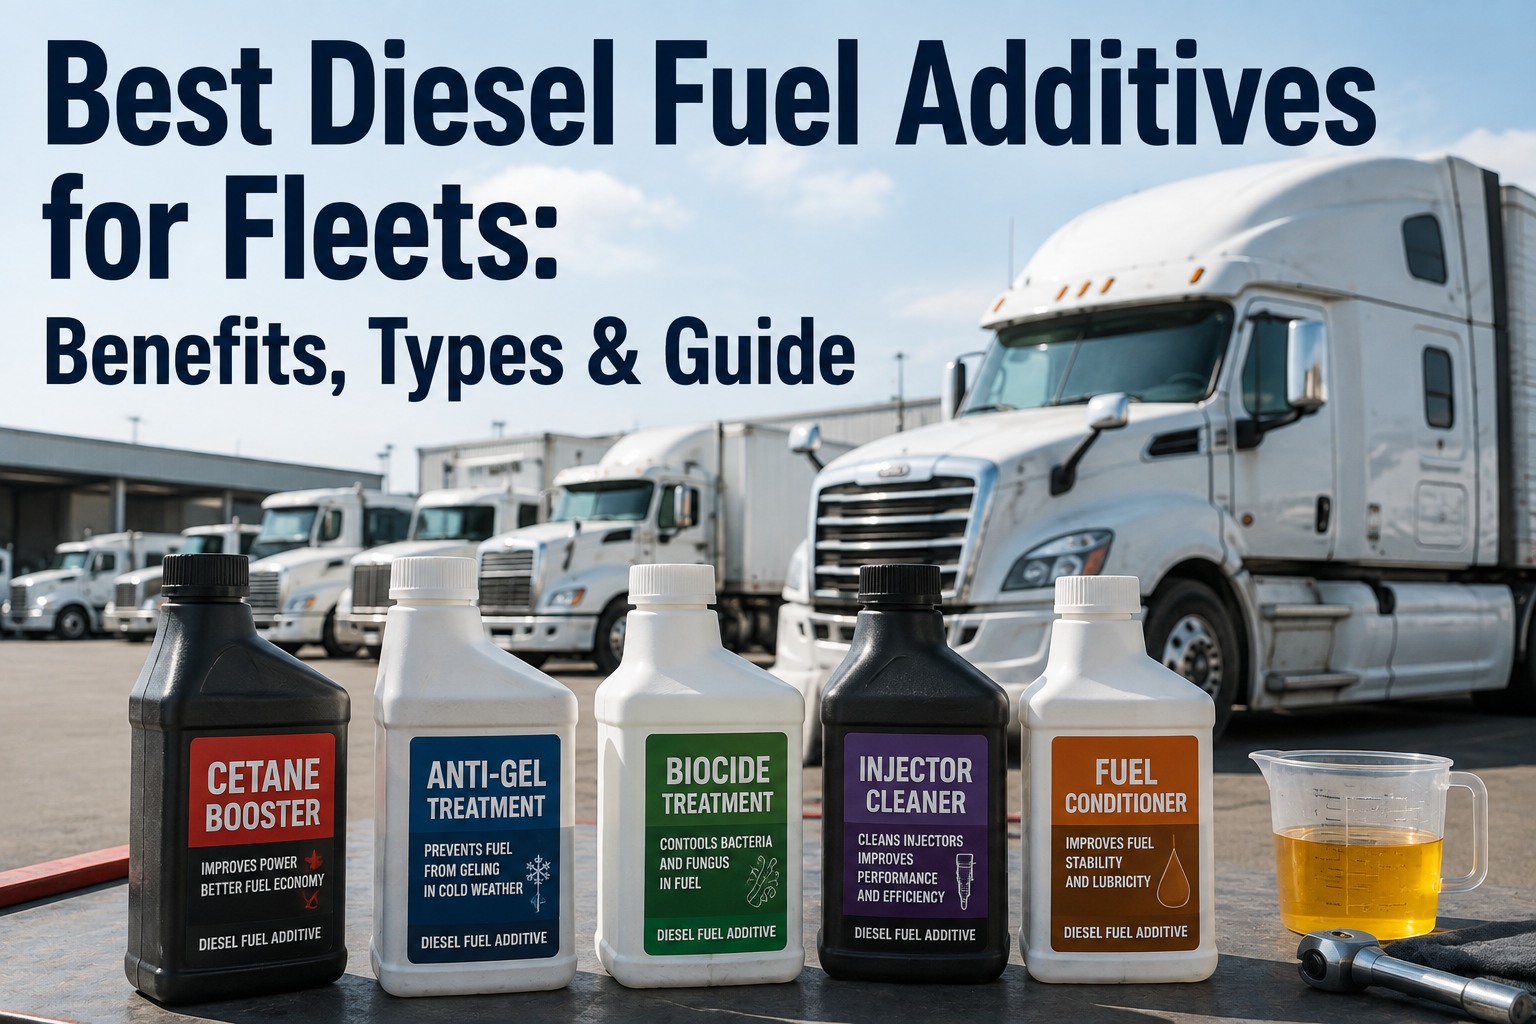
Injector spray pattern degrades over time, especially on high-idle duty cycles. 1.5% MPG per bad injector; multiply if several are fouled. Fuel additive maintenance dose helps prevent.
Restricted fuel flow forces fuel pump to work harder and can lean out injection under load. 1.5% MPG when filter is at end of life.
Cooling fan stuck engaged draws 40+ HP off the engine, especially at highway cruise. 1% MPG on constant-on fan; fan clutch test catches this at summer prep.
Cracked cab extender, missing trailer skirt panel, or bent chassis fairing kills airflow management. 1% MPG per major aero component missing or damaged.
Want a printable MPG-loss reference card for the shop wall? Contact our team and we'll send one, free.
Compounding Math — What Three "Small" Losses Actually Cost
The percentages above don't sit in isolation. A truck with three concurrent issues loses roughly the sum. Here's what that looks like in real fleet dollars:
Baseline: all PM current, tires at spec, no dragging brakes, filters fresh. This is the top-quartile truck in most fleets.
Soft tires (3%) + clogged air filter (2%) + injector fouling (1.5%) = 6.5% MPG loss. Same driver, same routes. Extra $5,378/yr in fuel per truck.
Add dragging brake (4%) + old oil (2%) + aero damage (1%) = 16% total loss. Bottom-quartile truck. $11,796/yr in fuel above baseline per truck.
Auto-flag any truck with 5%+ MPG drop over 4 weeks — sign up free and connect telematics or manual fuel logs in under 20 minutes.
The One Metric That Changes the Conversation — MPG per Truck per Week, Trended
Most fleets track MPG at the driver level, which turns the conversation into a driver-behavior debate. Track MPG per TRUCK per week instead, and the pattern gets obvious fast: a truck that drops from 7.2 to 6.6 MPG in three weeks isn't a driver problem — the same driver rotates through other trucks that are still running at 7.2. That truck has a maintenance issue building. Trend MPG per truck weekly, flag any 5%+ drop over 4 weeks, and route it to the shop. Fleets that add this one metric to their KPI dashboard recover 15–20% of prior MPG loss in 6 months. Start a free account and add MPG-per-truck trending to your PM program this week.
The Fuel Economy PM Overlay — 5 Items to Add
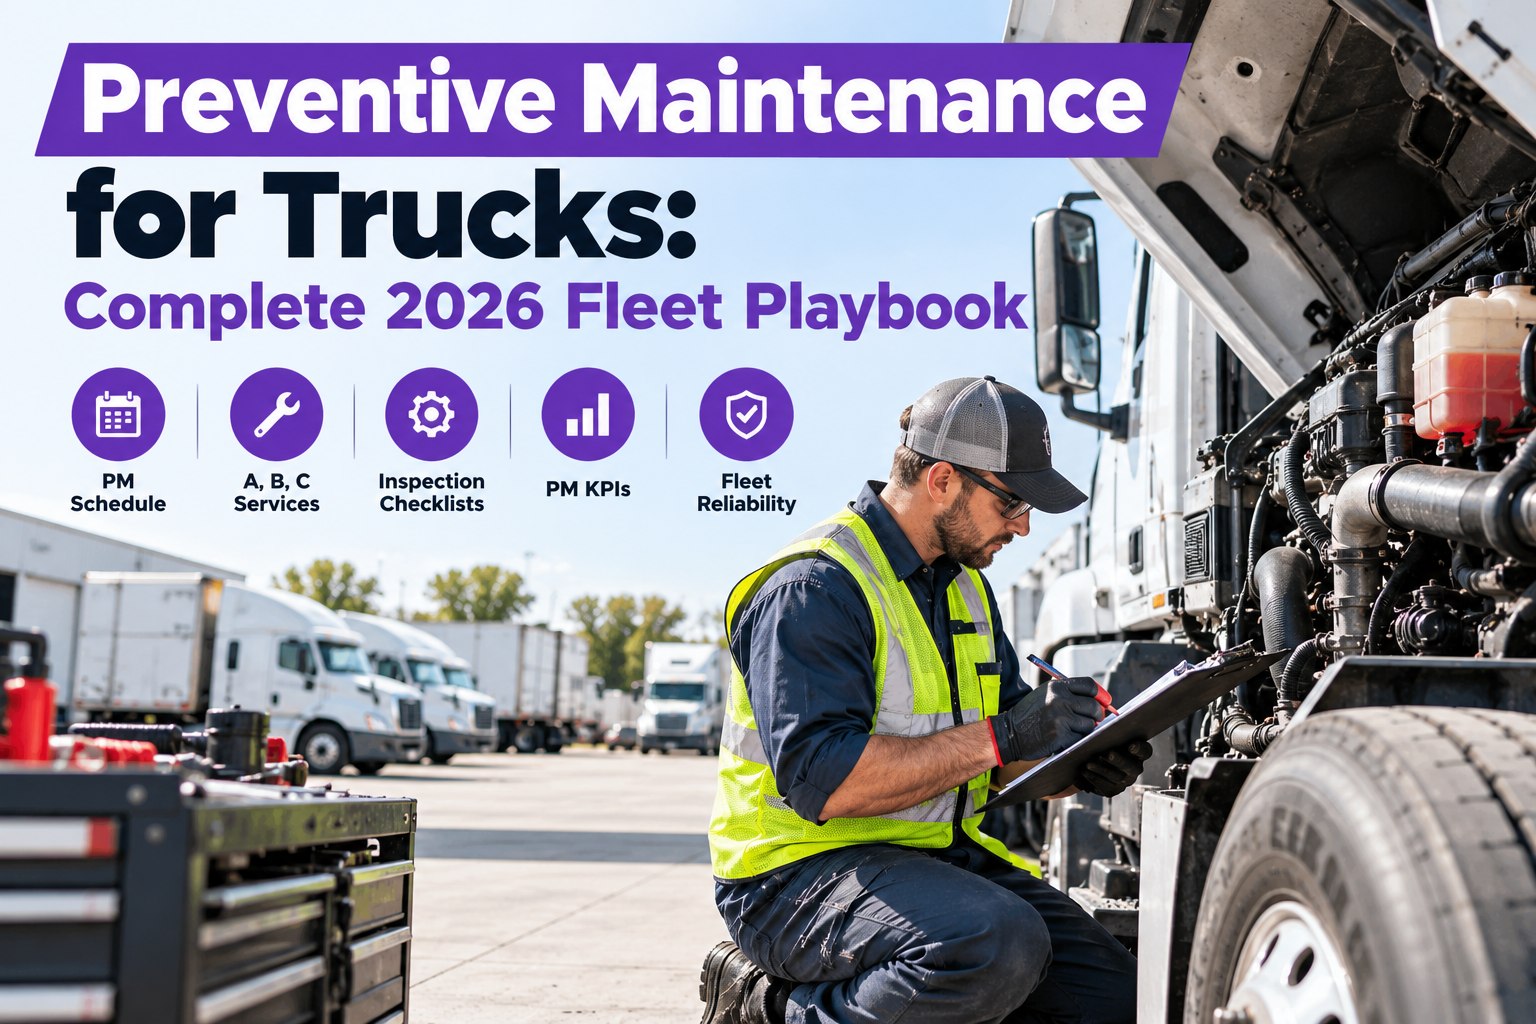
The standard PM tiers don't explicitly protect MPG. Add these 5 items to any PM-B or PM-C and fuel economy stays on the scoreboard:
Need help sequencing the fuel PM overlay against your existing PM tiers? Get in touch for a free 15-minute review.
The KPI Dashboard — 6 Fuel Economy Metrics
Six numbers to track weekly on any fleet running fuel economy as a maintenance KPI:
Fleet-wide average across all trucks. Target varies by fleet type — 7.0+ for OTR tractors, 6.0+ for regional, 5.5+ for urban delivery.
Gap between top and bottom quartile MPG. Wide gap = maintenance issues concentrated in specific trucks. Narrow gap = fleet-wide discipline.
Trucks with 5%+ MPG drop trending over 4+ weeks without shop investigation. Zero tolerance — every trend flag routes to a WO.
Every PM-B and PM-C includes all 5 fuel-economy overlay items. Below 100% = PM checklist is missing the items that protect MPG.
Total fleet fuel spend divided by miles run. Above $0.55/mi at current diesel = MPG below target or trucks off-spec.
MPG improvement from prior baseline in first year of fuel-as-maintenance-KPI program. Below 15% = program is talking about it but not executing.
Turn every truck's MPG into a live signal that fires a work order the moment it drifts.
Weekly MPG trending per truck, 5-item fuel-economy PM overlay, 6-metric KPI dashboard, auto-fire WO on 5%+ drops. Free forever for up to 3 vehicles — create your free account or talk to our team.
The 5 Most Common MPG-Killing Mistakes
Every fleet has watched at least three of these five play out. All five are preventable:
Blaming the Driver First
Pattern: MPG drops on truck 4412, dispatch calls driver into a coaching session. Same driver, same coaching, same truck a month later — MPG still down. Turns out truck had a dragging drive brake the whole time.
Tracking MPG by Driver, Not Truck
Pattern: Reporting rolls MPG up to driver. A driver rotating across 5 trucks masks 1 bad truck with 4 good ones. Track by truck, and the outlier surfaces immediately.
Filter Replaced on Interval, Not Restriction
Pattern: Air filter swapped every 30K miles because that's the interval, even when restriction gauge shows 15K remaining. Or worse — filter left in past interval because it "still looks OK." Read the gauge, not the calendar.
Aero Damage Treated as Cosmetic
Pattern: Cracked cab extender or missing trailer skirt panel gets logged as "cosmetic — repair next PM." Fuel cost compounds every mile between now and next PM. Aero damage is a fuel issue, not a cosmetic issue.
No Hub Heat Check Post-PM
Pattern: Brake work done at PM, truck released without a hub temperature check on the 5-mile shake-out. Adjustment error or reassembly issue causes dragging brake that costs 4% MPG until next PM catches it.
Recover 15-20% of prior MPG loss in your first 6 months — create your free account in 10 minutes.
Frequently Asked Questions
How much of poor fuel economy is actually a maintenance problem vs driver behavior?
Roughly 60% of diesel fuel economy loss traces back to maintenance issues, with only about 40% attributable to driver behavior. The industry knee-jerk to blame the driver first misses most of the actual cost. Same fleet, same routes, same driver assignments produce bottom-quartile trucks at 6.2 MPG and top-quartile trucks at 7.4 MPG — the gap is almost entirely maintenance because the drivers rotate through both. Fixing the trucks recovers most of the loss without any driver conversation.
What are the biggest maintenance-driven MPG losses on a diesel truck?
The largest single-item MPG losses in typical order: dragging brake at any wheel (up to 4%), under-inflated tires 10 PSI low (3%), front-end misalignment (2–3%), clogged air filter (2%), aged engine oil past change interval (2%), fuel injector fouling (1.5% per bad injector), clogged fuel filter (1.5%), failed fan clutch stuck engaged (1%), and aerodynamic damage to fairings or skirts (1% per component). Losses compound — a truck with three concurrent issues loses roughly the sum of all three.
Should fleets track MPG per driver or per truck?
Per truck. Tracking MPG per driver rolls the bad truck's loss into that driver's average, masks the pattern, and turns the conversation into a driver-behavior debate. Tracking per truck instead makes the outlier obvious — a truck that drops from 7.2 to 6.6 MPG in three weeks with multiple drivers rotating through it is a maintenance problem, not a driver problem. Weekly MPG per truck trended over 4 weeks catches most maintenance-driven drift before it becomes major.
What's the ROI of adding fuel economy tracking to a PM program?
At $4.10/gal diesel and 110K mi/truck/yr, one point of fleet-wide MPG improvement is worth roughly $95K/yr on a 100-truck fleet. Fleets that add fuel economy tracking to their PM program typically recover 15–20% of prior MPG loss in the first 6 months — no driver behavior change, just fixing the trucks that were quietly losing. The recovery pays for the tracking system and the shop time to close the WOs many times over in the first year.
What items should be added to PM to protect fuel economy?
Five items should be added to any PM-B or PM-C: cold tire pressure check to OEM spec on all positions including inside duals, hub heat check with IR gun after a 5-mile test drive to catch dragging brakes, air filter restriction gauge reading (replace on gauge not on calendar), fan clutch engagement test at operating temp, and aerodynamic component visual for cracked or missing fairings, skirts, and cab extenders. Adding these 5 items to the PM checklist ensures fuel economy stays on the scoreboard.
How does Truck Inspection & Maintenance treat fuel economy as a maintenance KPI?
Truck Inspection & Maintenance tracks MPG per truck per week from telematics or manual fuel log entry, trends against the fleet average and the truck's own baseline, and auto-fires a work order when a truck drops 5%+ over 4 weeks. The 5-item fuel economy PM overlay is pre-configured into PM-B and PM-C tiers. All 6 fuel economy KPIs (fleet avg MPG, bottom-quartile gap, trend-flagged trucks, PM overlay rate, cost per mile, YR-1 MPG recovery) track in real time on one dashboard. Free forever for up to 3 vehicles. Sign up in 10 minutes or contact our team for larger fleets.
Stop blaming the driver first. Fix the trucks the data points to, and MPG climbs on its own.
MPG-per-truck trending, 5-item fuel PM overlay, auto-fired WOs on 5%+ drops, 6-metric KPI dashboard. Free forever for up to 3 vehicles — no hardware, no contract, no credit card.