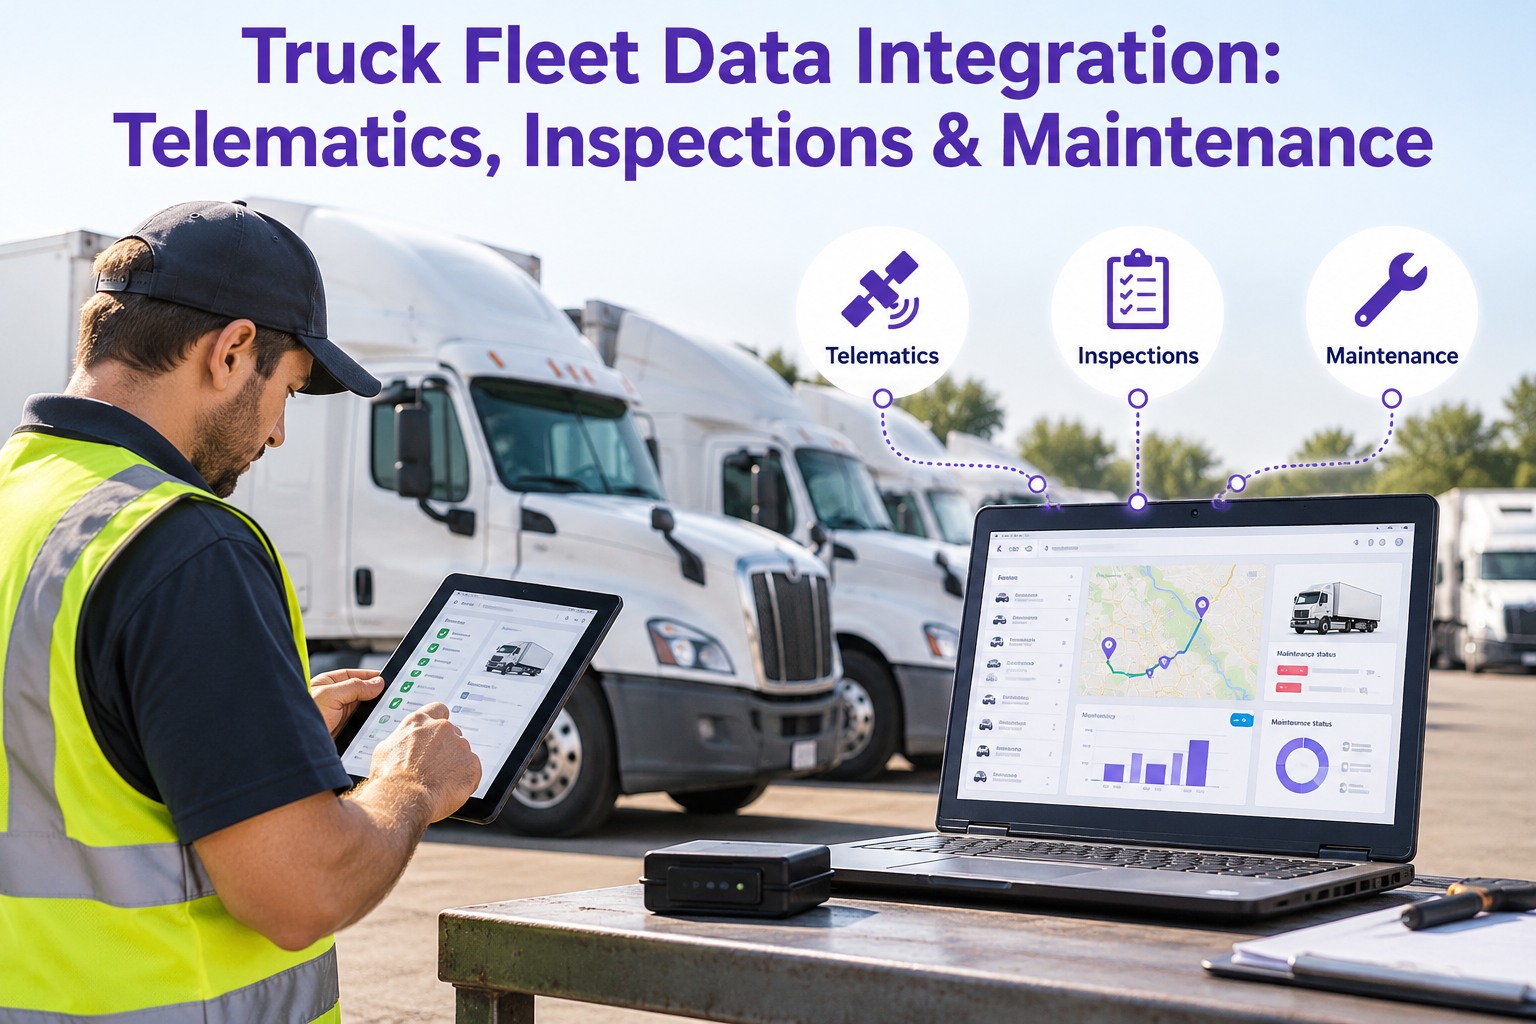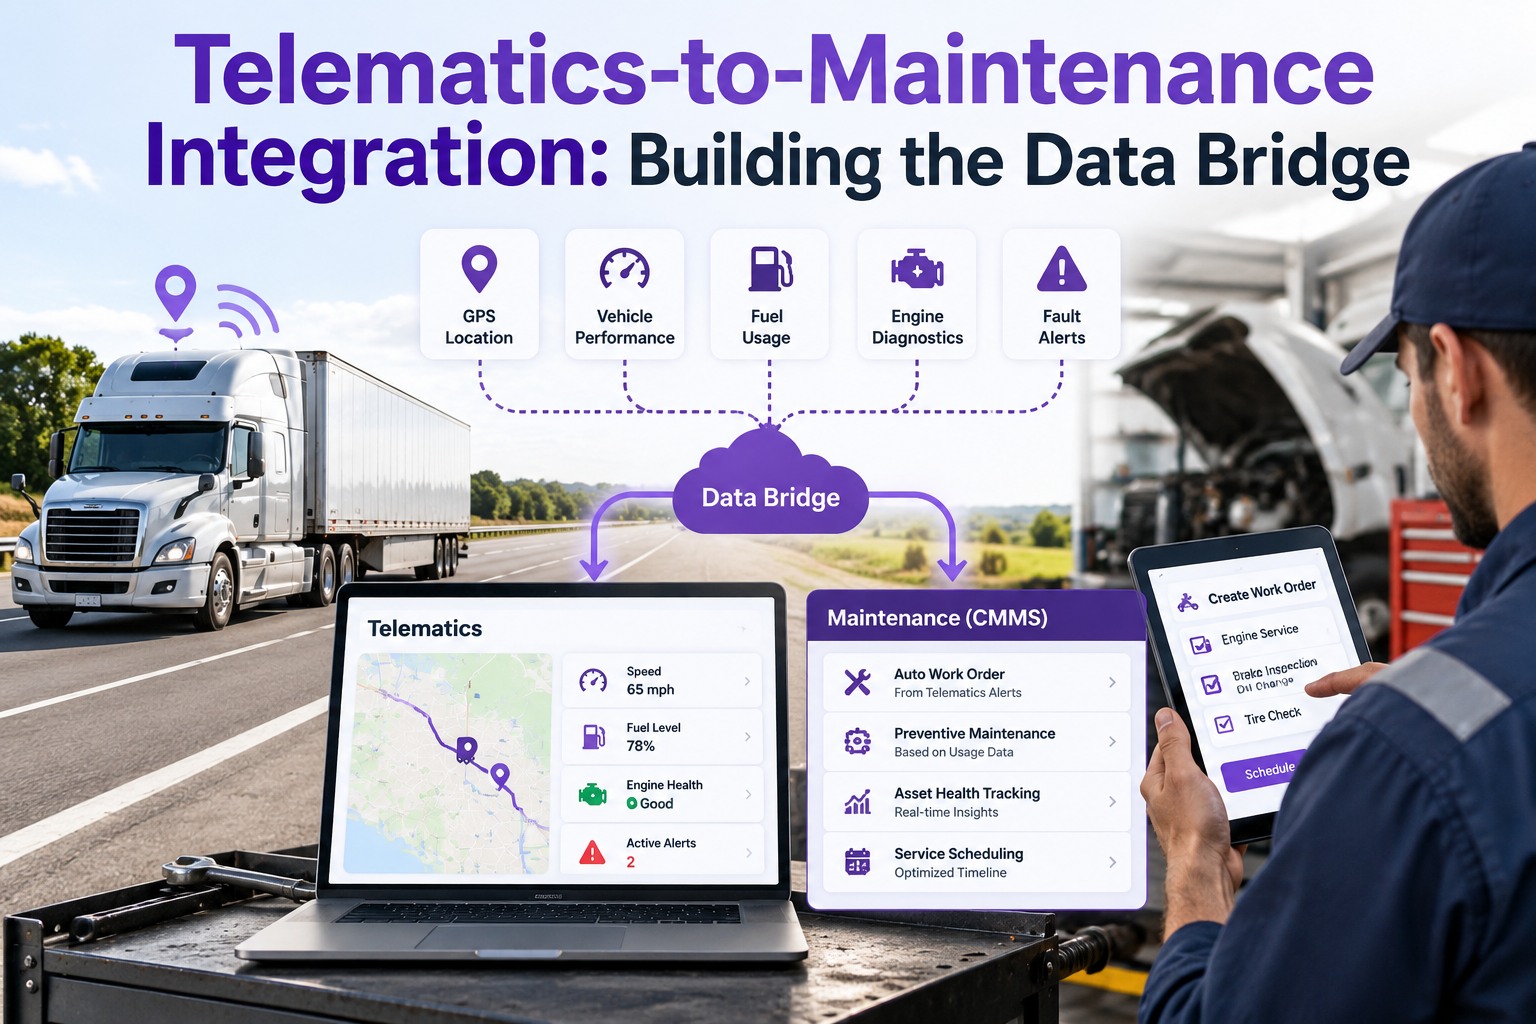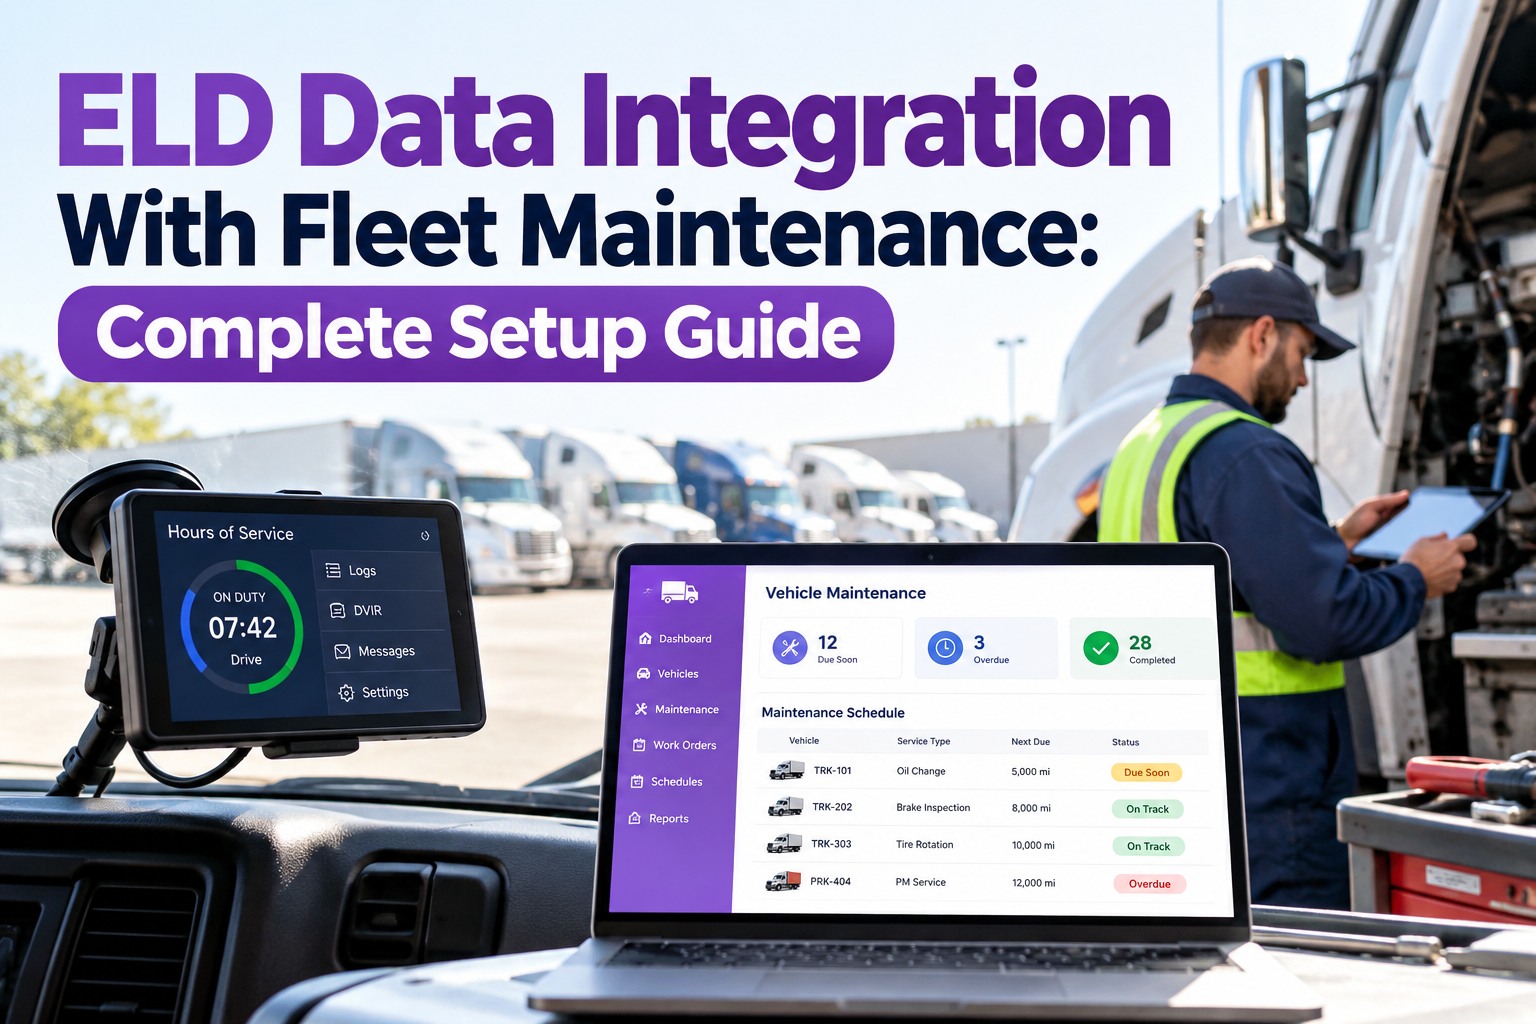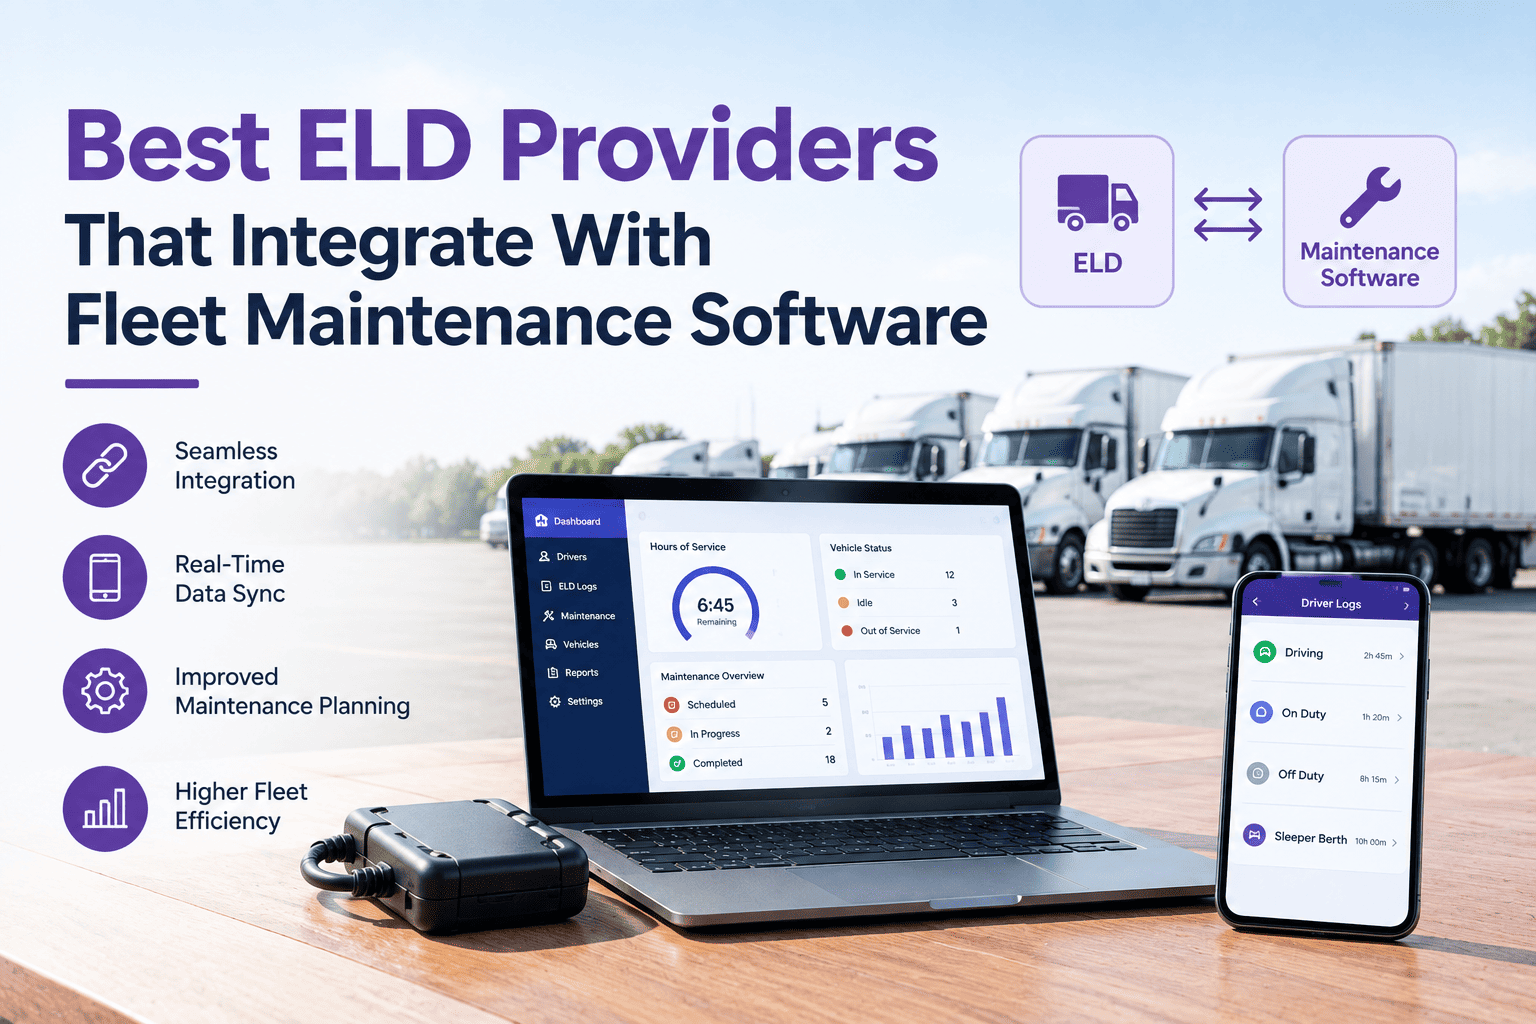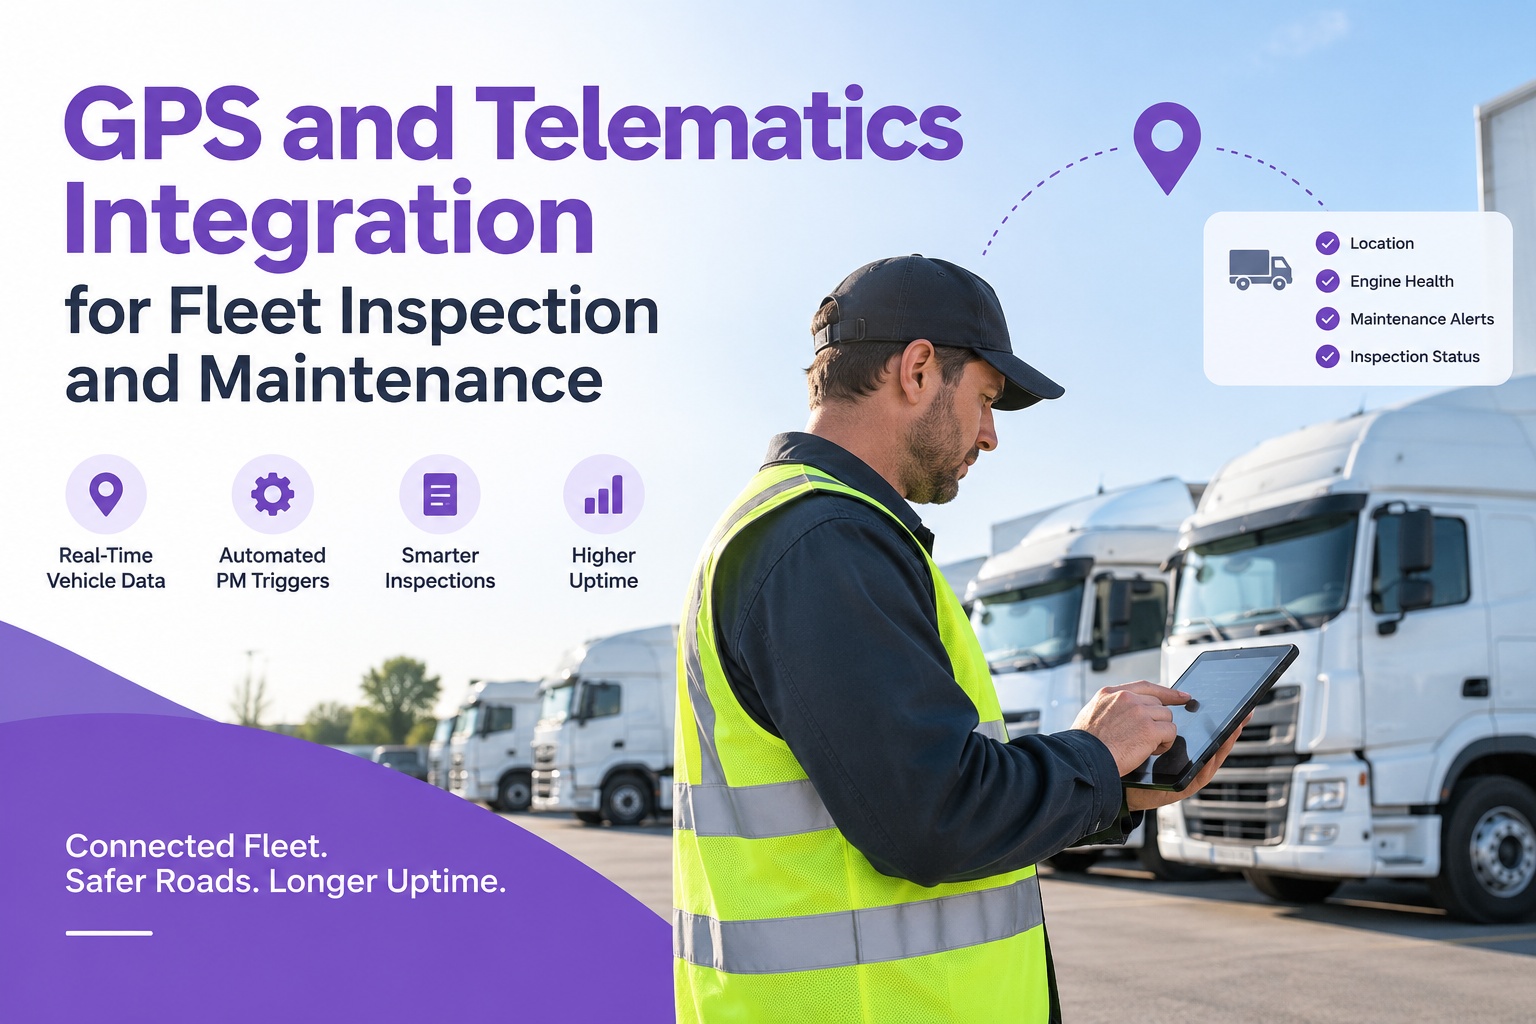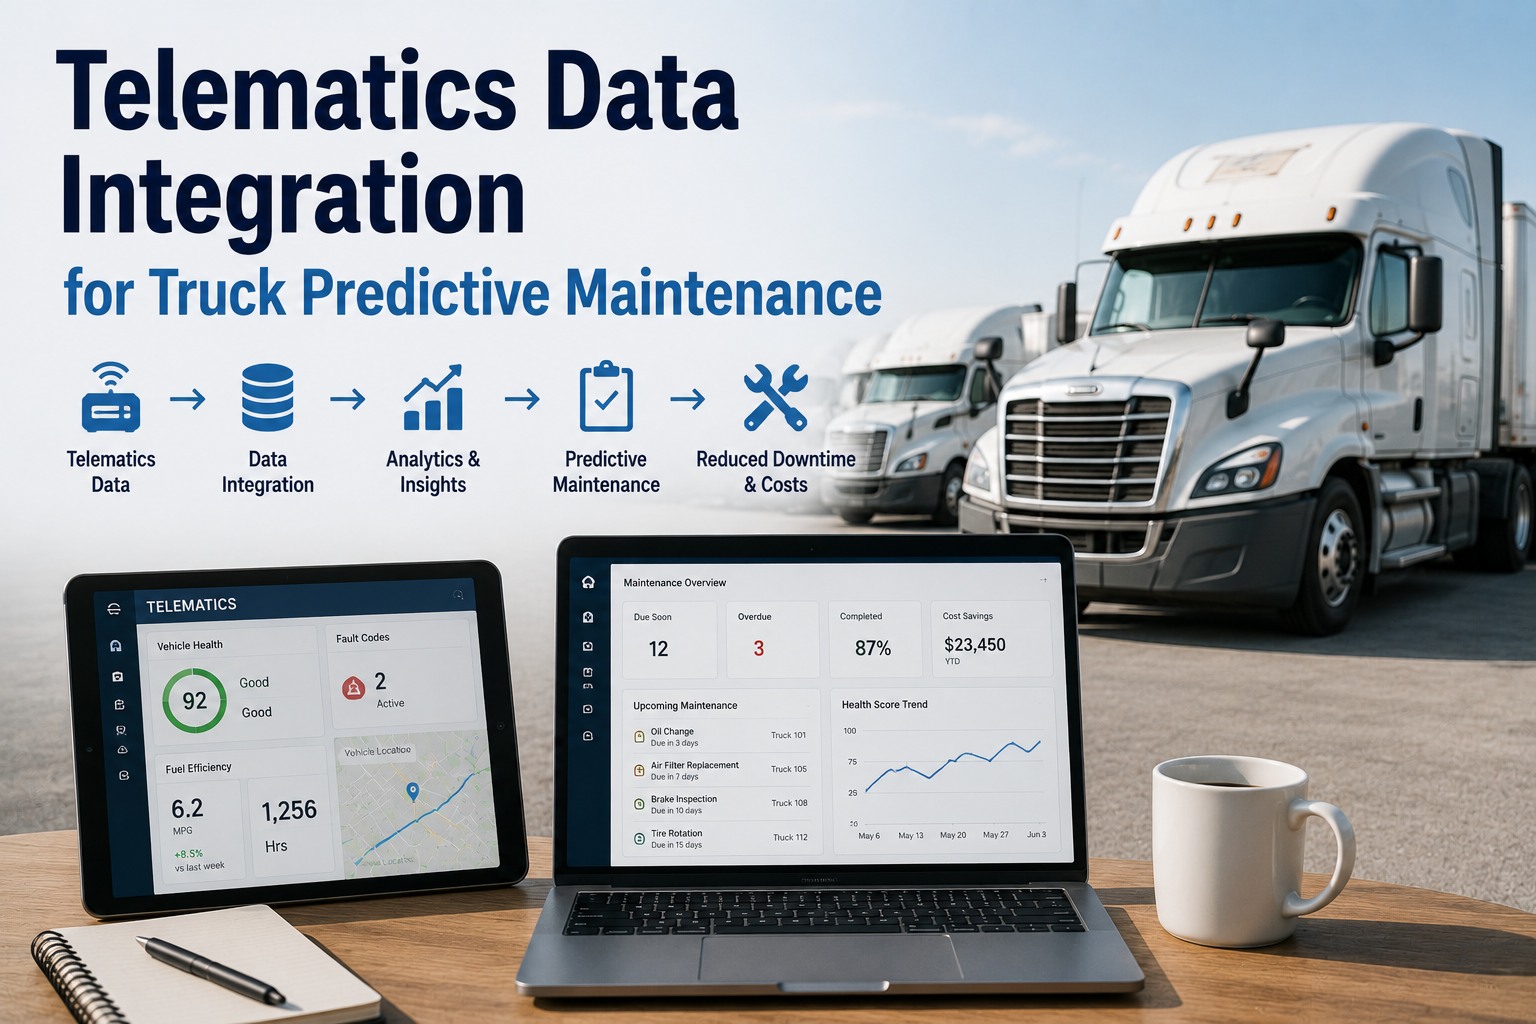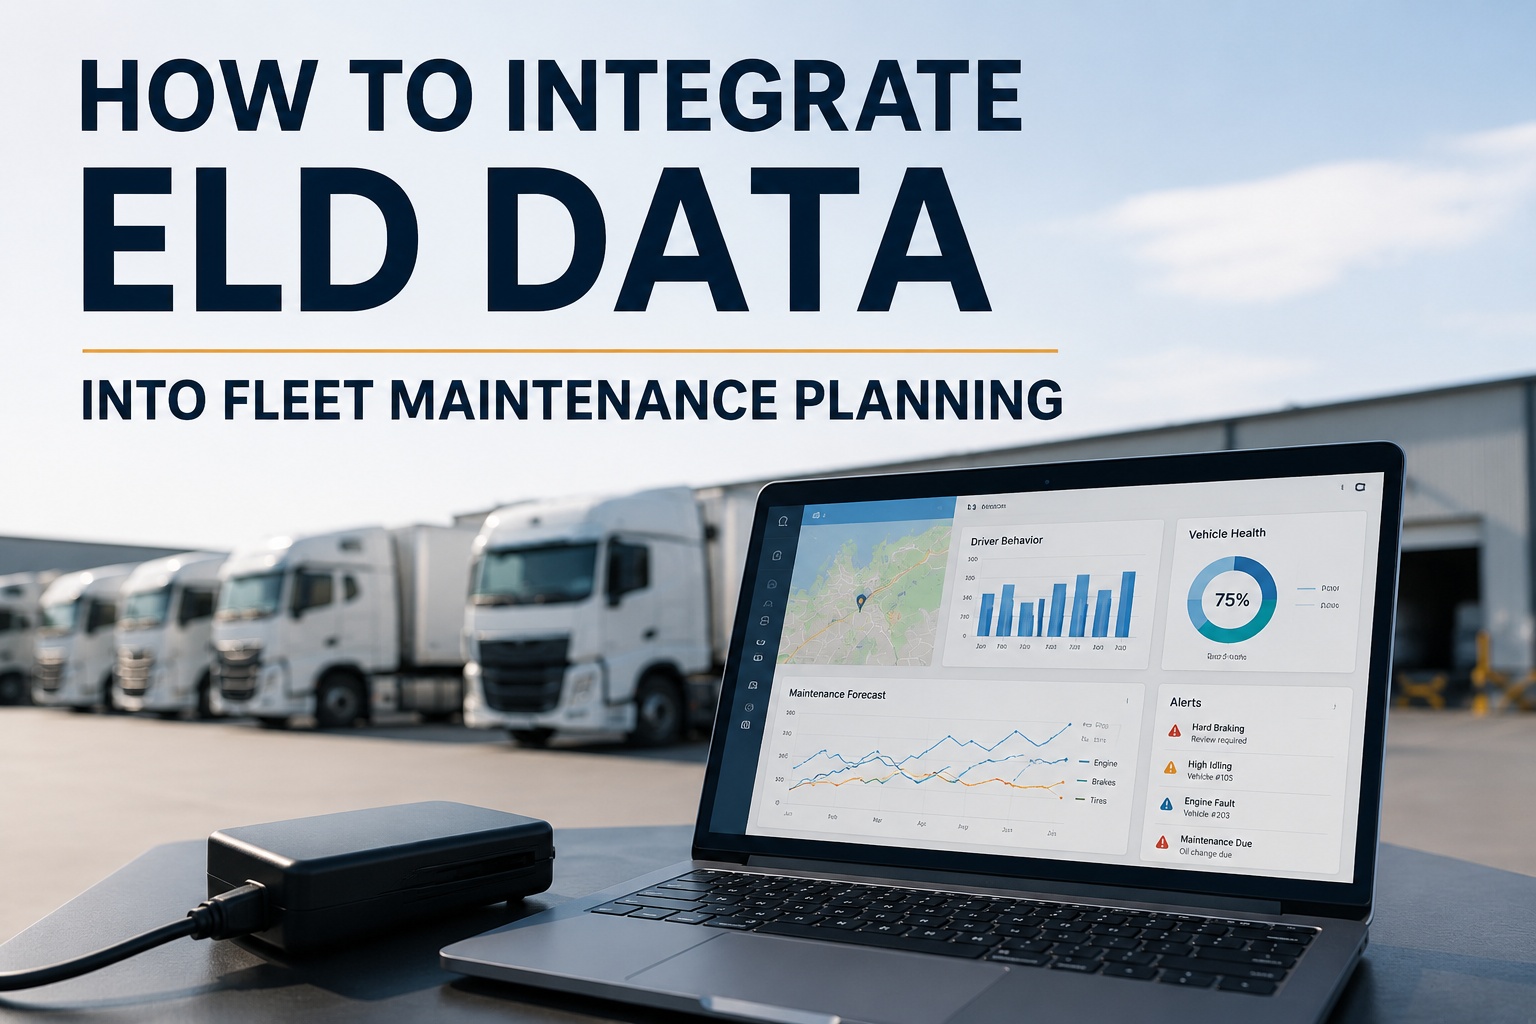
An ELD is a compliance device that streams a maintenance-grade data feed. Most fleets buy it for HOS logging and stop there — leaving 90% of the value on the truck. Every ELD in a commercial fleet continuously broadcasts engine hours, idle time, hard braking events, RPM over-revs, fuel burn rate, and DTCs through the J1939 CAN bus. That data doesn't just track the driver's hours — it predicts which components will fail next. A truck logging 40 hard-brakes on a single route is overdue for brake inspection regardless of calendar PM. A truck running two DPF regens in 100 miles has a clogging aftertreatment that will fail in the next 500. A truck accumulating 300 idle hours a month is aging its engine the equivalent of 7,500 additional highway miles per month no odometer records. Fleets that integrate ELD data into maintenance planning cut unplanned breakdowns 45%+ and shift from calendar-based to condition-based PM. Sign up free for Truck Inspection & Maintenance today — no credit card required to route your ELD streams directly into PM triggers, or contact our team for an integration audit configured to your current ELD stack.
How to Integrate ELD Data Into Fleet Maintenance Planning
The ELD in every truck is already broadcasting 90% of the data you need to predict component failure. Most fleets use 10% of it. Here's how to close the gap.
Why ELD Data Is a Maintenance Signal, Not Just an HOS Log
The ELD was originally mandated for hours-of-service compliance under 49 CFR Part 395. But the same hardware streams engine, powertrain, and driver behavior data through the J1939 CAN bus — data that reveals wear patterns weeks or months before any inspection would catch them.
Calendar-Based PM vs Condition-Based PM
The core shift ELD integration enables is moving from calendar-based PM ("truck 27 due for oil change in 30 days") to condition-based PM ("truck 27 due for oil change in 137 engine hours OR when idle-adjusted mileage hits 30,000 OR at 90 days — whichever comes first"). Same truck, dramatically different outcome.
The 6-Step Integration Workflow
ELD-to-maintenance integration follows a repeatable pattern. Same 6 steps whether your telematics provider is Samsara, Geotab, Motive, Verizon Connect, Webfleet, or an OEM-native system (PACCAR Connect, Detroit Connect, Mack GuardDog).
Driver Behavior Signals — What ELD Data Reveals About Wear
The single biggest surprise for fleets first integrating ELD data is how much wear is driver-caused versus equipment-caused. Two drivers on identical trucks running identical routes typically produce 30-50% different maintenance costs — and ELD data explains exactly why.
The J1939 Data Bus — What's Actually Streaming
The J1939 CAN bus is the SAE-standard protocol every commercial truck uses to broadcast engine, transmission, and aftertreatment data. Understanding what's on the bus explains why ELD integration is powerful.
| Signal Category | Broadcast Rate | Maintenance Signal Delivered |
|---|---|---|
| Engine RPM & hours | Every 100 ms | Idle-adjusted PM triggers, over-rev events |
| Coolant temperature | Every 1 sec | Overheat detection, radiator inspection triggers |
| Oil pressure | Every 500 ms | Low-pressure warning, bearing wear indication |
| Fuel rate | Every 100 ms | MPG tracking, sudden-drop detection |
| Diagnostic Trouble Codes (SPN/FMI) | On fault event | Auto work order, severity-tagged routing |
| DPF status & regen cycles | Every 1 sec | Aftertreatment PM, forced-regen alert |
| Vehicle speed & accelerometer | Every 100 ms | Hard-brake events, hard-acceleration events |
| Odometer | Every 1 sec | Mileage-based PM triggers, no manual entry |
Route every ELD data stream into the right PM trigger — automatically
Native API integration with major TSPs. Six signal categories mapped to maintenance triggers. First-to-occur logic across miles, hours, calendar, and events. Threshold configuration per truck class. Feedback loop refines predictions over time. Cut breakdowns 45%+ in the first year.
Integration Options — Native API vs Middleware vs Manual
Not every ELD integration is created equal. Three options exist, with dramatically different maintenance outcomes.
Frequently Asked Questions
Six data categories stream directly into maintenance planning: engine hours and idle time (for hour-based PM triggers that catch invisible idle wear), hard braking events (40+ hard-brakes on a single route usually means brake PM is overdue), RPM over-rev events (for engine and injector wear tracking), fuel burn rate and MPG (for detecting fuel/aftertreatment issues before the driver notices), diagnostic trouble codes via J1939 SPN/FMI (for auto-generating work orders the moment the ECM detects a fault), and DPF regen cycle frequency (two forced regens in 100 miles indicates clogging DPF). All six stream continuously through the J1939 CAN bus at rates from 100 ms to 1 second per data point. Fleets using only meter readings capture maybe 15% of the total maintenance value in the feed.
Industry rule of thumb: one hour of idle equals roughly 25 miles of engine wear. A truck accumulating 300 idle hours per month adds engine wear equivalent to 7,500 highway miles per month — that the odometer never records. On a 100-truck fleet, that's 750,000 miles of untracked engine wear every month happening in yards, at loading docks, and rest areas. Mileage-based PM misses this entirely, which is why high-idle vocational fleets (dump, refuse, mixer, oilfield) chronically under-service on calendar schedules. ELD-integrated PM catches every idle hour and adjusts PM triggers — oil changes, fuel filters, DPF cleaning, aftertreatment service all fire on idle-adjusted hours rather than pure mileage. This alone typically produces a 42% reduction in unplanned aftertreatment failures within the first year.
Modern fleet maintenance platforms integrate with all major ELD and telematics providers via native API connections. Supported TSPs include Samsara, Geotab, Motive (formerly KeepTruckin), Verizon Connect, Webfleet, and OEM-native systems (PACCAR Connect, Detroit Connect, Mack GuardDog, Volvo Dynafleet, Cummins Connected Diagnostics). Native API integrations are the best outcome — pre-built connectors, real-time data flow with sub-second latency, all six signal categories supported. Middleware bridges add latency and licensing cost. Manual CSV export captures maybe 20% of the integration benefit. When evaluating platforms, ask specifically which TSPs have native integration and which require middleware — native connections produce dramatically better data flow. Try the platform free to see native ELD integration in action.
Calendar-based PM triggers on fixed dates ("truck 27 due for oil change every 90 days"). Condition-based PM triggers on actual usage and wear signals ("truck 27 due at 300 engine hours OR 30,000 idle-adjusted miles OR 90 days — whichever comes first"). The condition-based approach uses ELD data to detect when the truck actually needs service based on how it's been used, not by arbitrary cadence. On a highway truck with consistent miles and low idle, both approaches produce similar schedules. On a vocational truck with heavy idle, aggressive driver behavior, or variable duty cycles, calendar-based chronically under-services while condition-based catches wear months earlier. Typical result: 45%+ fewer breakdowns, ±5% PM accuracy vs ±30% on calendar-based, and 28% overall maintenance spend cut. Condition-based PM only works with real-time ELD integration.
Yes — 30-50% of fleet maintenance cost is driver-caused, not equipment-caused. Two drivers running identical trucks on identical routes typically produce 30-50% different maintenance costs. Brake pad life differs 2-3x between smooth drivers (fewer than 5 hard-brakes per shift) and aggressive drivers (40+ hard-brakes). Cylinder and injector wear runs 40% higher on trucks with frequent RPM over-revs. Aftertreatment life is 50% shorter on high-idle trucks (30%+ of engine hours idling) versus low-idle trucks (under 10%). The single fastest maintenance cost reduction available to most fleets is driver behavior improvement through coaching built on ELD data. Making behavior visible with per-driver dashboards showing hard-brake counts, over-rev events, and idle percentages typically produces measurable improvement within 30-60 days without policy enforcement — drivers self-correct when they can see the data.
Typically 2-4 weeks for a mid-size fleet using native API integration. Week 1: API connection to the TSP established, authentication configured, initial data flow verified. Week 2: data category mapping — each of the 6 signal categories mapped to the correct maintenance trigger. Week 3: threshold configuration per truck class using OEM-recommended defaults. Week 4: pilot with 5-10 trucks to validate trigger accuracy, refine thresholds, then fleet-wide rollout. First measurable results (breakdown reduction, PM compliance) typically appear within 60-90 days. Full mature state — feedback-loop calibration refining thresholds based on repair outcomes — takes 6-12 months to stabilize. Middleware and manual export take longer to implement with weaker outcomes; native API is worth the vendor selection effort. Contact our team for an integration timeline scoped to your TSP.
Less than fleets expect, especially if the program is framed as maintenance-focused rather than surveillance-focused. Drivers generally accept ELD data used for PM scheduling, DTC-driven work orders, and idle tracking — these visibly improve the trucks they drive. Pushback appears when the same data is used punitively for driver ranking or bonus structures without context. Best practice: make ELD data visible to drivers on their own dashboards (their own hard-brake count, idle percentage, MPG), use it for coaching conversations grounded in what the truck needs, and reserve punitive use for genuine safety incidents backed by video or witness evidence. Fleets following this pattern report drivers actively engaging with the data — asking about their scores, self-correcting behavior, and taking pride in low-hard-brake counts. The ELD becomes a shared operational tool rather than a management-vs-driver conflict source, which is what unlocks the full 30-50% driver-behavior maintenance cost improvement.
Turn every ELD in the fleet into a maintenance signal — not just a compliance log
Native API integration with Samsara, Geotab, Motive, Verizon Connect, and OEM systems. Six signal categories routed to maintenance triggers. First-to-occur logic across miles, hours, calendar, and behavior events. Threshold configuration per truck class. Feedback loop refines predictions over time. Move from calendar PM to condition PM — cut breakdowns 45%+ in year one.