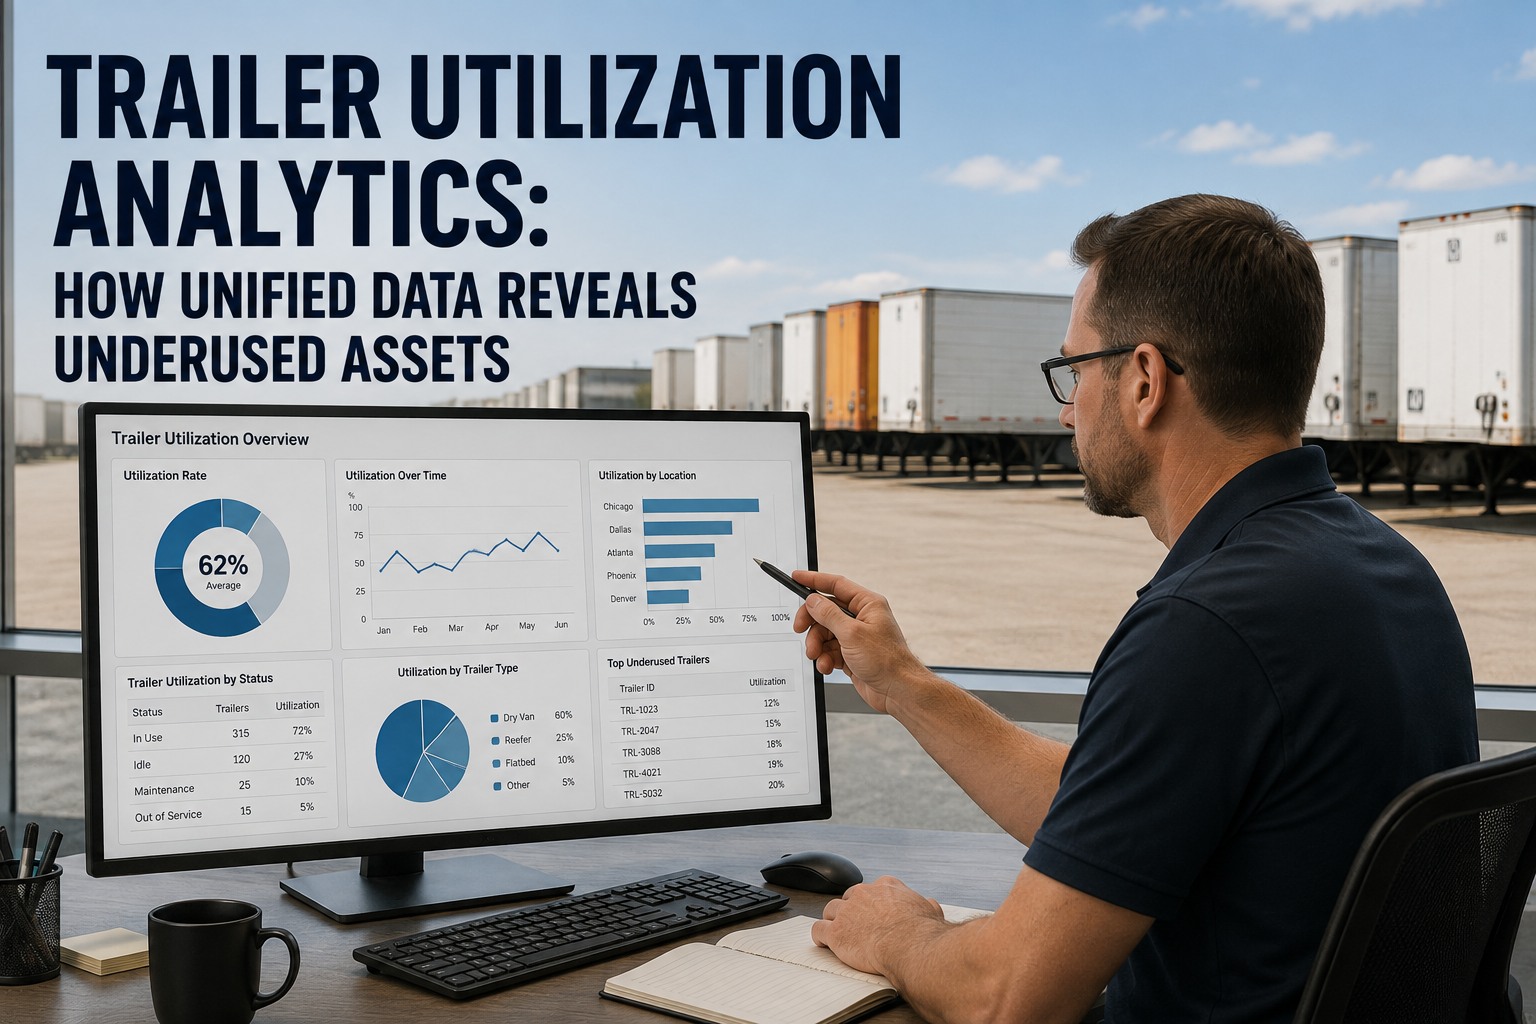
The average trailer in a US fleet runs at roughly 60% utilization — sitting idle for four out of every ten operating hours. At any given moment, 10-20% of trailers in a typical fleet are effectively unaccounted for, carrying insurance, depreciation, and PM costs while producing no revenue. Industry-wide, that adds up to $45 billion in underutilized capital. The fleets solving this aren't buying more trailers — they're fixing a data fragmentation problem. Tractor data lives in the ELD, trailer telematics in another vendor's portal, maintenance in the shop's spreadsheet, inspections on the driver's phone. Unify those streams under one trailer identifier, and the underused assets identify themselves. This guide walks through the analytics model — the metrics, benchmarks, and decision tree that separate trailers to keep from trailers to redeploy or sell. Sign up free for Truck Inspection & Maintenance today — no credit card required to unify tractor, trailer, inspection, and maintenance data in one platform, or contact our team for a utilization audit based on your current fleet size.
Trailer Utilization Analytics: How Unified Data Reveals Underused Assets
Fragmented data hides the trailers costing you money. Unified tractor-trailer-inspection-maintenance data makes the underused assets obvious — and the decisions inevitable.
The Data Fragmentation Problem — Why Nobody Knows What Every Trailer Does
Ask most fleet managers which of their trailers ran the most miles last month, and they can name the top 5 and the worst 3. Ask them about the middle 80% and the answer is a shrug. That's not because they don't care — it's because the data lives in four separate systems that don't talk to each other.
The Six KPIs That Actually Answer Utilization Questions
Not every metric is worth tracking. The ones below directly connect to operating margin — vanity metrics that look good on a slide but don't inform a decision are excluded. Every KPI here should be visible per-trailer, per-week, on one dashboard.
What Unified Data Actually Looks Like
The moment all four sources merge under a single trailer identifier, the underused assets stop hiding. Here's the same 5-trailer sample shown two ways — the fragmented view most fleets have today, and the unified view that makes decisions obvious.
Unify tractor, trailer, inspection, and maintenance data in one platform
Every trailer's utilization, cost, revenue, and PM status on one dashboard. Underused assets flagged automatically at 60%, 40%, and 14-day thresholds. Redeployment decisions in minutes, not months.
The Utilization Decision Tree
Data is only useful if it produces a decision. Here's the branching logic top-performing fleets use once a trailer is flagged as underperforming — from first alert to final action.
The Financial Case — What Underutilization Actually Costs
A trailer sitting in the yard isn't "free." It's carrying fixed costs every month whether it moves or not. Here's what the math looks like on a 200-trailer fleet with a 15% underutilization rate — meaning 30 trailers effectively producing nothing.
| Cost Category | Per Trailer / Month | × 30 Idle Trailers | Annual Total |
|---|---|---|---|
| Depreciation | $420 | $12,600 | $151,200 |
| Insurance | $180 | $5,400 | $64,800 |
| Licensing / IFTA / permits | $95 | $2,850 | $34,200 |
| PM & inspection (§396.17 annual) | $120 | $3,600 | $43,200 |
| Yard space / storage cost | $85 | $2,550 | $30,600 |
| Total dormant capital cost | $900 | $27,000 | $324,000 |
Frequently Asked Questions
Trailer utilization is the percentage of available operating time a trailer spends actively earning revenue — moving loaded or empty under a paid dispatch. The formula is: revenue hours divided by available hours, per trailer, over a defined period (usually monthly). "Available" means the trailer isn't in the shop, isn't out of service, and isn't otherwise unavailable for dispatch. Industry-average trailer utilization sits around 60% — meaning a typical trailer is idle for four out of every ten operating hours the fleet is paying to own. Top-decile fleets run 70-80% utilization on their active trailer base; anything below 60% is flagged as underperforming and anything below 40% typically triggers a redeploy-or-sell decision. Simple time-based utilization can also be calculated as: monthly total hours used across the trailer fleet ÷ (total working hours available × fleet size), usually assuming 8 or 16 operating hours per day depending on the operation.
Three reasons. First, tractors have ELDs by federal mandate; trailer telematics is optional and typically only installed on a subset of the fleet. Second, tractor data ties naturally to a driver and a route because the driver is in the seat; trailer data has to be linked to whichever tractor is pulling it at any given moment, which changes constantly in most operations. Third, maintenance and inspection data live in separate systems from the operational telematics — the CMMS tracks the PM history, the DVIR app tracks the inspections, and neither connects to the trailer's movement data. The result: fleets know their tractor utilization down to the hour but can only estimate trailer utilization, usually by aggregating drop-and-hook counts or dispatch records manually. Unified fleet management platforms solve this by using a single trailer identifier across all four data streams so every KPI can be calculated per trailer without manual reconciliation. Try the platform free to see unified trailer analytics in your own data.
Six KPIs cover the vast majority of utilization decisions. (1) Utilization rate — revenue hours over available hours, benchmark 70-80% good. (2) Loaded miles vs deadhead — loaded miles as % of total, target above 85%, industry average 83.3% loaded per ATRI's 2024 benchmarking. (3) Dwell time — hours stationary at customer sites, target under 15% of operating time. (4) Cost per mile per trailer — combines fixed cost, variable cost, and maintenance; ATRI's 2024 all-in benchmark is $2.26 per mile. (5) Revenue contribution per trailer — ties trailer identity to load revenue, requires TMS integration but is the single most consequential metric. (6) Days since last dispatch — the simplest metric and often the most revealing, with 0-3 days healthy and 14+ days triggering redeployment review. Everything else is a supporting metric that helps investigate why one of these six is off.
Roughly $900 per month in fixed costs on a typical dry van trailer — before any variable expenses. That breaks down as approximately $420 depreciation, $180 insurance, $95 licensing and IFTA, $120 for annual PM and §396.17 inspection amortized monthly, and $85 for yard space and storage. On a 200-trailer fleet with a 15% idle rate — meaning 30 trailers effectively producing nothing — that's $27,000 per month or $324,000 per year of dormant capital cost. Industry-wide estimates put the total US fleet underutilized-asset value at roughly $45 billion. The upside of solving the problem is proportionally large: fleets that adopt unified utilization analytics typically see 12-18% cost-per-mile reductions within six months, not from cutting costs but from routing more revenue miles across the same asset base. On a 200-trailer fleet, lifting utilization from 60% to 72% is equivalent to adding 40 trailers of capacity without any purchase.
The decision tree branches on two questions once a trailer is flagged below 40% utilization. First, is the trailer physically available (not stuck in the shop)? If yes and it's not moving, the issue is dispatch or terminal placement — the fix is repositioning to a higher-demand region or rental out through the flexible-capacity market rather than sale. If the trailer is spending significant time in the shop, look at annual maintenance cost as a percentage of asset value: under 8% suggests fix-and-return, over 15% suggests retire-and-dispose. Second, is the maintenance cost trajectory rising? A trailer costing $3K/year in maintenance that will cost $8K next year is a different decision from one holding steady. Chronic low utilization combined with rising maintenance cost is the classic sell signal. Fleets that ignore this signal end up with a "graveyard" of trailers costing $900/month in fixed carrying costs while generating nothing.
No — but the more sources you have, the more accurate the picture. At minimum, you need a unique identifier per trailer that ties to every dispatch (typically via TMS), a way to log when the trailer enters and exits the shop (typically via CMMS or PM records), and a way to track inspections (typically via DVIR app). With just those three, you can calculate utilization rate, days since last dispatch, cost per mile, and revenue contribution. Adding trailer telematics improves dwell time accuracy, deadhead tracking, and unauthorized-use detection — but the ROI of telematics-on-every-trailer only makes sense above roughly 100 units or on high-value cargo. For most mid-size fleets, the biggest win is unifying the data you already have from ELD, TMS, CMMS, and DVIR into a single trailer view. Telematics adds precision but isn't a prerequisite for meaningful analytics. Contact our team to design the unification approach for your fleet's data sources.
The first insight typically appears within days of unification — the moment all data streams merge under one trailer identifier, the outlier assets become visible without any additional analysis. The financial impact takes longer: fleets typically see 12-18% cost-per-mile reductions within the first six months of operating from unified analytics, because that's how long it takes to work through the decision cycle (identify underused trailers, attempt repositioning, then rent or dispose if repositioning fails). The first 30 days usually surface the "obvious" underutilized trailers — units that haven't moved in 14+ days or are running under 40% utilization month after month. The 60-90 day window is where the deeper patterns emerge: specific customer dwell time driving detention losses, terminal-level utilization imbalances, and trailer-type mix problems (too many dry vans, not enough reefers, or vice versa). The compounding effect is what makes the ROI durable — once the process is running, every new asset joins the same visibility model automatically.
See every trailer's utilization, cost, and revenue on one dashboard
Unified data from ELD, TMS, CMMS, and DVIR under one trailer identifier. Automatic flags at 60%, 40%, and 14-day thresholds. Redeployment decisions in minutes — built for fleets tired of paying for trailers that don't move.