Every fleet manager has a fuel dashboard. Almost none of them have the right one. The typical setup shows total monthly fuel spend, average fleet MPG, and a red-yellow-green traffic light nobody trusts — because none of it says which truck is bleeding money, which driver caused it, or whether a skipped PM is the reason. Total fuel spend is a lagging metric. By the time it moves, three quarters have already ended. Real fuel dashboards operate at a different level: per-truck MPG, per-driver MPG, and the relationships between fuel economy, PM compliance, and idle time — updated weekly, with variance from the fleet average flagged automatically. The fleets running these six charts hit 6.9 MPG averages and 8% idle rates while their industry-average peers sit at 6.2 MPG and 18% idle. On a 100-truck fleet, that gap is roughly $127,000 per year in fuel alone before maintenance impact is counted. This guide is the exact six-chart dashboard — what each shows, how to read it, and what action it should trigger this week. Sign up free for Truck Inspection & Maintenance today — no credit card required to build these six charts on your own fleet's data, or contact our team for a dashboard walkthrough configured to your truck count and duty cycle.
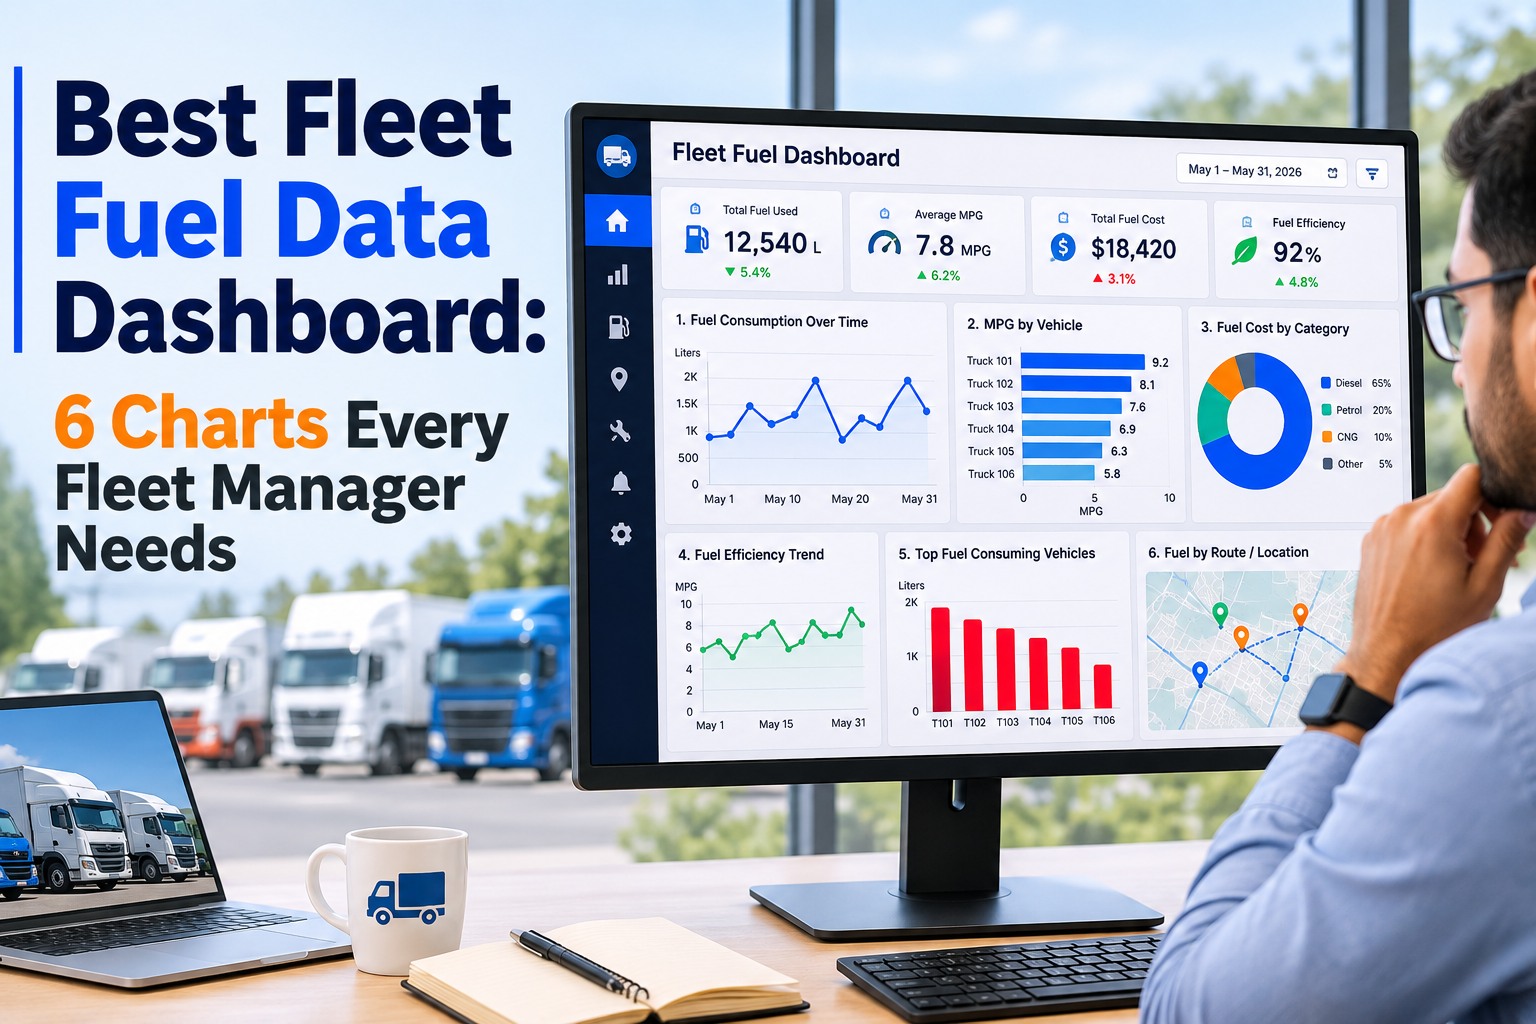
Best Fleet Fuel Data Dashboard: 6 Charts Every Fleet Manager Needs
Total fuel spend tells you nothing. The right six charts tell you which truck, which driver, and which missed PM cost you the money — every Monday morning.
Why "Total Fuel Spend" Is the Worst Fuel Metric
The instinct is to open the dashboard, see the number, and react. But total fuel spend hides every actionable insight underneath aggregate averages. Three specific ways the metric fails as a management tool.
Chart 1 · MPG by Truck — The Outlier Finder
A horizontal bar chart sorted worst-to-best, with the fleet average marked. This is the single most useful fuel chart in fleet management — it identifies the trucks bleeding money in 5 seconds and points to the maintenance investigation that follows.
Chart 2 · MPG by Driver — The Behavior Chart
Driver behavior accounts for up to 33% of MPG variance between identical vehicles on identical routes. This chart isolates the driver from the truck by normalizing across the assigned vehicle's fleet-relative baseline. Same chart shape as Chart 1, different unit.
Chart 3 · MPG vs PM Compliance — The Correlation Chart
A scatter plot. X-axis: PM compliance % per truck. Y-axis: MPG. Watch the pattern emerge — trucks with high PM compliance cluster in the high-MPG zone, trucks with deferred PMs cluster in the low-MPG zone. This chart quantifies the ROI of maintenance in a way a maintenance manager can show a CFO.
HIGH MPG
(rare)
HIGH MPG
(healthy)
LOW MPG
(bleeding money)
LOW MPG
(investigate)
Build these 6 charts on your own fleet's data — this week
Automatic MPG-per-truck, MPG-per-driver, PM correlation, idle trend, cost-per-mile, and top-offender feeds. Weekly refresh. Variance flags. Coaching alerts tied to specific drivers and specific trucks.
Chart 4 · Idle % Trend — The Behavior Compliance Chart
A line chart showing fleet-wide idle percentage over the last 12 weeks. Diesel engines burn 0.8-1.0 gallons per hour at idle. Long-haul trucks average 1,800 idle hours per year — that's $5,000-7,000 in fuel per truck burned while stationary. The trend line is the leading indicator of whether your idle policy is enforced or just written.
Chart 5 · Fuel Cost per Mile — The Economics Chart
MPG is a physical metric. Cost per mile is a financial one. Combining fuel spend with miles driven per truck reveals the trucks whose real economics have quietly degraded. This chart is what a CFO looks at.
Chart 6 · Top Fuel-Waste Offenders — The Action List
A ranked table of the trucks and drivers currently costing the fleet the most. Not a chart in the traditional sense — a triage list. Every Monday morning, the fleet manager works from this list top-down. Solve the top 5, they're replaced by the next 5. Repeat weekly.
| Rank | Unit / Driver | Issue | MPG / Idle % | $ Excess | Action |
|---|---|---|---|---|---|
| 1 | T-014 | DPF regeneration cycle backlog | 4.9 MPG | $2,100 | Shop this week |
| 2 | T-088 | Alignment / uneven tire wear | 5.6 MPG | $1,650 | Alignment inspection |
| 3 | Driver 22 | Harsh accel · high idle | -14% baseline | $1,540 | Coach this week |
| 4 | T-045 | Tire pressure across drive axle | 5.9 MPG | $1,470 | Yard PM check |
| 5 | Driver 08 | Idle % 24% (fleet avg 8%) | 24% idle | $1,480 | Coach + scorecard |
The Monday Morning Workflow — 20 Minutes, Every Week
The dashboard only produces results if it drives an action rhythm. Here's the 20-minute Monday routine top fleet managers run.
Frequently Asked Questions
Six charts cover every actionable fuel decision. (1) MPG by truck — a sorted bar chart identifying which trucks bleed money, updated weekly. (2) MPG by driver — driver behavior isolated from truck baseline to identify coaching targets. (3) MPG vs PM compliance scatter — quantifies the ROI of maintenance on fuel efficiency, the highest-value chart for showing a CFO. (4) Idle % trend line — 12-week fleet idle percentage as the leading indicator of idle policy enforcement. (5) Fuel cost per mile — turns physical MPG into financial cost, the number that drives disposal and replacement decisions. (6) Top 5 fuel-waste offenders — a weekly triage list combining trucks and drivers, worked top-down every Monday. Everything else is a supporting metric. Total fuel spend, the metric most fleets start with, isn't in this list — it aggregates every insight the other six charts surface.
For medium-duty trucks, industry average is roughly 6.2 MPG and top-performing fleets sit above 7.0 MPG. For heavy-duty combination tractors, industry average is around 6.5 MPG with top performers above 7.5 MPG (though duty cycle changes this significantly). Vocational vehicles like refuse and construction trucks average 3.5-5.0 MPG due to stop-start duty and heavy accessory loads. Light commercial vans typically run 15-22 MPG. The absolute number matters less than variance from your own fleet's median — a truck running 10% below your fleet's mean is a mechanical or driver-behavior investigation regardless of what the industry benchmark says. Fleets that track MPG per truck weekly and act on outliers typically move their fleet average up 8-12% within 90 days, worth roughly $127,000 per year in fuel on a 100-truck fleet at 2026 diesel pricing.
Significantly, and it's the highest-ROI fuel intervention in most fleets. Deferred oil changes increase internal friction. Clogged air filters restrict combustion. Under-inflated tires and misaligned axles add rolling resistance. Neglected DPF regeneration cycles force additional fuel burns for cleaning. Worn injectors atomize fuel poorly. Each individually accounts for 2-8% MPG loss; combined on a truck with 60-70% PM compliance, the cumulative penalty routinely exceeds 15%. Fleets moving PM compliance from 72% to 85% typically save $1,800-2,400 per vehicle per year, most of which is fuel efficiency recovery rather than avoided repair cost. This is why Chart 3 — MPG vs PM compliance scatter — is the single most valuable chart for showing a CFO the return on maintenance investment. The correlation is direct, measurable, and reversible in weeks. Try the platform free to see the correlation on your own data.
Diesel engines burn roughly 0.8 to 1.0 gallons per hour at idle. Long-haul trucks average approximately 1,800 idle hours per year, which translates to 1,500-1,800 gallons of fuel burned while the truck sits stationary. At 2026 diesel pricing, that's roughly $5,000-7,000 per truck per year in idle fuel alone — before counting engine wear, oil degradation, and DPF regeneration cycles the idle time forces. On a 100-truck long-haul fleet, unmanaged idle represents $500,000-700,000 annually. The typical intervention path takes fleet idle from 28% to 8% within two quarters through real-time alerts, daily scorecards, weekly coaching, and monthly KPI review. The savings compound because idle hours also drive engine hours, which drive PM intervals — cutting idle 20 percentage points effectively extends every PM interval by roughly the same proportion.
Yes — driver behavior accounts for up to 33% of MPG variance between identical vehicles on identical routes. The highest-impact behaviors are aggressive acceleration (roughly 15-20% MPG penalty vs smooth throttle), speed over the fleet-optimal cruising speed (roughly 6% MPG loss per 5 MPH above optimum), inconsistent cruise-control use, high-RPM shifting patterns on manual transmissions, and excessive idle. Two drivers on the same truck running the same route can produce a 1.5-2.0 MPG spread purely from driving style. This is why Chart 2 — MPG by driver — normalizes for the assigned truck's baseline rather than showing raw MPG (which would just reflect which truck the driver was in that week). Driver coaching based on weekly scorecards can cut fleet fuel spend 15-22% while also reducing maintenance costs through less harsh brake wear and drivetrain stress. Coaching produces behavior change; alerts alone don't. Contact our team for a driver coaching template.
Monday-morning weekly review is the sweet spot for most operations. Daily review of aggregate numbers creates alert fatigue — the numbers don't move enough day-to-day to warrant daily attention, and the noise drowns out the signal. Monthly review is too infrequent — by the time an outlier appears in the monthly total, three or four weeks of waste have accumulated and the driver or truck involved has moved past the specific decisions that caused it. Weekly review at 20 minutes on Monday morning gives the manager time to work Chart 6's offender list, assign each row to an owner with a target close date, and send coaching emails to underperforming drivers while the prior week's context is still fresh. Real-time alerts should trigger on individual events (5-minute idle threshold, 20+ MPH over limit, hard-brake events) but shouldn't replace the weekly rhythm. Quarterly deep-dive reviews add strategic context — replacement decisions, procurement, budget forecasting — but don't substitute for the Monday routine.
Four data sources cover all six charts. First, telematics data from your existing ELD or fleet tracking provider for MPG, engine hours, idle time, and speed. Second, fuel card transactions (Comdata or similar) tied to specific trucks and drivers for fuel spend and volume. Third, PM records from your CMMS or maintenance spreadsheet for compliance percentage per truck. Fourth, driver-vehicle assignment history from your dispatch or TMS system so driver-level metrics can be attributed correctly across truck swaps. The technical challenge isn't getting the data — it's unifying it under a single truck identifier so charts refresh automatically instead of requiring weekly manual reconciliation. Fuel variance is worth calling out separately: an estimated 14% of fleet fuel payments were lost to fraud or theft in 2024, most of it undetected, so cross-checking fuel card transactions against telematics-reported fuel consumption catches skimmed transactions the fuel card provider won't flag on their own.
Six charts, one dashboard, one Monday morning workflow
Automatic MPG-per-truck ranking. Driver behavior indexing. PM correlation analysis. Idle trend tracking. Cost-per-mile economics. Weekly offender triage. Built for fleets that want to stop guessing about where the fuel goes and start acting on it.