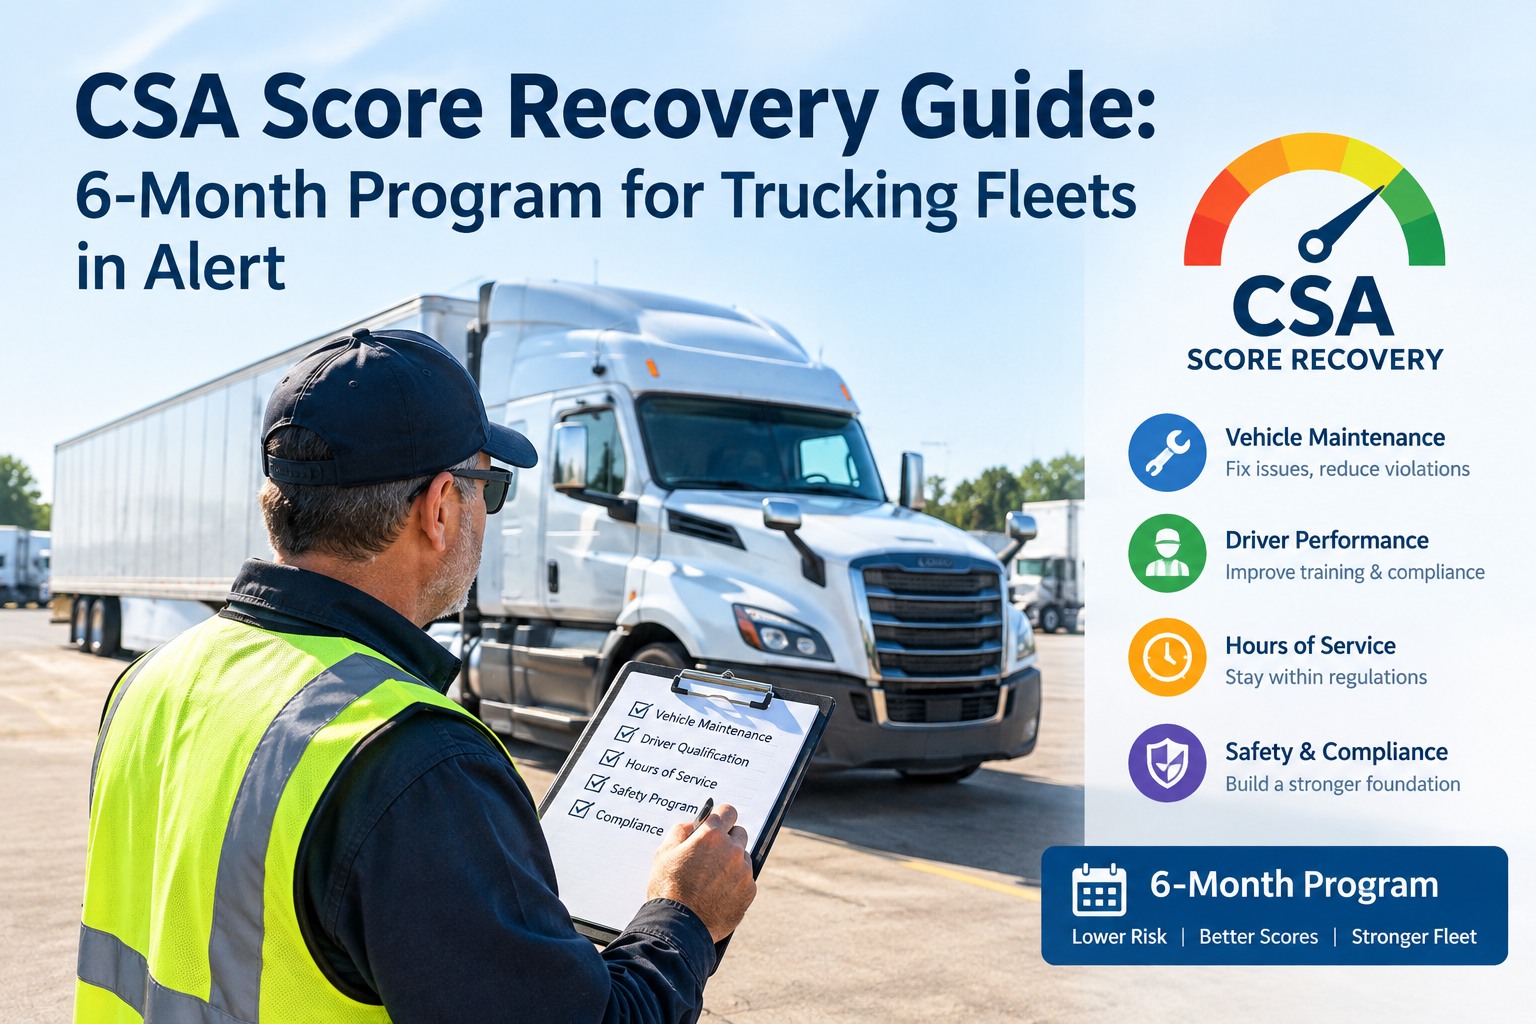
An 80th percentile in Vehicle Maintenance isn't a death sentence — it's a 6-month project. Fleets in the alert range that follow a structured recovery program consistently drop 15-30 percentile points inside two quarters. Fleets that don't follow a program stay stuck, keep taking the same violations, and watch their insurance quotes climb. This article lays out the exact 6-month recovery plan — what to do in month 1, month 2, month 3 — with the weekly KPIs to track and the trajectory to expect at each checkpoint. Start a free trial to run the recovery program on one dashboard.
CSA Score Recovery Guide: 6-Month Program for Trucking Fleets in Alert
A structured, month-by-month recovery plan for fleets sitting above the 80th percentile in Vehicle Maintenance or Vehicle Maintenance: Driver Observed. Six phases, weekly KPIs, and the trajectory to expect at each checkpoint.
Before You Start: Diagnose the Score
Two fleets at the same percentile can need entirely different recovery programs. The first hour of any recovery goes into understanding which violations built the score — not just the score itself.
Log into csa.fmcsa.dot.gov. Export every roadside inspection and every violation from the last 24 months. This is the raw data every recovery decision depends on.
Group into brakes / tires / lights / load securement / driver-observable / other. Whichever category represents 40%+ of your violations is where 80% of your recovery effort goes.
Any violation you can prove was misattributed, wrongly cited, or corrected on-site is a DataQs challenge candidate. Flag every one — successful challenges drop off your record entirely.
Sample the last 30 days of your DVIRs. What percentage were filed on time? What percentage flagged defects? Ratios below fleet averages are recoverable in weeks.
The 6-Month Recovery Program
Every phase builds on the previous one. Skipping ahead — trying to get to "clean inspections drive percentile down" without first fixing the underlying discipline — is the single most common recovery failure.
Focus: Get every winnable violation off the record. This is the fastest percentile movement you'll ever make.
Focus: Every driver, every day, every truck. Zero exceptions. This month is where the Vehicle Maintenance: Driver Observed category actually starts moving.
Focus: Every defect closed. Every PM current. Every truck deferred repair grounded until fixed.
Focus: Every clean inspection from here forward drives the percentile down. Discipline is now infrastructure — the goal is stability.
Focus: Identify recurring violation patterns; systemize prevention. This month separates lasting recovery from temporary improvement.
Focus: Convert the recovery program into permanent operating discipline. Program success is measured in what stays in place, not just percentile at month 6.
The Weekly KPI Dashboard
Six metrics, checked every Friday, tell you whether the program is working. Miss any one for two weeks running = intervention required before it derails the whole recovery.
% of expected daily DVIRs actually submitted. Below 98% and driver-observable violations will keep coming.
Random 10% sample scored for completeness and photo attachment. Below 90% means DVIRs are being filed but not filled out.
% of scheduled PMs completed on time. The single strongest predictor of Vehicle Maintenance BASIC recovery.
Any defect open longer than 14 days is a walking violation waiting for a roadside inspection. Non-negotiable zero.
% of roadside inspections in prior 30 days with zero violations. This is what actually drives your percentile down.
Average time from filing to decision on your open challenges. Faster resolution = faster percentile improvement.
The Recovery Program on One Dashboard
Truck Inspection & Maintenance replaces paper DVIRs and PM spreadsheets with mobile inspections, automated work orders, and real-time compliance dashboards — the exact tooling a recovery program requires. All six KPIs tracked automatically, all DataQs evidence organized per violation, all recovery reports one click away.
The DataQs Sub-Program: Getting Violations Removed
DataQs challenges are the single fastest way to move a CSA percentile — but only when filed with the right evidence. Three challenge categories cover about 80% of successful outcomes.
What it is: Violation cited against your DOT number but the truck or driver wasn't yours.
Evidence: Registration records, driver logs, dispatch records showing the unit/driver was elsewhere.
Success rate: Very high when evidence is clean.
What it is: Driver-observable violation cited at roadside, but your DVIR from that day flagged the defect and it was being handled.
Evidence: Time-stamped DVIR entry, photo, work order in progress at time of inspection.
Success rate: Moderate to high with complete DVIR chain.
What it is: Minor defect noted and corrected at the roadside inspection point itself, no violation warranted.
Evidence: Officer's inspection report notes, driver statement, subsequent clean re-inspection if available.
Success rate: Moderate; depends heavily on officer report wording.
The Five Recovery Traps
Every fleet that fails at recovery fails for the same handful of reasons. Watching for these ahead of time is the cheapest insurance available.
Frequently Asked Questions
Yes, if the score built up from correctable issues rather than one catastrophic incident. Fleets whose alert status came from DVIR quality issues, missed PMs, and driver-observable violations typically see 15-30 point improvements in 6 months with disciplined execution. Fleets whose alert status came from a serious crash or a hazmat incident see slower recovery because those specific events age off the calculation on their own 24-month timeline. Diagnose the source of your score before setting recovery expectations. Start free and run the diagnostic in the first week.
Typical timeline is 30-60 days from filing to decision. Some states resolve faster; complex cases can run 90+ days. What accelerates resolution is complete evidence at filing time — a challenge with clear supporting documentation moves through review faster than one requiring back-and-forth requests. File every challenge with all evidence attached the first time. The recovery program above front-loads DataQs work in month 1 specifically because decisions coming back in months 2-3 provide the largest early percentile drop.
Focus the first 90 days on the category with the highest percentile — that's the one closest to triggering intervention. Because the two Vehicle Maintenance categories (Vehicle Maintenance and Vehicle Maintenance: Driver Observed) share driver-observable violations, tightening DVIR discipline in month 2 typically improves both categories simultaneously. Cross-category recovery is one of the hidden benefits of the DVIR discipline reset — it moves multiple percentiles from a single effort.
At minimum: a way to capture DVIRs with photos and timestamps, a PM scheduling system with per-unit compliance tracking, work order tracking with defect-to-closure timing, and a dashboard for the six KPIs. Spreadsheets can work for fleets under 20 trucks; beyond that, they break down under recovery-program intensity. A unified platform with DVIRs, PM scheduling, work orders, and compliance dashboards in one place eliminates the coordination overhead that kills recovery programs by month 3. Ask about recovery-ready configurations.
Recovery Requires the Right Tools From Day One
Truck Inspection & Maintenance replaces paper DVIRs and PM spreadsheets with mobile inspections, automated work orders, and real-time compliance dashboards — helping fleets lift PM compliance above 95% and stay DOT-ready year-round. The exact stack a 6-month recovery program requires, unified in one platform.