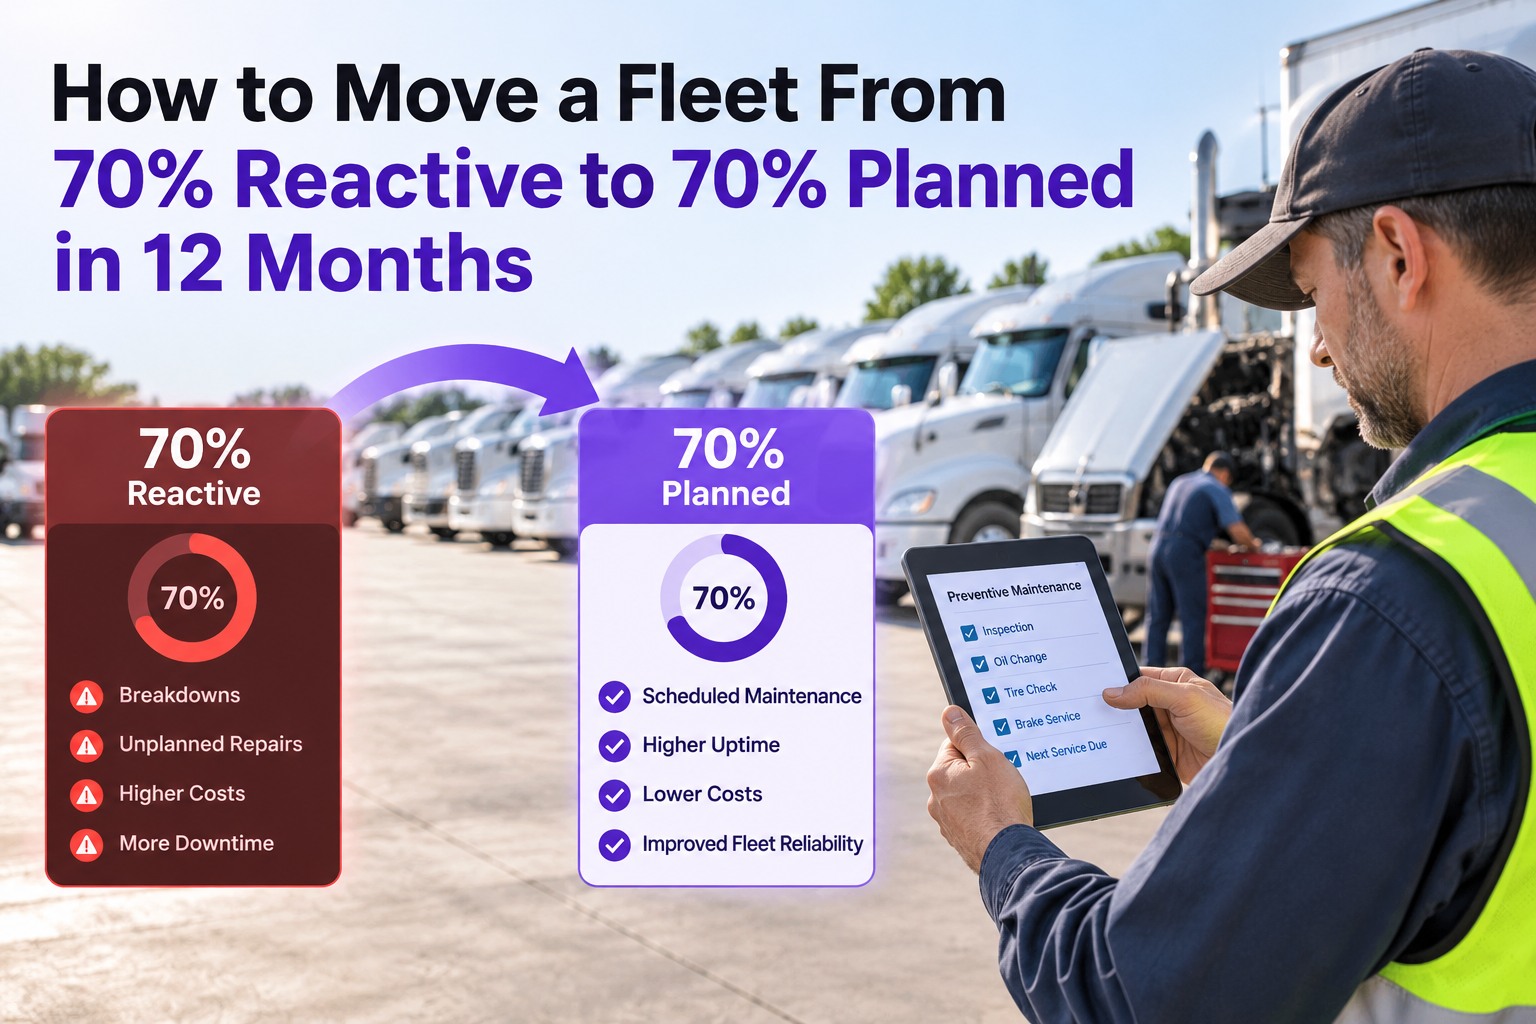
Most mid-size fleets run somewhere near 70% reactive — two out of every three maintenance hours spent chasing a breakdown that already happened. It feels normal because it's constant, but reactive work costs three to ten times what the same job costs planned, once you add expedited parts and overtime. Flipping that ratio to 70% planned in a year is realistic, but not by trying harder — it takes a staged program with monthly milestones and a few organizational changes that make the gains stick. This guide lays out that 12-month path, the one KPI that actually measures it, and how Truck Inspection & Maintenance Management Software (TIM) carries the workflow underneath it. Start free and begin the shift to planned with TIM.
Two-Thirds of Your Maintenance Hours Are Spent After the Breakdown
Running 70% reactive means your shop is always behind the truck — firefighting, paying overtime, and rescheduling loads around failures you didn't see coming. The fix isn't more hours; it's a staged, one-year program that moves the ratio a few points a quarter until planned work is the norm. TIM gives the program its spine: PM reminders that fire on time, DVIR defects that become scheduled work orders, and the planned-vs-reactive ratio tracked on one dashboard so you can prove the shift is happening.
First, Measure the Ratio the Right Way
You can't move a number you're not counting correctly, and this is the number most fleets get wrong. The planned-maintenance ratio is calculated on labor hours, not job count — because a 30-minute PM check and a 10-hour emergency rebuild are not one-for-one.
Count by hours, not tickets. Ten quick PMs and one 10-hour breakdown is a 50/50 hour split — even though it looks like 90% planned by job count. The hour-based number is the honest one.
The 70% planned target this program aims for sits right in that proven band — ambitious for a reactive fleet, but well within reach in a year. Contact our team to baseline your fleet's ratio in TIM.
Why Reactive Costs So Much More
The ratio matters because the two kinds of work aren't priced the same. A planned job happens on schedule, with the part on the shelf and the truck already off the road. The same failure caught reactively costs far more — and the multiplier is why the shift pays for itself.
- Part ordered ahead at normal price
- Repair slotted into a scheduled bay
- Truck taken down when it's not earning
- Regular-time labor
- Part expedited at a premium
- Bay cleared, other work bumped
- Truck down mid-load, dispatch scrambling
- Overtime or roadside labor
The 12-Month Program, Quarter by Quarter
The shift doesn't happen in one leap — it happens in four quarters, each with a job to do. Rush it and the gains slip back; pace it and each quarter locks in before the next builds on it.
- Measure the real ratio by labor hours — your honest starting point
- Route every request through one intake, no more hallway work orders
- Get every truck on a basic PM schedule, even a rough one
- Move DVIRs to mobile so defects reach the shop the same day
- Build a priority matrix: what's a true emergency vs. schedulable
- Hold a weekly planning hour — confirm parts and truck availability
- Stop letting non-urgent work jump the queue as "urgent"
- Start trending PM compliance per truck, not just fleet-wide
- Tune PM intervals to each truck's real usage, not a calendar guess
- Stage common parts so a scheduled job never waits on a back-order
- Close the DVIR-defect-to-work-order loop on every unit
- Review repeat failures — a recurring reactive job is a missed PM
- Put the ratio on a dashboard everyone sees weekly
- Tie shop and driver habits to keeping the schedule intact
- Audit that certified repairs actually close the defect
- Lock the gains — the ratio holding is the real finish line
Each quarter's target is a modest few-point gain — the pace research shows actually sticks. Start free and run the 12-month program on one system with TIM.
The Program Needs a System Underneath It — Not a Spreadsheet
A 12-month shift falls apart if PM reminders live in one place, DVIRs in another, and the ratio in a spreadsheet someone updates when they remember. TIM holds the whole program on one record: PM schedules that fire on time, DVIR defects that convert straight to scheduled work orders, parts flagged before the truck comes in, and the planned-vs-reactive ratio tracked automatically — so every quarterly milestone is measured, not guessed.
The KPIs That Tell You It's Working
The headline ratio is the destination, but these are the gauges that move first — the leading signs the program is on track before the ratio catches up.
What Actually Makes It Stick
Plenty of fleets hit 70% planned for a month, then slide back. The difference between a spike and a lasting shift isn't the tools — it's a handful of organizational changes that outlast the push.
The Workflow That Carries the 12 Months
Every stage of the program maps to something TIM does automatically — so the shift is built into the daily workflow, not bolted on as extra reporting.
Frequently Asked Questions
Is flipping from 70% reactive to 70% planned in a year realistic?
How do I calculate my planned maintenance ratio?
Why does reactive maintenance cost more than planned?
What's the single most important first step?
How do I stop the gains from sliding back?
Turn Maintenance From Firefighting Into a Schedule
Seventy percent reactive isn't a fact of fleet life — it's a ratio, and ratios move when you work them in stages. Measure it honestly, standardize intake, protect the planning hour, and grow the planned side a few points a quarter until it's the norm. TIM carries the workflow underneath every step — PM on time, defects scheduled, the ratio tracked — so a year from now the shop is ahead of the truck instead of chasing it.