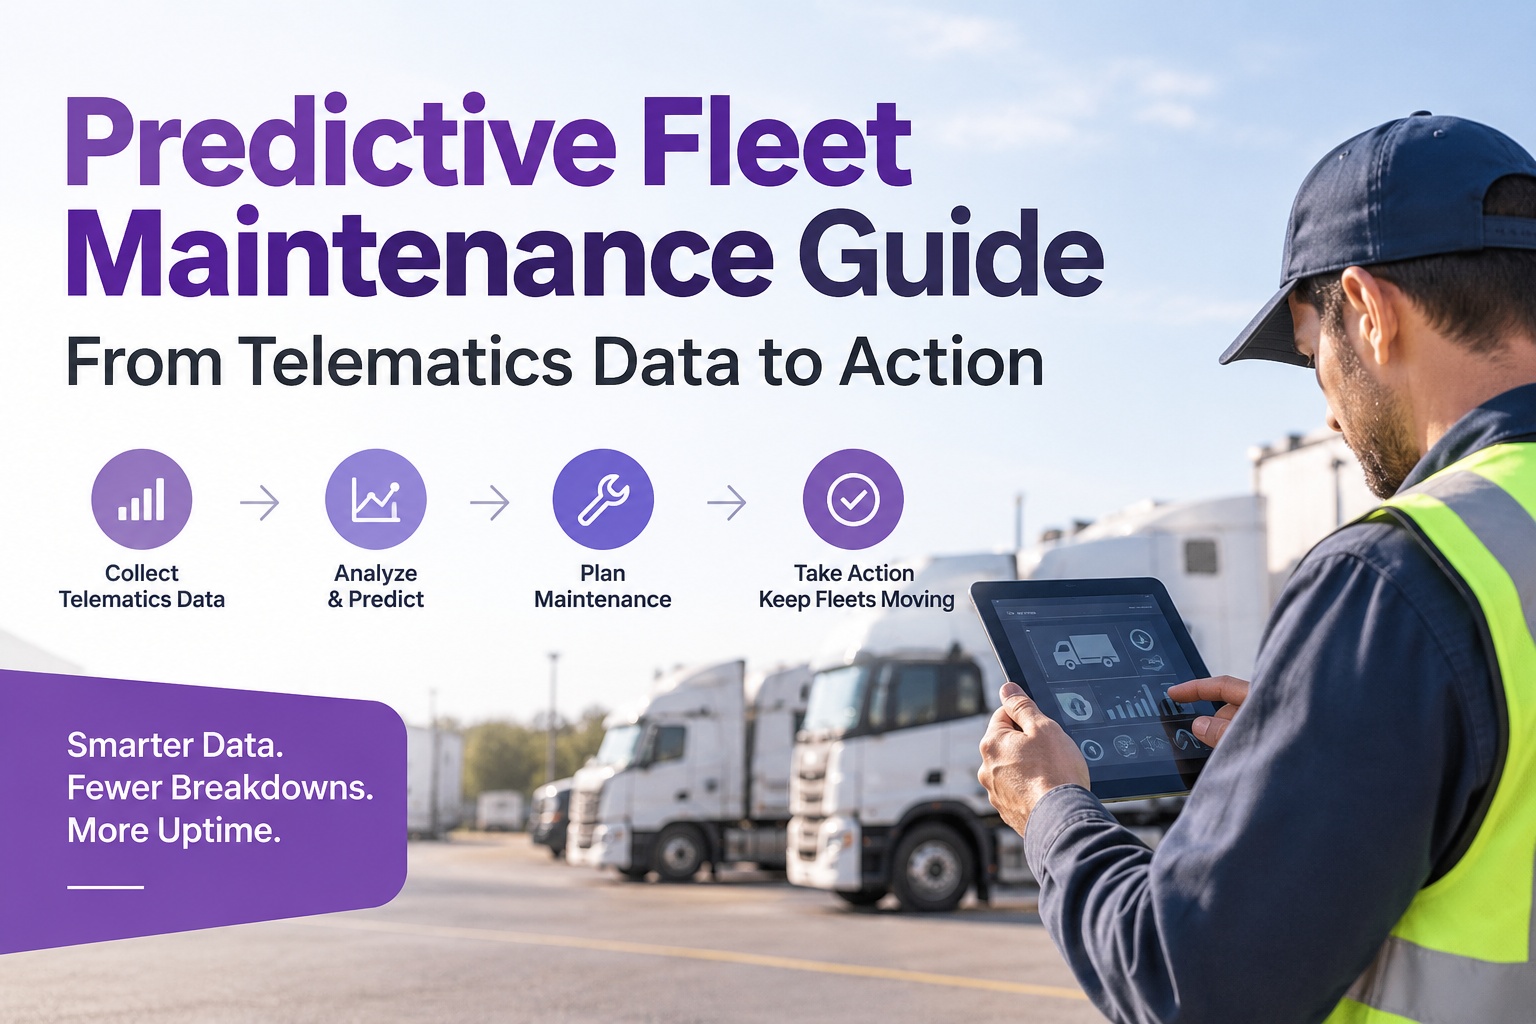
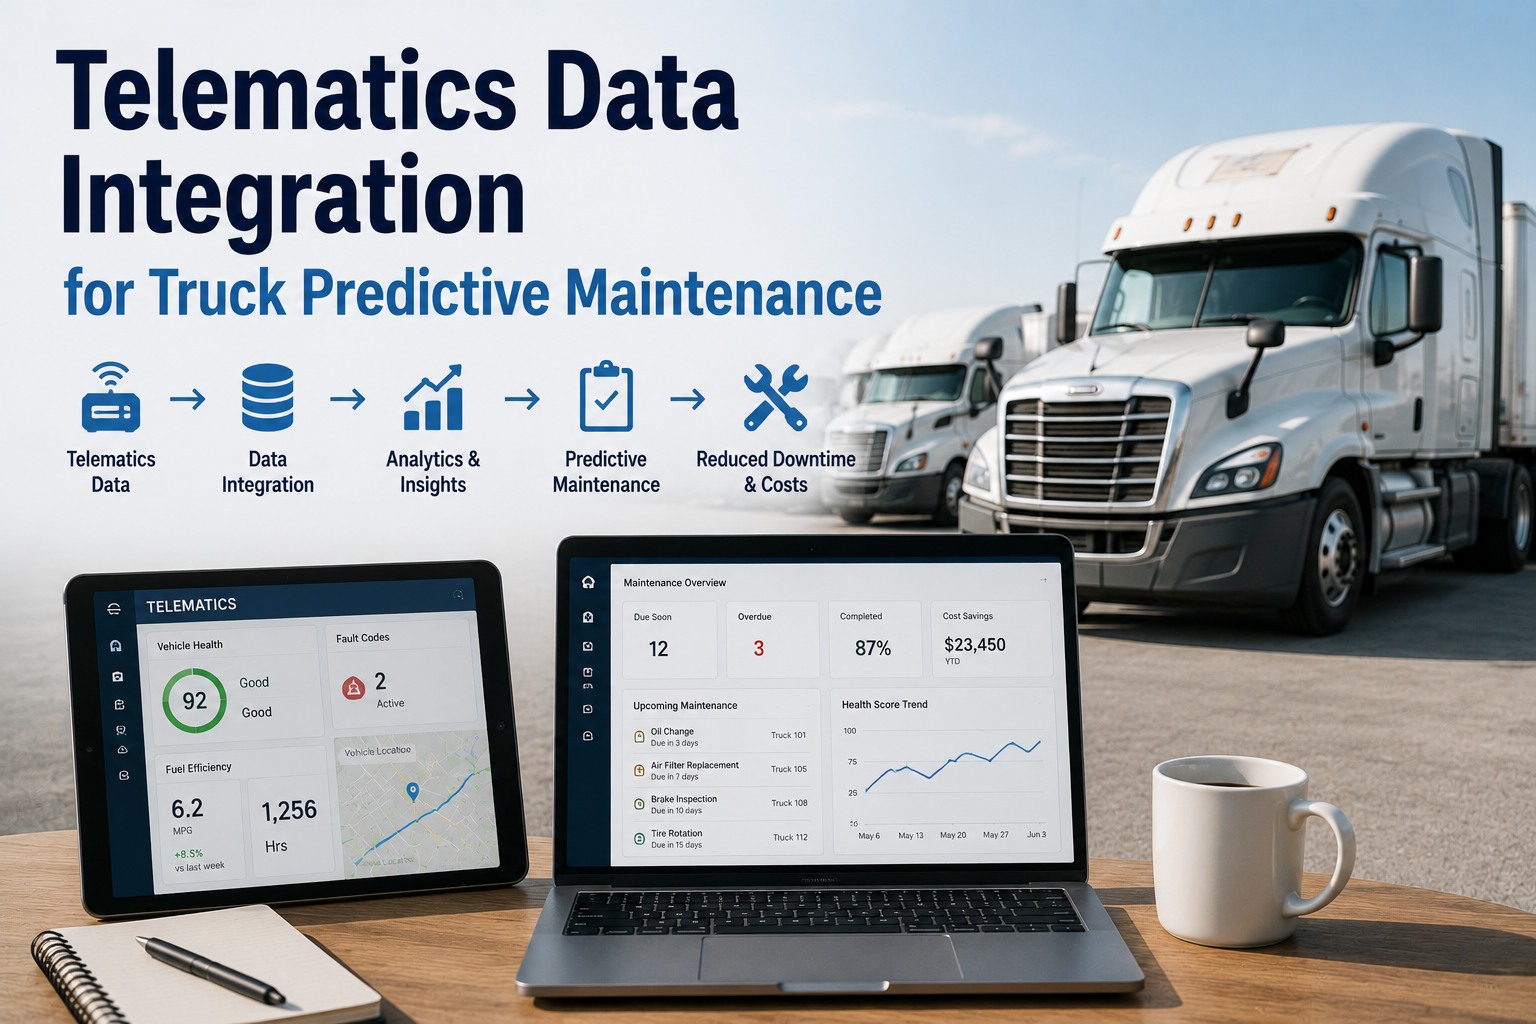
Every fleet has been told predictive maintenance is the future. Almost no fleet actually runs it — because most predictive claims are marketing dressed on the same fixed-mile schedule everyone already has. The real thing is different: telematics data feeding actual failure-prediction signals, those signals surfacing before a breakdown, and the maintenance system acting on them without a person having to notice. It's harder than PM. It's cheaper than breakdowns. And it starts with the four data streams every telematics system already collects. Start free and build the pipeline from telematics to action.
Predictive Maintenance · Telematics Data · Failure Signals
Turn Telematics Data Into Action Before the Breakdown
Predictive maintenance isn't a bigger PM schedule — it's the discipline of watching for failure signals in data you already collect, then acting before the failure lands. Truck Inspection & Maintenance Management Software watches four data streams continuously, flags trucks trending toward failure, and routes the intervention while it's still cheap.
4 signalsdata streams a predictive program needs
30-90 daystypical warning window before failure
~40%reduction in unplanned downtime when done right
The Maintenance Maturity Curve — Where Predictive Fits
Every fleet sits somewhere on a four-stage maturity curve, and predictive doesn't replace what came before — it's the fourth stage that only works when the first three are running well. Skipping preventive maintenance to jump straight to predictive is how fleets waste six figures on analytics they can't act on.
STAGE 1
Reactive
Fix it when it breaks.
Highest cost per repair. Truck-off-road time is unpredictable.
STAGE 2
Preventive
Fix on a schedule.
Miles or hours triggers. Catches most wear failures; over-services low-use trucks.
STAGE 3
Condition-based
Fix when a threshold is crossed.
Watches fluid samples, wear indicators, fault codes. Acts on measured degradation, not calendar.
STAGE 4
Predictive
Fix before the threshold is crossed.
Watches trends across signals; predicts failure from patterns. Acts before the alarm fires.
The honest version Most "predictive maintenance" software on the market is Stage 3 with better branding — condition-based alerts sold as prediction. Real Stage 4 requires trend data across weeks, not just current readings, and a rules engine that combines multiple signals into a failure probability. Ask any vendor how their prediction differs from a threshold alert; the answer separates real from marketing.
The Four Data Streams Every Predictive Program Needs
Predictive maintenance runs on four categories of data, and a good program pulls from all four continuously. Missing any one leaves failure modes invisible; running all four is what makes the prediction defensible.
📊
01
Operational telematics
Mileage, engine hours, idle ratio, fuel MPG, harsh events. The utilization context that determines what "normal" looks like for this truck.
Source: GPS/ELD/ECM
⚙️
02
Diagnostic (DTC) codes
Active and stored fault codes with SPN/FMI detail. Codes that appear and clear are signals; codes that recur are near-certain predictors.
Source: ECM (J1939)
📋
03
Inspection & DVIR data
Defects reported by drivers, photo-tagged over time, wear-severity graded. A tire tread trending down for three inspections is a prediction.
Source: driver DVIRs
🔧
04
Repair history & costs
What broke before, when, how much it cost. The training data for pattern recognition — same asset, same component, MTBF trending shorter is a signal.
Source: work orders
Signals That Actually Predict Failures
Most alerts don't predict; they react. A real predictive signal has a warning window measured in weeks, not minutes, and correlates strongly with a downstream failure. Six patterns that consistently earn their spot in a predictive program.
MPG trending down
Warning: 4-12 weeks
A 3-5% drop in MPG over four weeks, with no route change, correlates with alignment drift, tire pressure loss, aftertreatment restriction, or injector issues. Cheapest signal to act on; earliest to appear.
Recurring DTCs
Warning: 2-8 weeks
A fault code that appears, clears, and reappears within a week is not a glitch — it's a component beginning to fail. Predict from the second occurrence, not the third.
Idle-ratio drift
Warning: 6-12 weeks
Idle ratio climbing without route change signals a driver behavior shift OR an engine start-issue keeping the truck idling. Either way, PM cadence needs to shift to hours-primary.
Tire pressure loss rate
Warning: 1-4 weeks
A tire that loses 2 psi/week vs. the fleet's 0.5 psi/week baseline has a slow leak — bead damage, valve stem, or a nail — and will fail on the road if not addressed.
Brake stroke creep
Warning: 3-6 weeks
Pushrod stroke measurements trending up service by service — before crossing the 2.00" Type-30 limit — predict the next brake adjustment or slack adjuster replacement.
Aftertreatment regen frequency
Warning: 4-16 weeks
Passive regens becoming active, active regens becoming forced — the frequency and severity trend predicts a DPF cleaning or replacement 1-4 months out.
The Pipeline — Data to Decision
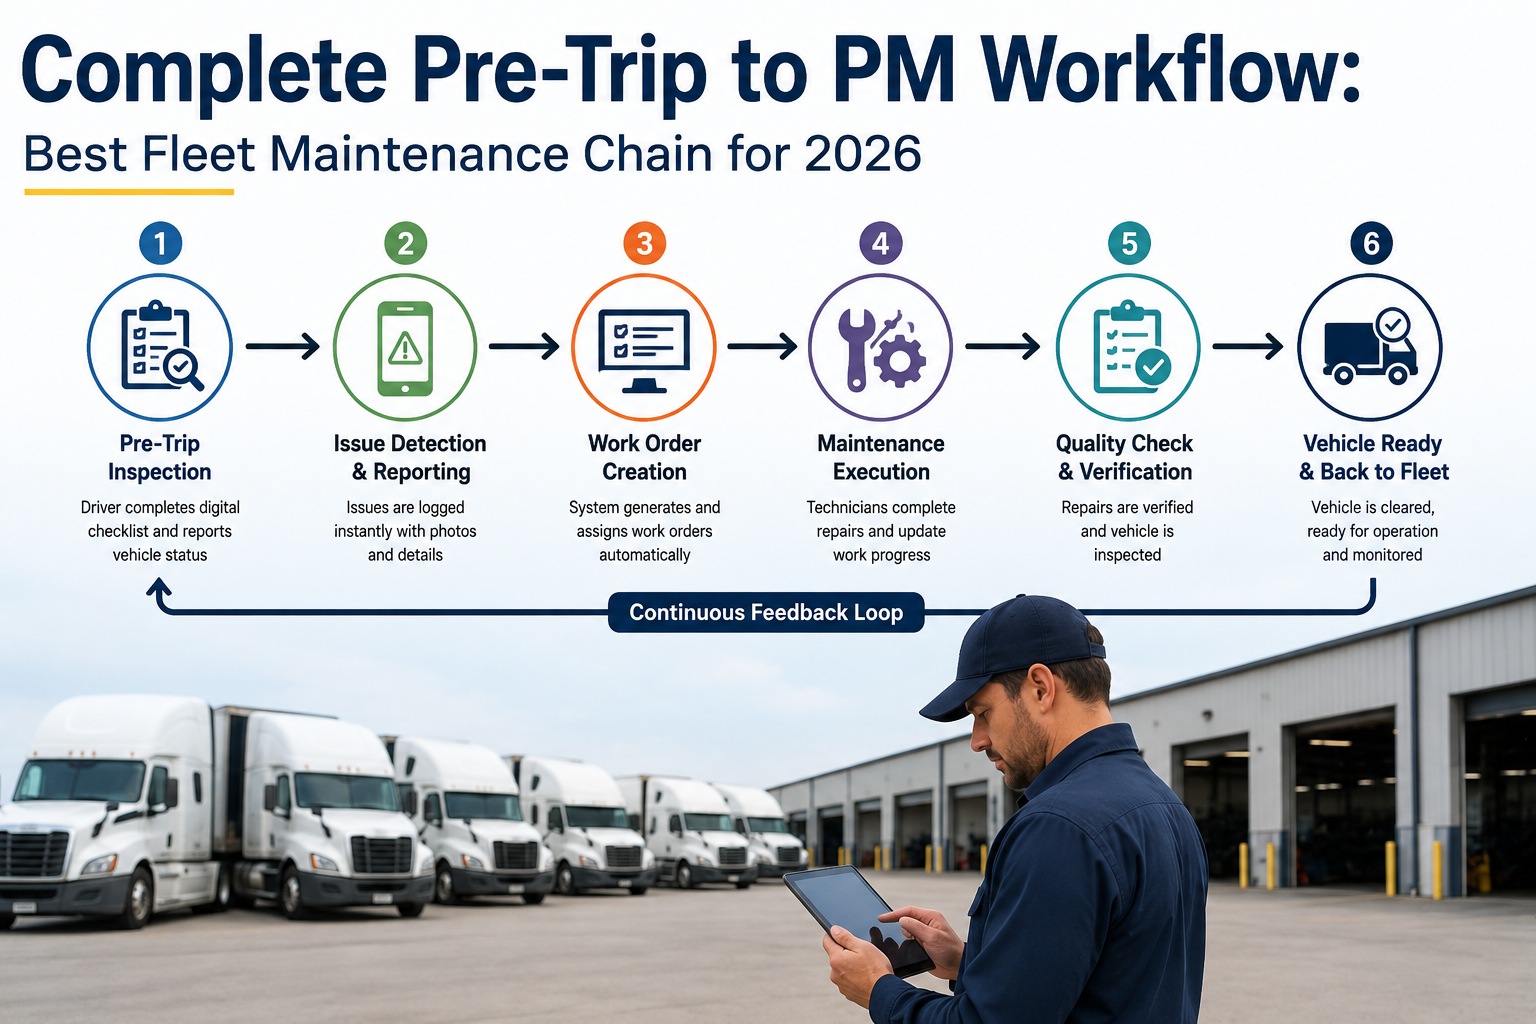
The pipeline turns raw signals into scheduled work. Five stages, each a place where a predictive program either succeeds or breaks. Most fleets have Stage 1 (collection); the value comes from Stages 3 through 5.
01
Collect
Continuous streams from telematics, ELD, DVIRs, and work orders land in one asset record. No manual entry, no CSV.
02
Baseline
4-8 weeks of data establishes each truck's "normal" — MPG range, idle ratio, DTC frequency. Predictions are deltas from baseline, not absolute values.
03
Detect
Rules engine watches for the six signals above (and others per fleet). Signal crosses threshold → flag opens on that asset.
04
Rank
Not every flag is urgent. System scores by severity, warning window, and repair cost avoidance — top-10 list surfaces to the reliability engineer weekly.
05
Act
Top-ranked flags become work orders, scheduled into the dispatch handshake window. Verification loop closes when the actual failure was avoided.
The Whole Pipeline, Running on One Platform
Truck Inspection & Maintenance Management Software runs the full predictive pipeline — collecting telematics/ELD/DVIR/repair data, baselining each asset over 4-8 weeks, watching for the six signal patterns automatically, ranking flags by severity and cost avoidance, and routing top items into the weekly scheduling window. Fleets stop buying analytics platforms that don't connect to their maintenance system and start acting on predictions inside the tool they already use.
What a Predictive Flag Actually Looks Like
An abstract "predictive maintenance dashboard" is worthless without a specific flag a human can act on. Here's the anatomy of a flag that works — and what separates it from a threshold alert.
HIGH PRIORITY
Asset T-2247 · Flag #4471
Detected 14 days ago
MPG trending down · aftertreatment restriction likely
MPG baseline
6.4
MPG current
5.8
Trend
−9.4% / 4 wk
Regens
+38%
Why this is a prediction: MPG drop is sustained (4 weeks), no route change on file, DPF active-regen frequency up 38%. Two correlated signals both pointing at aftertreatment. Predicted failure window: 3-6 weeks. Recommended action: DPF service before it goes forced.
Repair cost avoidance: Scheduled DPF service $600-900 · Forced regen breakdown roadside $2,500-4,500 · Predicted savings $1,900-3,600
What Separates Real Predictive From Marketing Predictive
The industry has enough noise around this term that most fleets can't tell if a vendor is real or not. Five questions that surface the difference — and if a vendor can't answer any one of them, the product is threshold alerts with better branding.
Q1
Does the system baseline per-asset, or use fleet averages?
Per-asset baselines catch that truck 214's "normal" MPG is 5.8 while truck 215's is 7.2. Fleet averages miss both when they drift.
Q2
How many signals does a flag combine?
Real predictions combine 2-4 correlated signals. Single-signal alerts are threshold alerts, not predictions.
Q3
What's the average warning window before failure?
Genuine predictive gives days-to-weeks of lead time. Alerts firing at failure moment don't count. Ask for their number.
Q4
Does the system track prediction accuracy?
A real predictive program measures whether its flags actually preceded failures. If a vendor can't tell you their hit rate, they aren't measuring it.
Q5
Where does the prediction land — as a work order, or as an email?
Predictions that arrive as emails get ignored. Predictions that land as ranked flags in the same queue as PMs get acted on.
Frequently Asked Questions
How long before a predictive program starts producing useful flags?
Baselines take 4-8 weeks to establish — you can't detect drift from a normal you haven't measured yet. So the first month is data collection; useful flags start appearing in weeks 5-8 and stabilize by week 12. Fleets that expect predictive value in the first week either don't have baselining (which means their "predictions" are static thresholds), or they're measuring value against unfair expectations. Real value shows up as month 3-6 unplanned downtime reduction, not week 1 alerts.
Start free and start baselining today
Do we need machine learning or AI to run predictive maintenance?
Not for most of the value — the six signal patterns described here are rules-based, not ML-based, and they capture 70-80% of what a fully-ML system would flag. ML adds value at the margins: unusual combinations of signals, per-asset drift patterns that don't match any predefined rule, cross-fleet learning from thousands of trucks. If a vendor is selling you predictive maintenance as an AI product, ask what percentage of their flags come from rules vs. ML — the honest answer is usually 80/20 rules-dominant, at least at the fleet sizes most operators run.
Contact us to see how our rules engine works
Which failure categories are hardest to predict?
Impact damage and random electrical failures — the categories with no gradual precursor signal. A pothole shears a shock mount; a harness gets pinched during a repair; a battery terminal corrodes suddenly. There's no trend data to catch these because they're events, not degradations. What predictive can do well is everything with a wear curve: aftertreatment, brakes, tires, cooling, wheel-end, injectors. What it can't do is predict the unpredictable — and any vendor claiming otherwise is overselling.
Start free with predictive on wear-curve failures
Is predictive maintenance worth it for a smaller fleet?
Below about 20 trucks, the math is marginal — you don't have enough data to baseline confidently, and one breakdown avoided doesn't pay for a full analytics stack. Above 50 trucks, most fleets recover the platform cost inside a quarter on unplanned-downtime avoidance alone. Between 20 and 50, the answer depends on route type (long-haul is easier to predict than mixed vocational) and asset value (a $200K refrigerated tractor pays back predictive faster than a $60K day cab). Our software scales with fleet size so the platform doesn't over-invest a small fleet.
Contact us to model your fleet's payback
Collect · Baseline · Detect · Rank · Act
Turn the Data You Already Have Into the Failures You Never See
Truck Inspection & Maintenance Management Software runs the full predictive pipeline on the telematics, ELD, DVIR, and repair data your fleet already produces — baselining each asset, watching for the six signal patterns that actually predict failure, ranking flags by severity and cost avoidance, and routing them into the same weekly scheduling window as PM work. Fleets use it to cut unplanned downtime ~40%, extend component life, and stop losing trucks to failures the data was warning them about.
No credit card required. Free for up to 3 trucks. Built for FMCSA-compliant fleets.