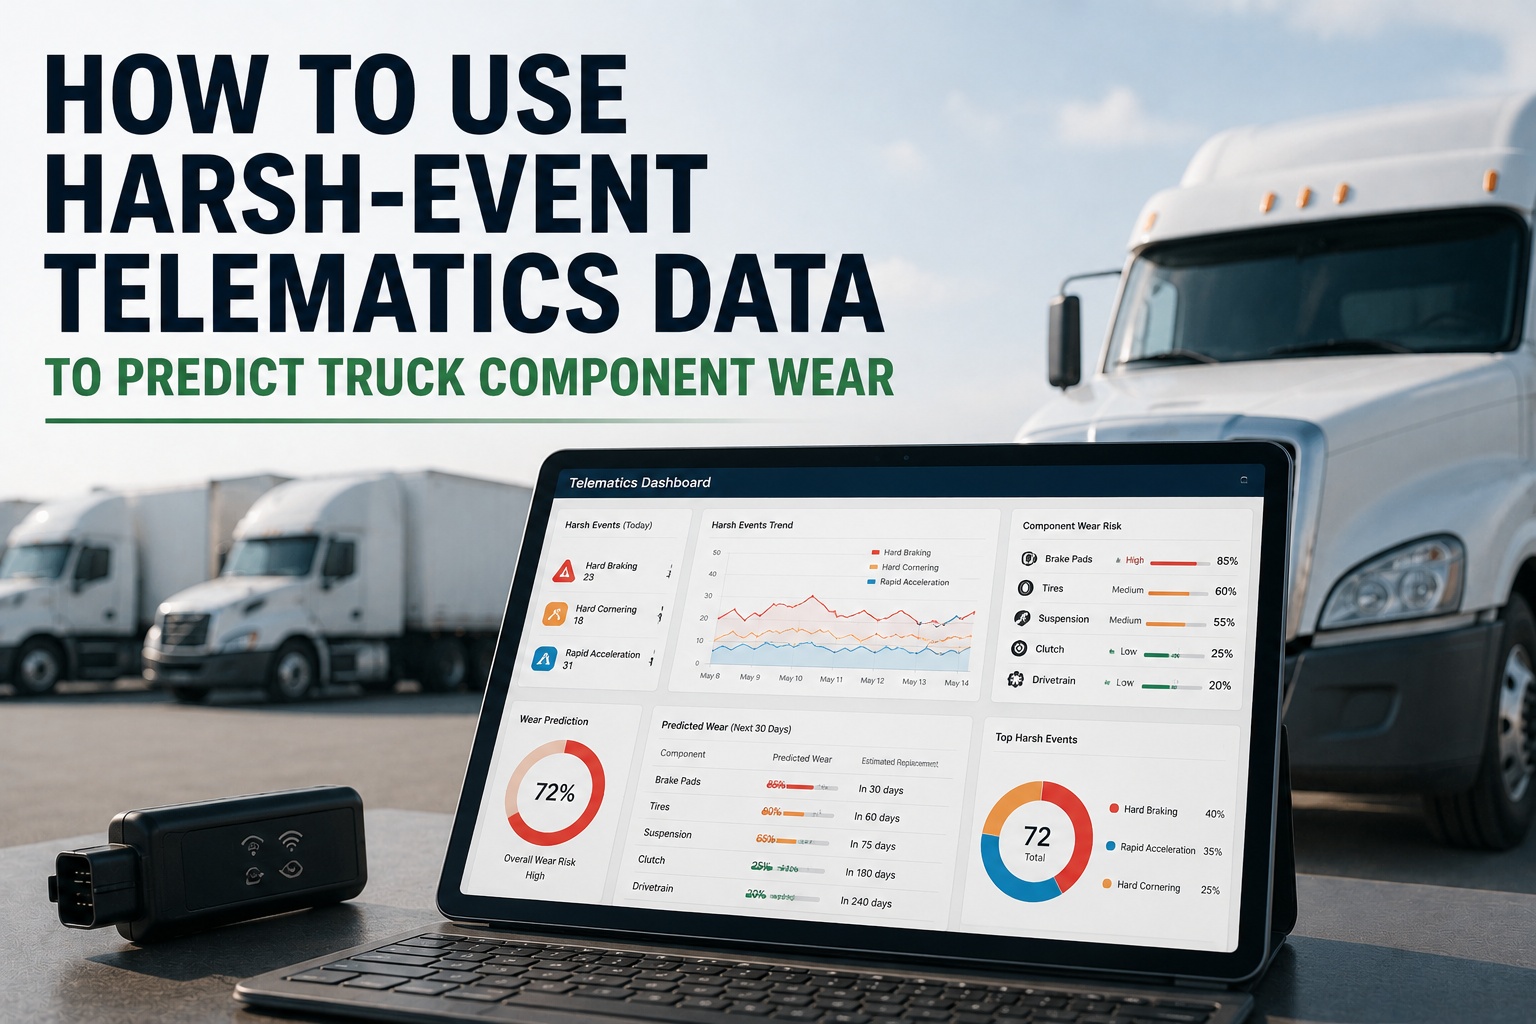
Every harsh braking event, hard acceleration, and sharp corner your telematics unit captures is not just a driver-coaching metric — it's measurable mechanical stress on the truck. Fleets that connect that G-force data to their maintenance system extend brake life 30–50%, catch bearing wear weeks before failure, and stop replacing components on calendar schedules that ignore how the truck is actually being driven. This article breaks down the event-to-wear model and how to use it, plus how Truck Inspection & Maintenance turns harsh-event data into accelerated PM triggers before failures happen. Start a free trial to build the pipeline this week.
How to Use Harsh-Event Telematics Data to Predict Truck Component Wear
Harsh braking, cornering, and acceleration events forecast component wear weeks before failure. The event-to-wear model, the G-force thresholds that matter, and the pipeline that turns telematics data into predictive PM triggers before the truck breaks.
The Data Sitting Unused in Every Fleet
Your telematics unit records a harsh event every time the vehicle's accelerometer registers a G-force spike above a defined threshold. Most fleets look at this data once a month in a driver scorecard, coach the drivers with the worst numbers, and stop there. The engineering signal buried in that same data — a leading indicator of component wear weeks before failure — goes unused.
Rapid deceleration, typically from tailgating or distraction. The most collision-linked event, and the strongest predictor of accelerated brake and tire wear.
Abrupt throttle from stop. Strains drivetrain, transmission, and rear axle components. Also burns fuel disproportionately.
Sharp turns at speed. Loads tires, suspension, bushings, and steering components. Contributes to alignment drift.
Hard braking plus lateral movement within a 3-second window. The strongest predictor of upcoming incidents — and often the trigger for accelerated inspection.
The Event-to-Wear Model: What Each Signal Predicts
Every harsh event type maps to specific components under mechanical stress. Building the model is straightforward: count events per unit per period, weight by G-force, correlate with component replacement history. Within a quarter, patterns emerge that let you forecast wear rather than react to it.
The Four-Stage Pipeline: From Event to Work Order
Turning telematics data into predictive maintenance requires four processing stages. Every stage needs to work, or the pipeline stalls and the whole model becomes theater.
Telematics device logs G-force spikes above threshold. Event tagged with timestamp, GPS location, unit ID, and driver ID from active ELD assignment.
Events roll up per unit per period. Weight by G-force (a 0.4g brake counts more than a 0.27g brake). De-duplicate compound events like near-misses.
Compare per-unit rate against fleet baseline. Units above 150% of baseline get flagged. Component-specific wear predictions map to PM candidates.
Flagged unit gets accelerated PM trigger. Work order opens automatically. Inspection confirms or updates the model. Loop closes.
Setting the Thresholds That Actually Trigger Action
Not every harsh event needs a work order. Most fleets set thresholds too low, generate alert fatigue, and stop responding. These are the practical trigger levels that separate signal from noise.
Above fleet baseline but not alarming. Log for the trend, no action required. Include in monthly driver scorecard.
Meaningful elevation. Pull the truck's next scheduled PM forward. Add a focused brake and tire inspection to that PM.
Unit is under sustained mechanical stress. Trigger a work order regardless of PM schedule. Combine with driver coaching within 48 hours.
Actuarial evidence puts this driver at 6.8× accident risk in the next 90 days. Mandatory coaching plus vehicle inspection — both same-week.
The Pipeline, Built Into One Platform
Truck Inspection & Maintenance integrates the telematics-to-maintenance pipeline into a single mobile-first system — event data connects to accelerated PM triggers, DVIRs capture inspection results, work orders open automatically, and DOT-ready records stay audit-clean. The whole four-stage flow runs without spreadsheets, without integration debt.
Building the Baseline: What "Normal" Looks Like
Predictive models only work against a baseline. Without knowing what your fleet's normal event rate looks like, every truck appears alarming — or none of them do. Building the baseline is the first 30 days of any harsh-event program. Start free and use the platform to run the baseline capture from day one.
Long enough to smooth out route variability and one-off incidents. Short enough to be actionable within a quarter.
Long-haul and P&D units have different event profiles. Set separate baselines by unit class — comparing across classes hides real signals.
Is the truck generating events or is the driver? A truck with different drivers per shift reveals which variable is the source.
Baselines drift as routes, weather, and driver mix change. Re-baseline quarterly to keep thresholds tuned to reality.
The Common Mistakes That Kill Predictive Programs
Every fleet that fails at this fails for the same reasons. Recognizing them ahead of time is the cheapest way to keep your program alive past the first quarter.
The KPIs That Prove the Program Works
Track these four metrics from baseline through the first year. Movement in the right direction proves the program is delivering; flat metrics mean the pipeline needs debugging.
Direct measure of harsh-braking reduction. Fleets that coach effectively see 20-40% reduction within 6 months.
Distance driven per tire set. Extends 15-30% as harsh events decline. Second-order benefit that compounds annually.
% of event-triggered PM recommendations that shop accepts and executes. Below 60% = threshold too low. Above 95% = trigger fires too rarely.
Component failures that occurred despite an active PM trigger. Should decline as the model tunes to your fleet's specific patterns.
Frequently Asked Questions
Not for the practical version. The event-to-wear model is well-established: count events per unit per period, weight by G-force, flag units above 150% of baseline for accelerated PM. That's straightforward configuration in a modern maintenance platform, not machine learning. Advanced predictive modeling with per-component fatigue algorithms is a data science project; the 80% version that captures most of the value is not. Start free and run the practical version this week.
The baseline takes 30 days to establish. First predictive triggers fire in month 2. Brake and tire cost improvements typically show measurably by month 3-4 for fleets that actually action the triggers. The delay isn't the model — it's the physical wear cycle. Brake pad life is measured in weeks, not days. Give the program a full quarter before evaluating whether it's working.
Frame it as vehicle-focused first, driver-focused second. The primary output is accelerated PM to keep the truck safe and running, not a scorecard to punish drivers. Data used for coaching should follow a documented process — visible thresholds, consistent application, positive recognition for improvement. Drivers who see the system used fairly stop resisting it fast; the ones who don't were often the ones generating the events.
Yes. Basic telematics from major providers all capture harsh events — the data exists whether you're paying for enterprise analytics or not. The differentiator is whether your maintenance platform can consume it and act on it. Truck Inspection & Maintenance integrates with the common telematics platforms out of the box and turns event data into PM triggers — no enterprise analytics tier required. Ask about supported integrations.
Real issue, real solution. Rough roads absolutely generate accelerometer spikes that read like harsh events. GPS-based filtering compares event location against known road conditions and construction zones; pattern-based filtering flags a driver whose events cluster in the same 200-yard stretch every day as route-driven, not behavior-driven. Both filters are standard features in modern telematics. Enable them; the noise drops significantly and remaining events are actionable.
Turn Your Telematics Data Into a Maintenance Advantage
Truck Inspection & Maintenance is the mobile-first platform that ingests harsh-event data, triggers predictive PM, opens work orders automatically, and keeps DOT records audit-ready — one platform, one dashboard, one record per truck. Stop watching harsh events roll past in a scorecard; start acting on them before the failure.