Most fleet managers can tell you their total annual maintenance spend. Very few can tell you what one truck cost to keep running last quarter, or which five units are quietly dragging the whole fleet's cost per mile above benchmark. That gap is where the money hides: roughly a fifth of the vehicles usually drive most of the overspend, and a fleet-wide average buries them. This guide covers the two numbers that surface them — cost per mile and cost per vehicle — the three cost buckets behind every figure, and the variance reporting that keeps a budget honest. Start free and see cost per mile per vehicle, not just a total.
Fleet Finance · Cost Tracking & Dashboards
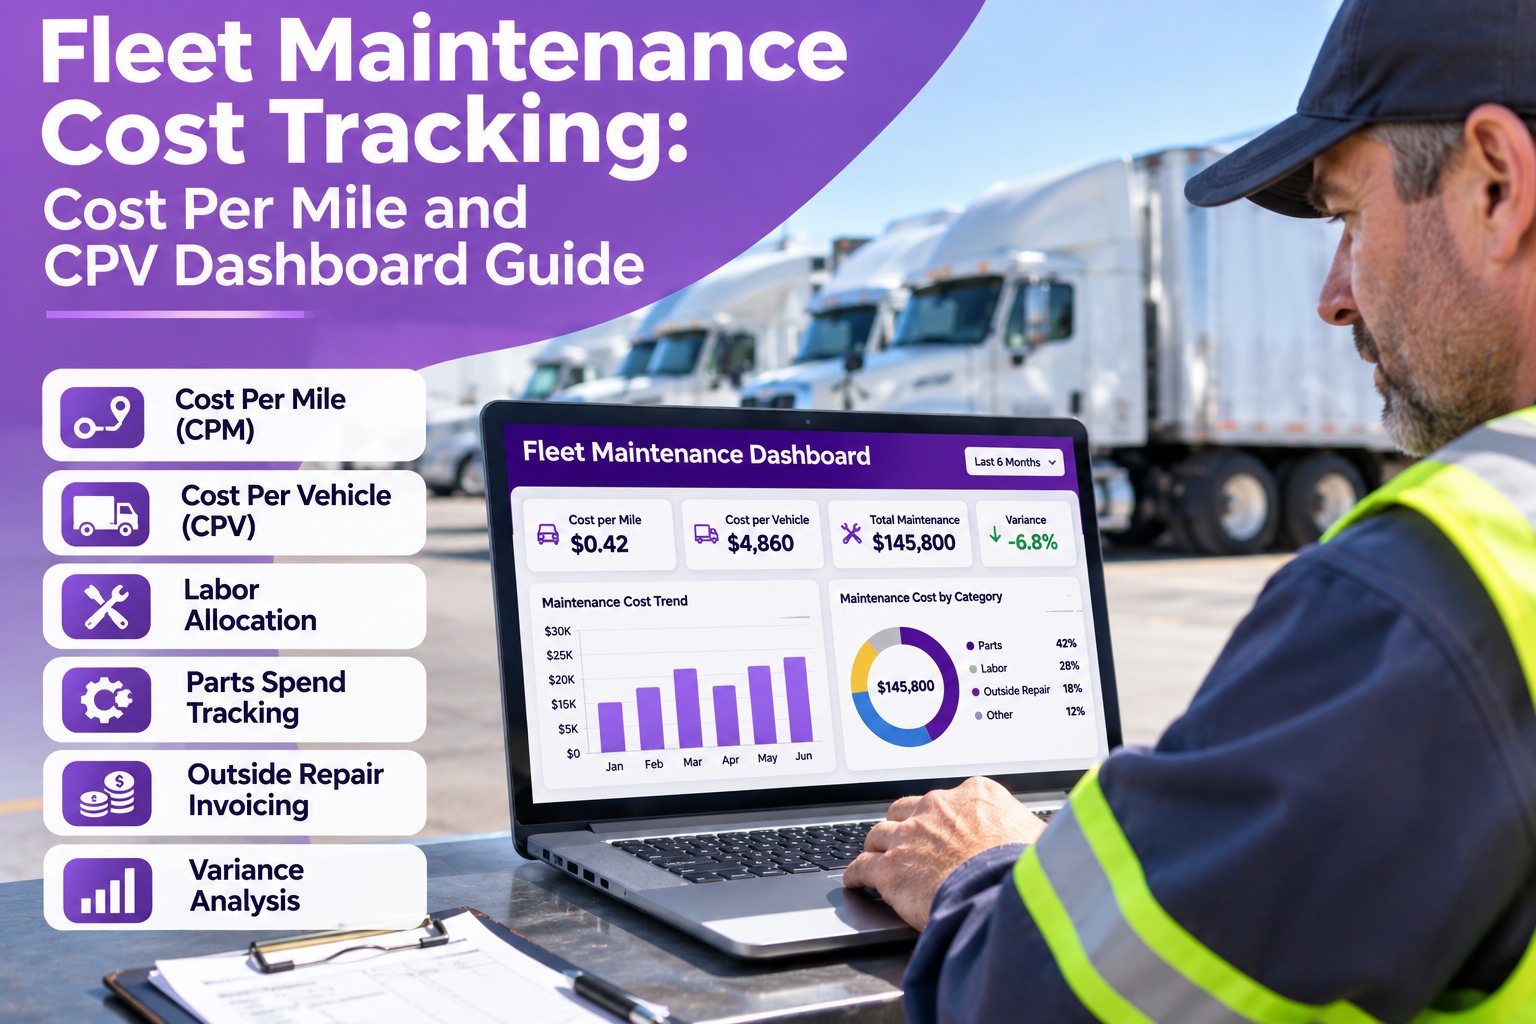
Fleet Maintenance Cost Tracking: Cost Per Mile and CPV Dashboard Guide
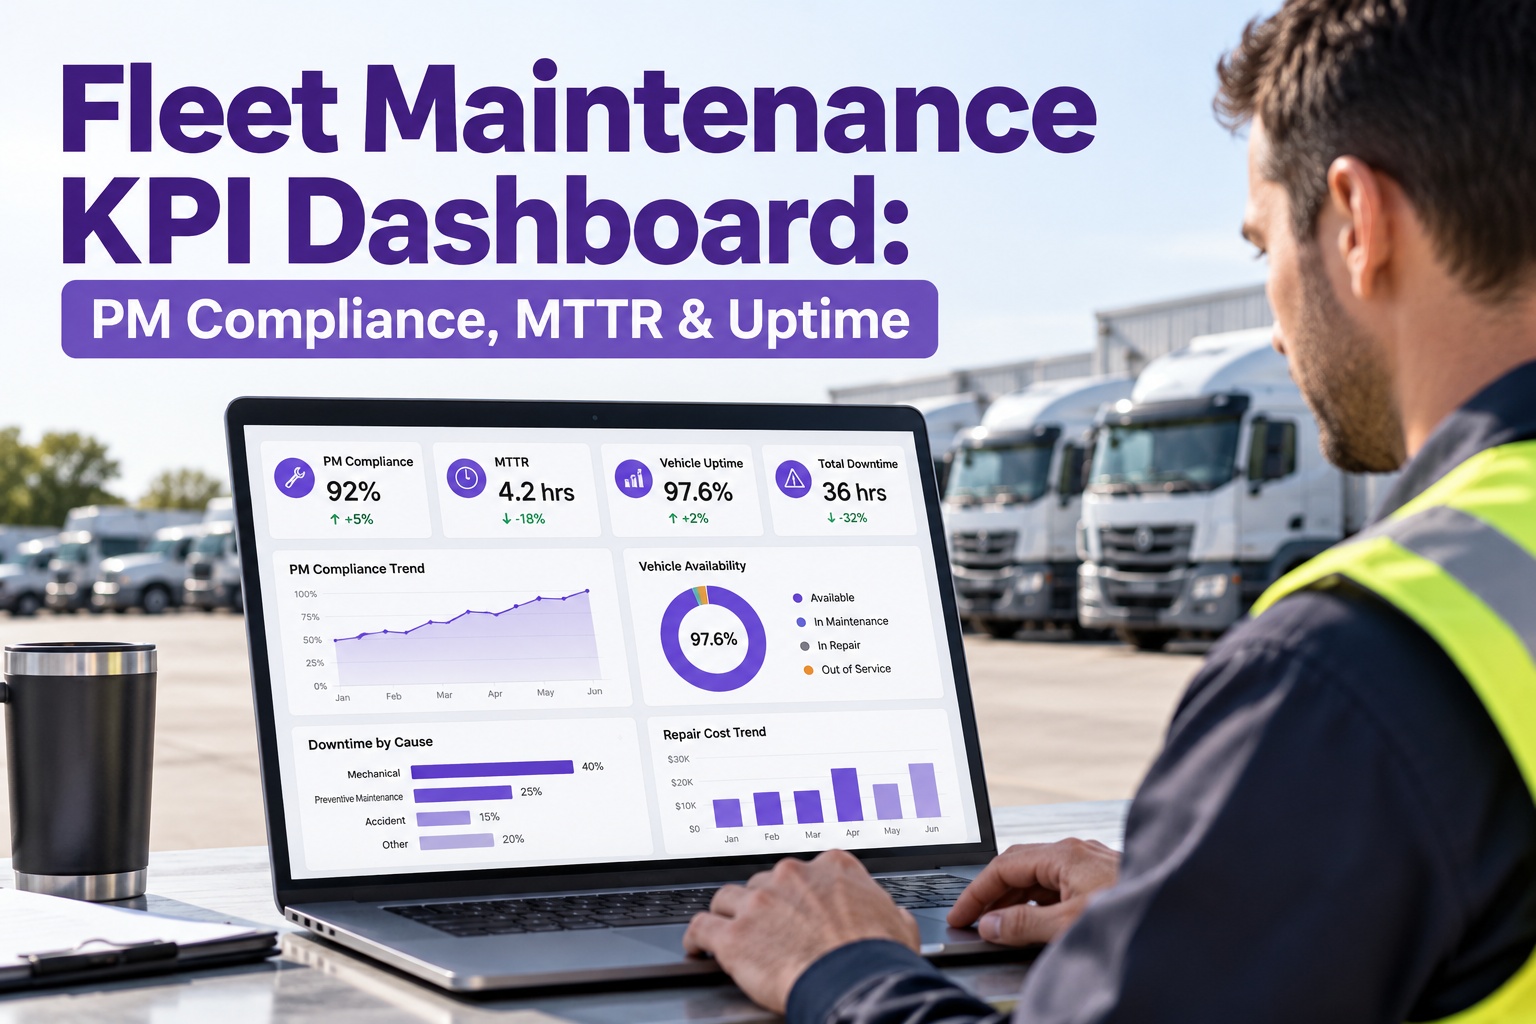
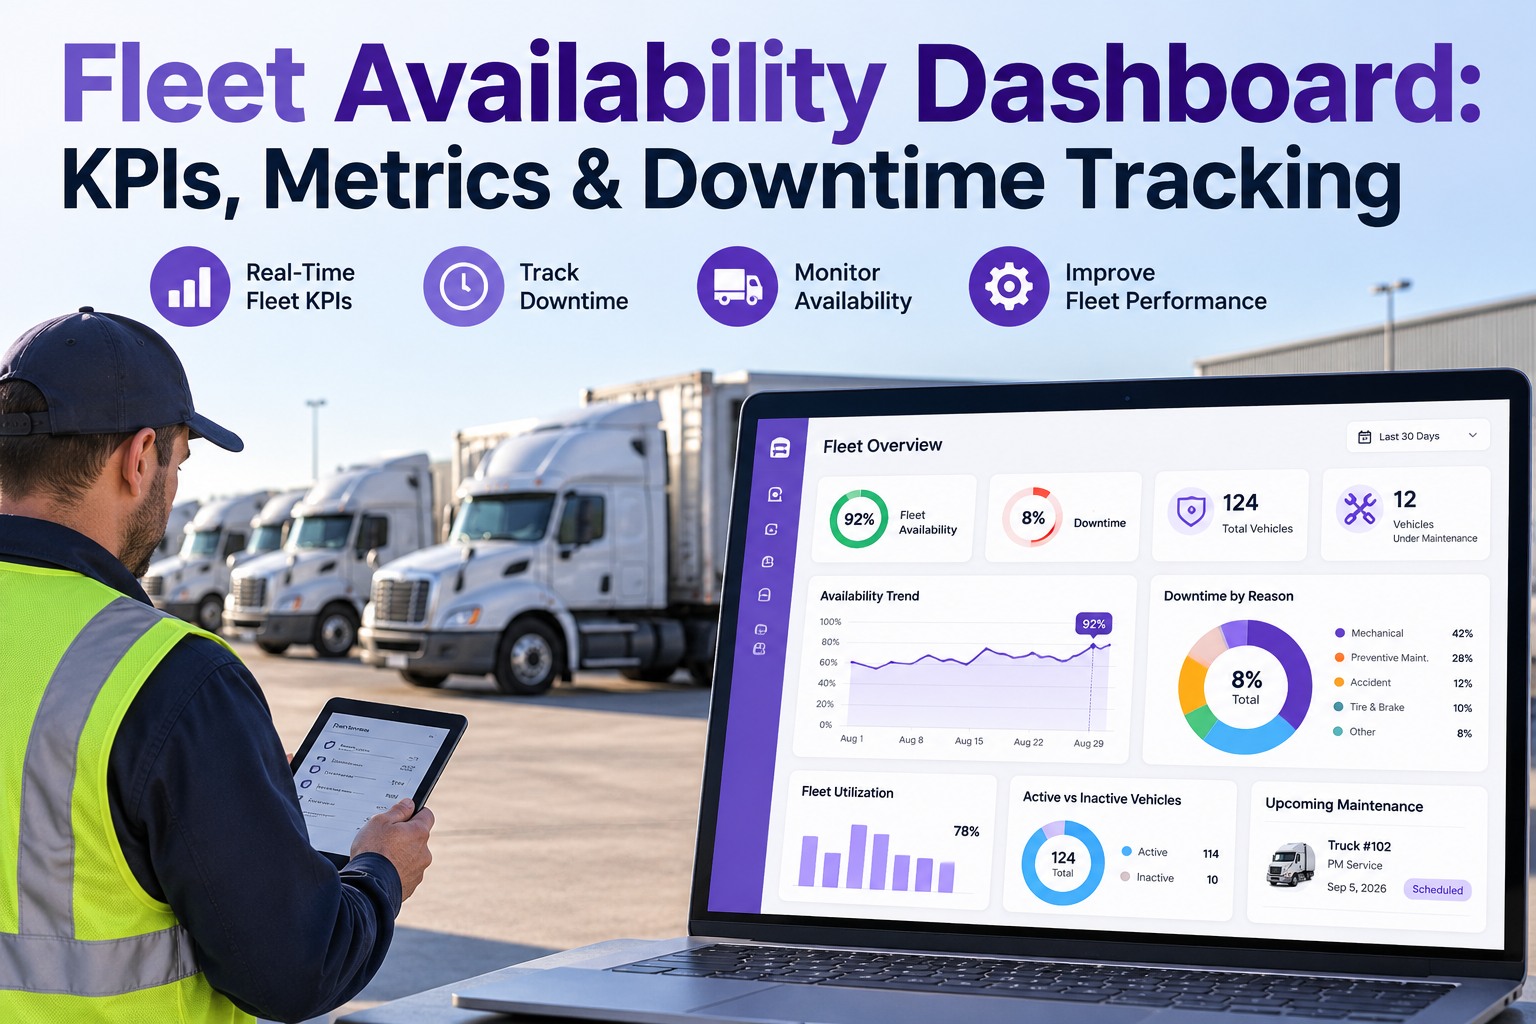
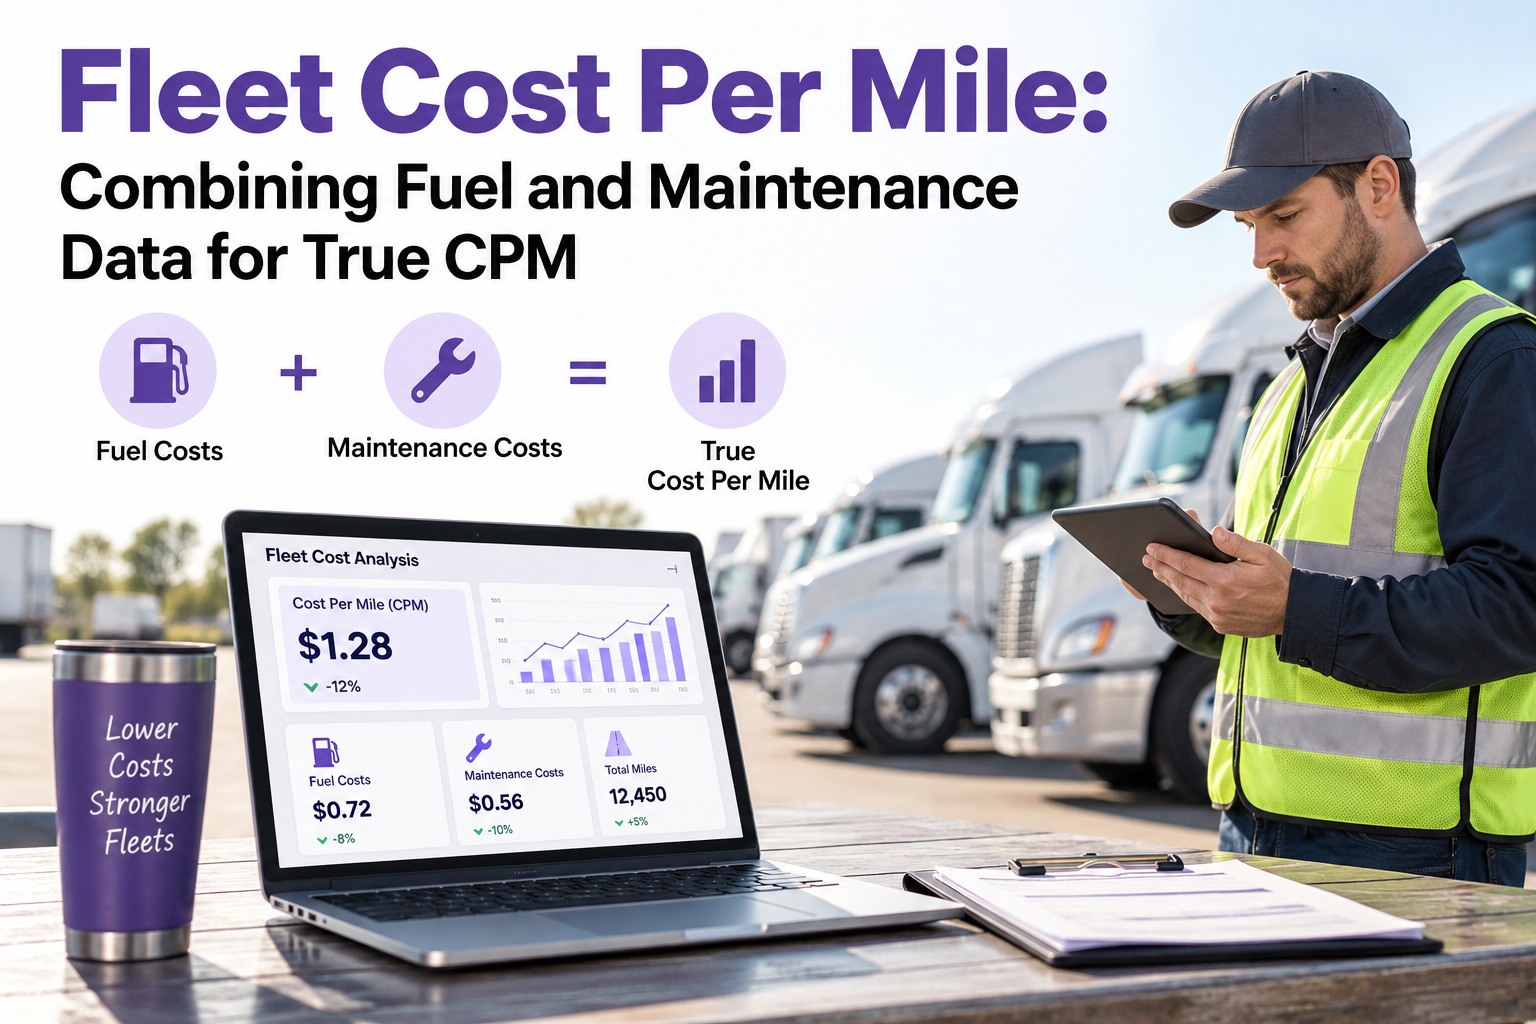
A total spend number tells you nothing about which truck is bleeding money — and by the time the invoice total lands, the trade decision is already late. Truck Inspection & Maintenance Management Software runs the loop that makes cost visible: parts, labor and outside-repair costs post to each work order, mileage syncs from the meter, and the system divides them into a live cost per mile and cost per vehicle — so you see the outlier unit months before it becomes a replacement you didn't plan.
Parts + Labor + Outside
÷
Miles
=
Cost / Mile
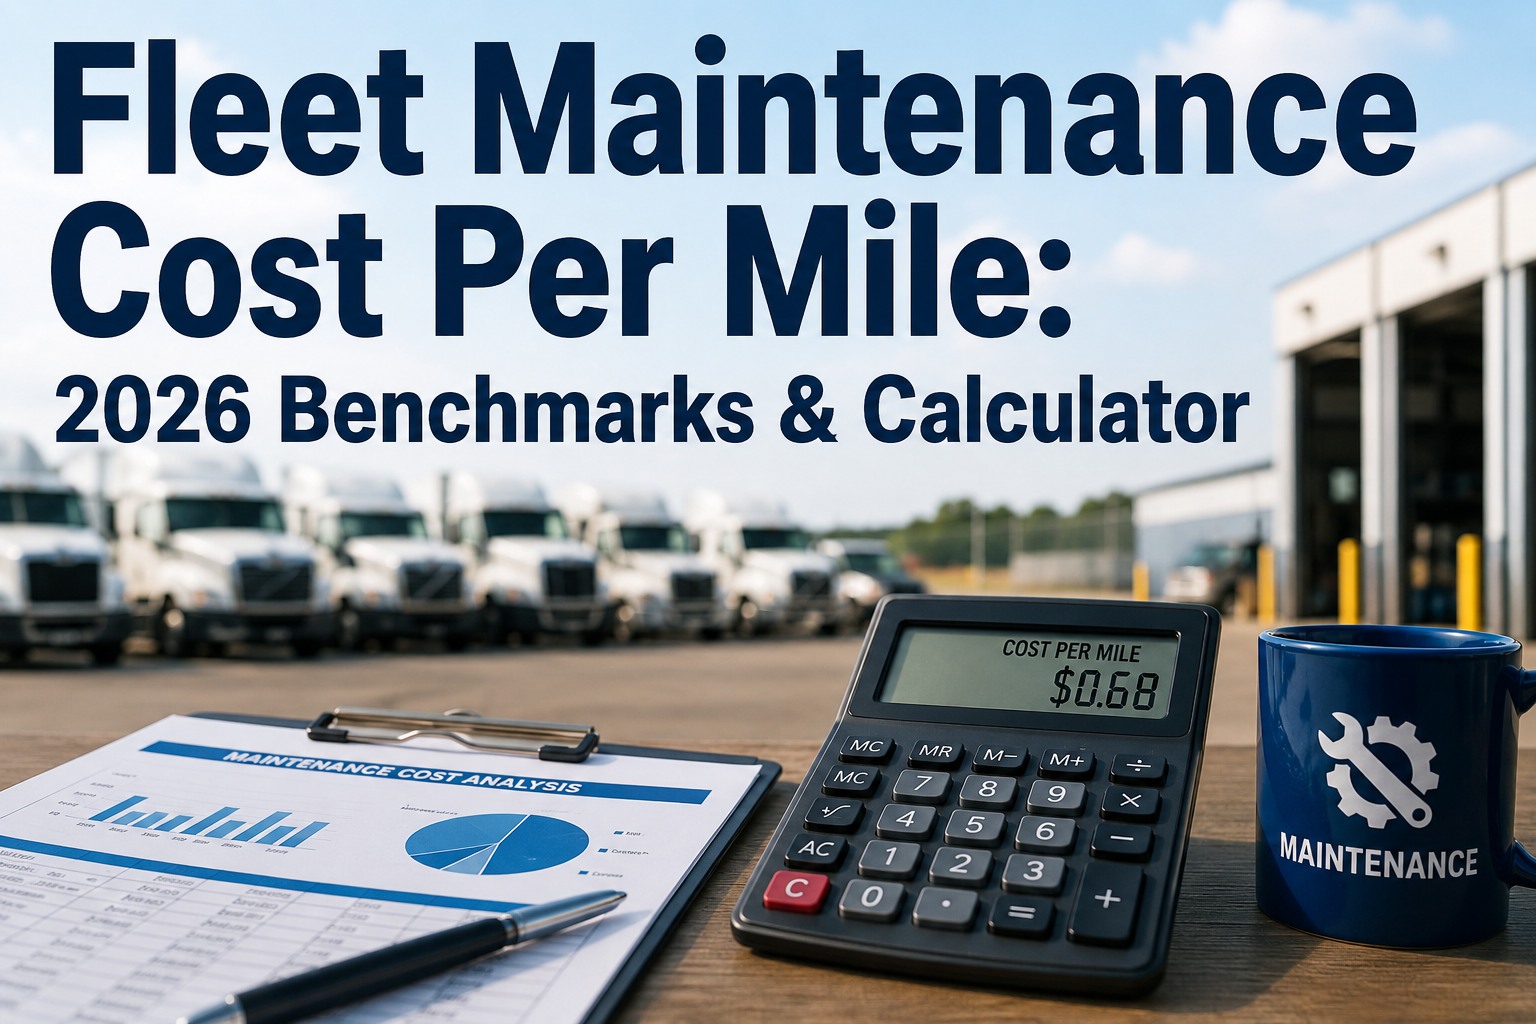
~$0.20/mia common industry maintenance cost-per-mile benchmark
~20 / 80share of vehicles that drive most of the overspend
3–9×cost of an unplanned repair vs a planned one
+35%higher cost per mile once a truck passes ~10 years
The Two Numbers: Cost Per Mile and Cost Per Vehicle
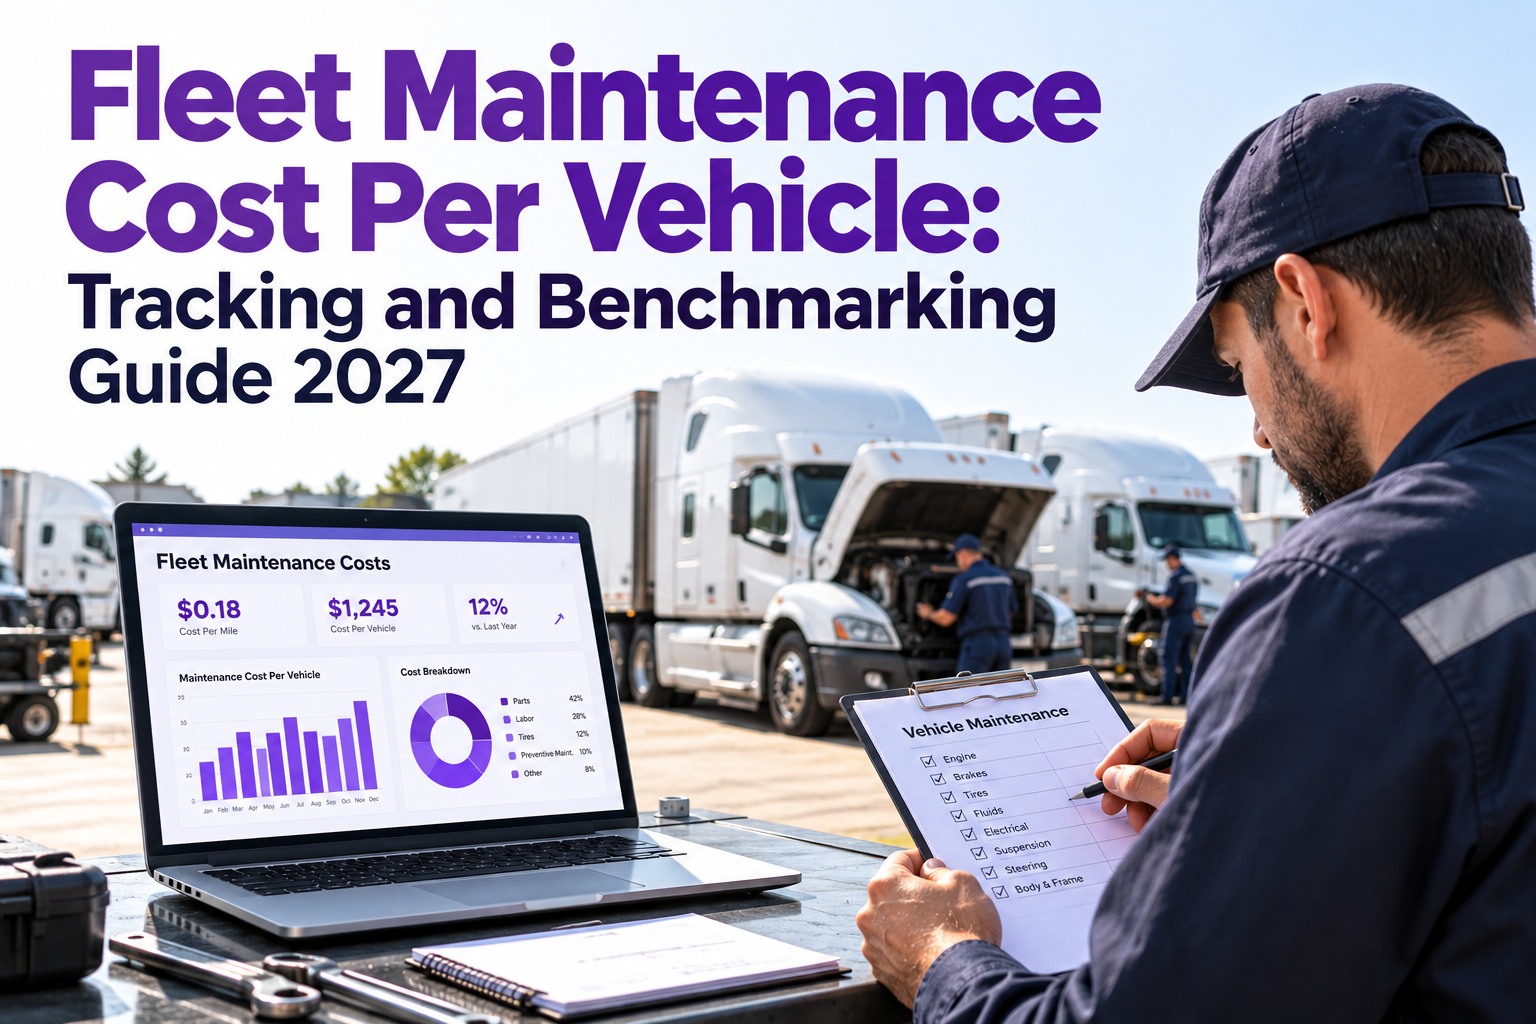
Total spend rises and falls with fleet size and season, so it's useless for comparison. These two normalize it.
Cost Per Mile (CPM)
Total maintenance cost ÷ miles
The executive metric. Track it monthly, fleet-wide and per truck — because the fleet average hides the outliers. One truck at 3× the average is where to look.
Cost Per Vehicle (CPV)
Total maintenance spend per unit
The foundation of repair-cost control. Rising CPV or CPM on one unit is a leading indicator for the repair-versus-replace decision, before it strands you.
For equipment that works more than it drives, swap miles for hours and track cost per hour instead. Book a demo to see CPM and CPV per unit.
Split Every Total Into Three Buckets
One cost number hides the cause. Breaking spend into parts, labor and outside repair tells you whether an outlier is a parts problem, a labor problem, or a vendor problem.
Parts
Every part posted to the work order, not a general account. Watch the same part number recurring on one unit, and track parts as a share of total spend.
Labor
Technician time priced at a real internal rate and tied to the job. This is the fair in-house number you compare against an outside quote.
Outside repair
Vendor and sublet invoices — matched to a work order before payment. Track outside spend as a share of total and the quote-to-invoice variance.
Industry parts-to-labor runs roughly 55:45 — a sharp swing on one unit is a signal worth chasing. Start free and split spend into parts, labor and outside.
The Work Order Is the Ledger
Accurate cost tracking isn't a spreadsheet exercise — it's a discipline at work-order close. Truck Inspection & Maintenance Management Software posts parts, labor and vendor invoices to the work order and the asset, not a general account, captures the meter reading at each service, and divides the result into live CPM and CPV — so the numbers are trustworthy without a single manual re-entry.
Get the Foundation Right, or the Numbers Lie
CPM and CPV are only as good as the data under them. Four habits make them trustworthy.
01Cost posts to the assetParts and labor hit the work order and the vehicle, never a general ledger bucket that loses the trail.
02Meters captured each serviceMileage or hours read at every service — from telematics or manual entry — so the denominator is current.
03Vendor invoices matched firstOutside invoices tied to a work order before they're paid, so no sublet spend floats free of an asset.
04Warranty status recordedWarranty and expiry on the asset, so a covered repair doesn't quietly inflate a vehicle's cost.
Variance Analysis: Budget vs. Actual
Tracking cost is half the job; catching where it drifts from plan is the other half. A variance dashboard shows budgeted against actual, by category, and flags the overruns early.
Unplanned emergency repairs
→The largest single source of overruns — the case for shifting spend to planned PM
Parts price inflation
→Watch for price creep — gradual vendor increases past agreed rates
Labor overtime
→Overtime hours inflating the labor bucket beyond the planned rate
Scope creep on repairs
→Final invoice exceeding the approved quote — the quote-to-invoice variance to control
Set an alert threshold — many fleets aim to stay within about 5% of budget — so an overrun surfaces mid-month, not at year-end. Book a demo to see budget-variance alerts.
Benchmarks vary by fleet type, vehicle class, route and region — a lean service fleet and a heavy Class 8 operation sit at very different cost-per-mile numbers. Use the figures here as directional and benchmark against fleets like your own.
Frequently Asked Questions
1What's a good maintenance cost per mile?
It depends on the fleet, but a common industry maintenance cost-per-mile figure sits around $0.20, with well-maintained heavy trucks often lower and aging units higher — a vehicle past about ten years can cost roughly 35% more per mile. The number matters less than the trend and the spread: track it monthly per truck, and chase any unit running well above your own fleet average rather than the industry one.
Book a demo to benchmark CPM per truck.
2Why track cost per mile instead of total spend?
Because total spend moves with fleet size, utilization and season, so it can't tell you whether you're getting more or less efficient. Cost per mile normalizes all of that into one comparable number you can hold against a benchmark, a vehicle class, or last quarter. Most importantly, per-truck CPM surfaces the outliers a fleet-wide total completely hides.
Book a demo to move from total spend to CPM.
3What should a maintenance cost dashboard show?
At minimum: cost per mile and cost per vehicle by class, the parts-labor-outside-repair split, planned-versus-unplanned spend, and budget versus actual with category-level variance. The split is what makes an outlier actionable — it tells you whether a high-cost unit is a parts, labor or vendor problem — and the variance view catches overruns while there's still time to act.
Book a demo to see the full cost dashboard.
4How do I make sure the cost numbers are accurate?
Post every cost to the work order and the asset rather than a general account, capture the meter reading at each service, match every outside vendor invoice to a work order before paying it, and record warranty status so covered repairs don't distort a vehicle's cost. Get those four habits right and CPM and CPV calculate themselves accurately; skip them and the dashboard is just confident-looking noise.
Book a demo to set the cost foundation up right.
Per mile · Per vehicle · Split & benchmarked · On record
See Every Maintenance Dollar — Per Truck, Per Mile
Truck Inspection & Maintenance Management Software posts parts, labor and outside repair to each work order, syncs the meter, and turns it into live cost per mile and cost per vehicle with budget-variance alerts — so you manage the outliers instead of discovering them on next year's budget.
No credit card required. Free for up to 3 trucks. Built to turn work orders into cost intelligence.