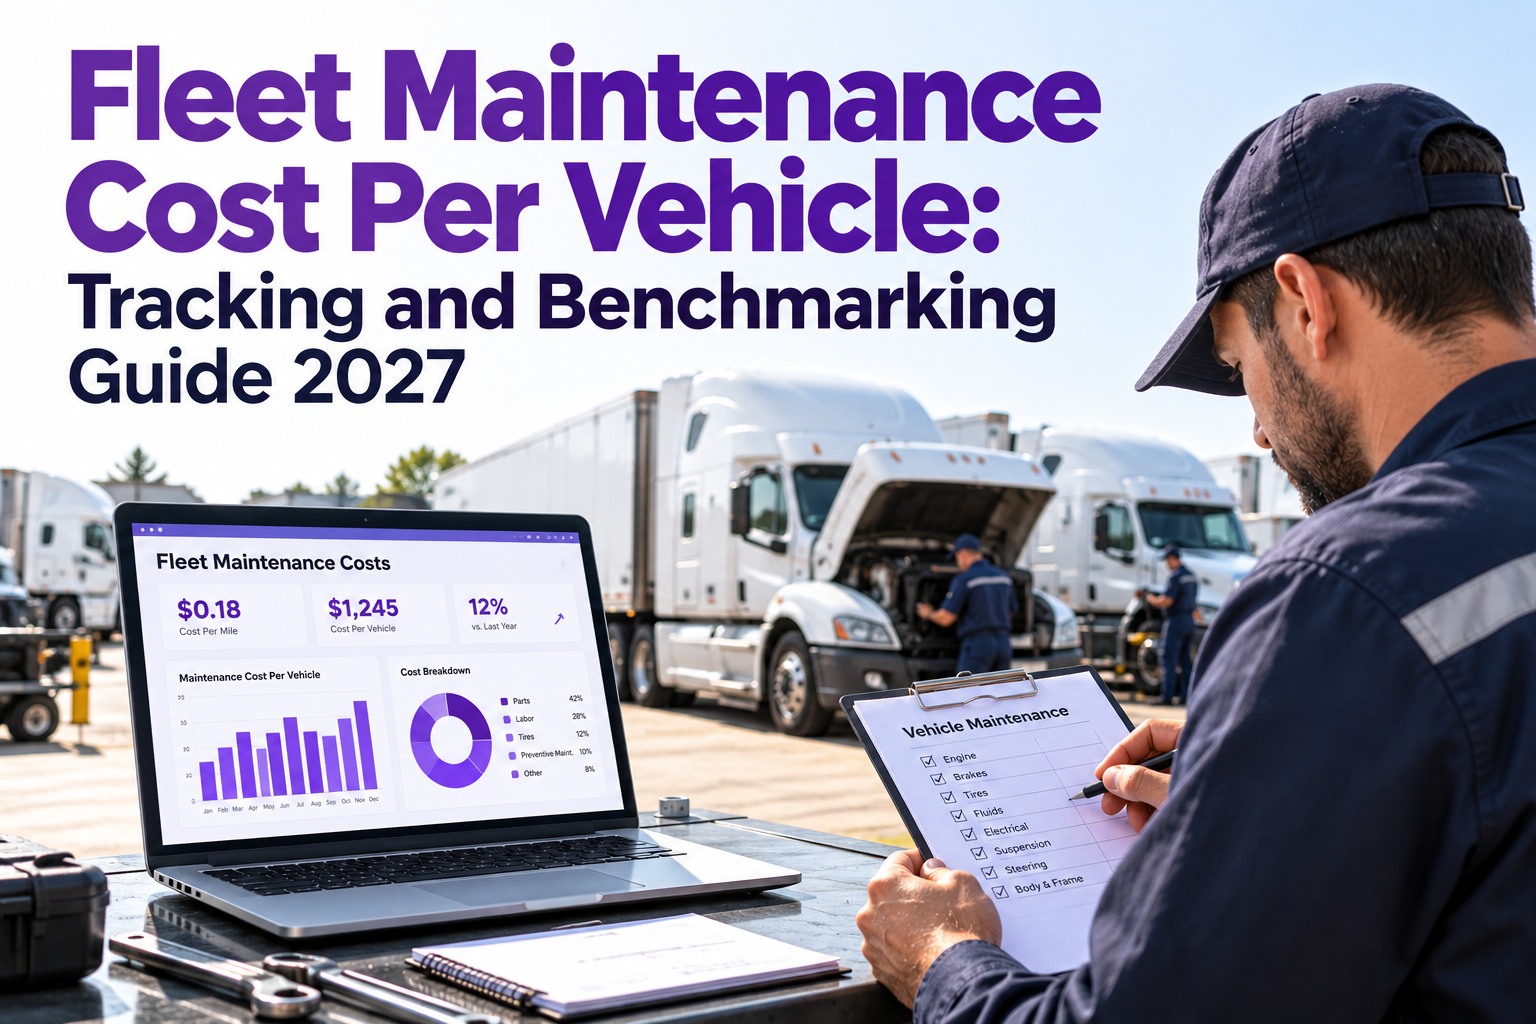
Ask a fleet manager what they spent on maintenance last year and you'll usually get one big number from accounting. Ask what each truck cost, and why Unit 133 costs nearly twice as much per mile as Unit 120, and the answer takes a week to build from invoices. That gap is where budget money disappears. This guide shows how to calculate maintenance cost per vehicle and per mile, which costs to include, how to read the latest ATRI benchmarks without misusing them, and how to find the units quietly costing you the most heading into 2027. It also shows how Truck Inspection & Maintenance Management Software turns inspections, defects and work orders into a cost record for every unit. Start free and see what each unit really costs to run.
Fleet Maintenance Cost Per Vehicle: Tracking and Benchmarking Guide 2027
Fleet-wide totals hide the outliers: the aging tractor eating parts, the unit with repeat repairs, the shop invoice nobody tied to a truck. TIM links every inspection defect to a work order, rolls parts and labor into that unit's record, and keeps PM on schedule, so cost per vehicle is something you read, not something you reconstruct.
Three Formulas, Three Different Questions
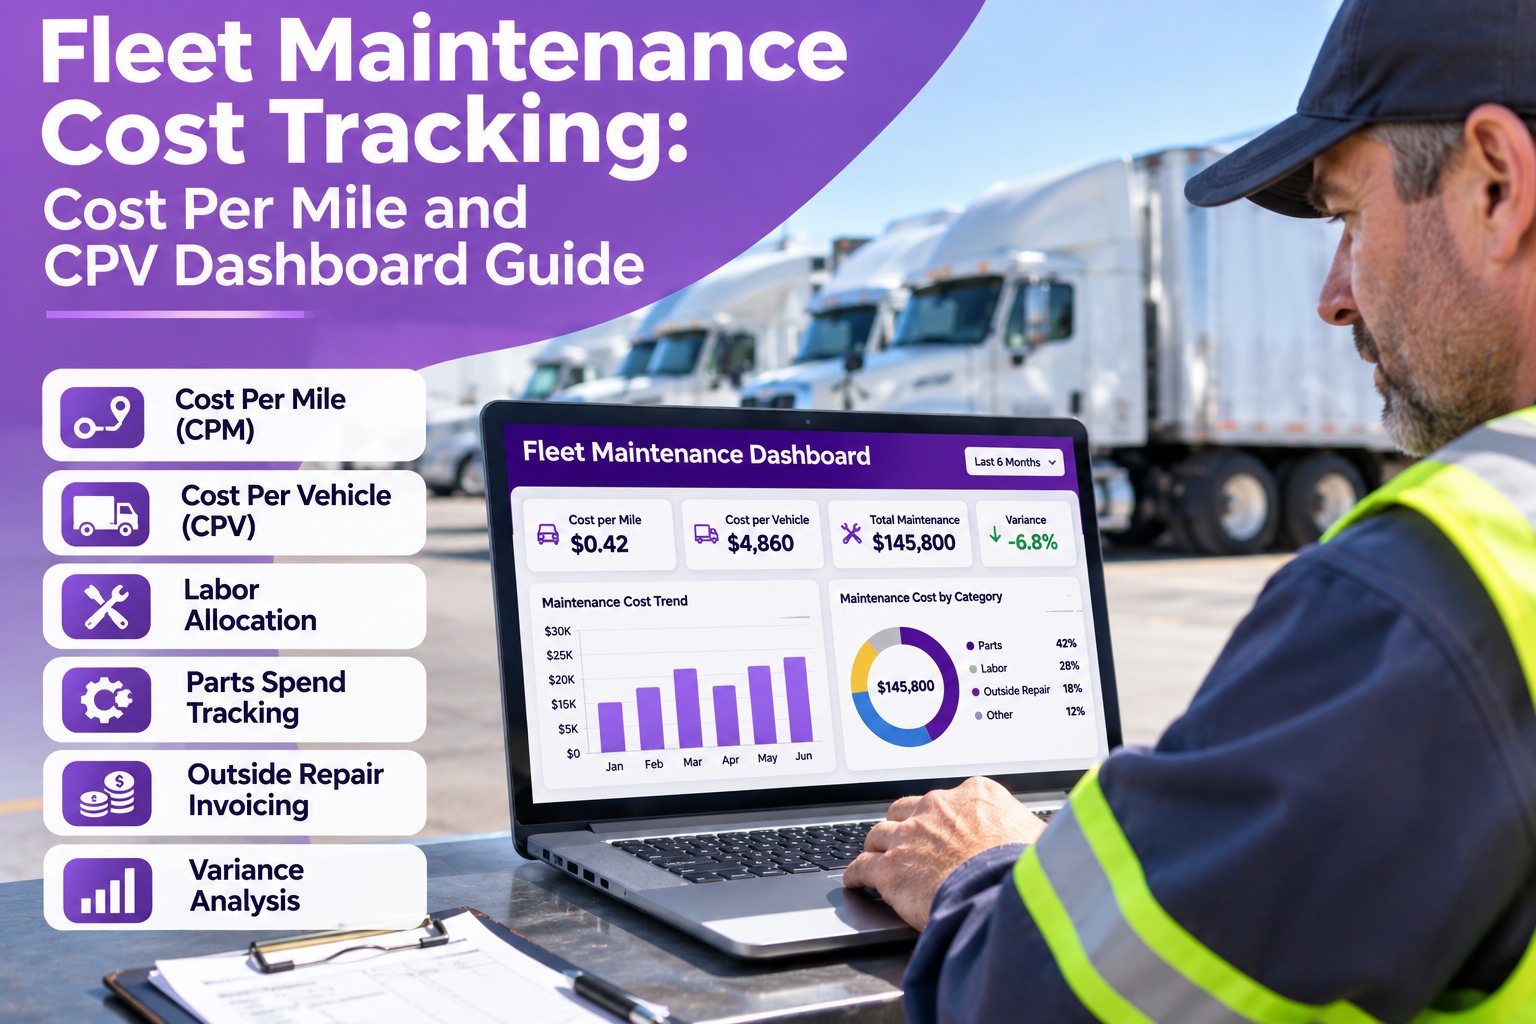
Cost per vehicle shows who's expensive. Cost per mile shows who's expensive for the work they do. Cost per month or hour is for units with low or irregular mileage. Track at least the first two.
What Counts: The Anatomy of a Maintenance Dollar
Benchmarks only help if you count the same things. ATRI's repair and maintenance figure covers parts, labor and roadside service, and surveys tires separately. Here's a hypothetical 25-truck fleet driving 2,000,000 miles a year, so you can see how the pieces stack up.
Hypothetical numbers for illustration. Decide once what's in your cost per mile (tires? shop overhead? trailers?) and keep it the same every month.
Benchmarks: Where the Industry Stands
ATRI's latest operational cost analysis puts industry-average repair and maintenance at 21.5 cents per mile in 2025, up 8.6% from 19.8 cents in 2024. ATRI attributes part of the rise to aging trucks and expects costs to keep climbing, and preliminary 2026 data points to a further increase of about 2.4%.
Industry-average repair and maintenance cost per mile (excludes tires). Source: ATRI Analysis of the Operational Costs of Trucking. Regional averages ran from about 19¢ in the South-Central U.S. to about 22¢ in the Northeast.
Why Your Number Won't Match the Average
From Walkaround to Cost Per Unit: The Tracking Loop
The number is only as good as the data entering it. The cleanest way to get accurate cost per vehicle is to capture cost where the work happens, not at month-end from a pile of invoices.
Find the Outliers: A Sample Unit Ranking
Once costs sit on each unit, a simple ranking exposes the trucks worth a second look. Here's a hypothetical year-to-date view against a fleet median of about 20¢ per mile.
| Unit | Model year | Miles YTD | R&M spend | Cost / mile | Flag |
|---|---|---|---|---|---|
| Unit 101 | 2022 | 80,000 | $13,600 | $0.17 | On track |
| Unit 120 | 2021 | 85,000 | $17,000 | $0.20 | On track |
| Unit 114 | 2018 | 70,000 | $21,700 | $0.31 | Investigate repeats |
| Unit 133 | 2016 | 55,000 | $20,900 | $0.38 | Repair vs replace |
Build Your 2027 Maintenance Budget in Four Lines
Example (hypothetical): 2,000,000 miles × $0.20 = $400,000; with a 5% buffer you choose, $420,000 before tires and one-off events.
One Record Per Unit, Costs Included
Truck Inspection & Maintenance Management Software connects inspections, DVIRs, defects, work orders and PM on each unit's record, with parts and labor recorded on the work order. When budget season arrives, you rank units by cost instead of rebuilding the year from paperwork.
Frequently Asked Questions
Walk Into 2027 Budget Season Knowing What Every Truck Costs
Start free to put parts, labor and PM history on each unit's record, or book a demo and we'll walk through a cost-per-vehicle view with your fleet in mind.