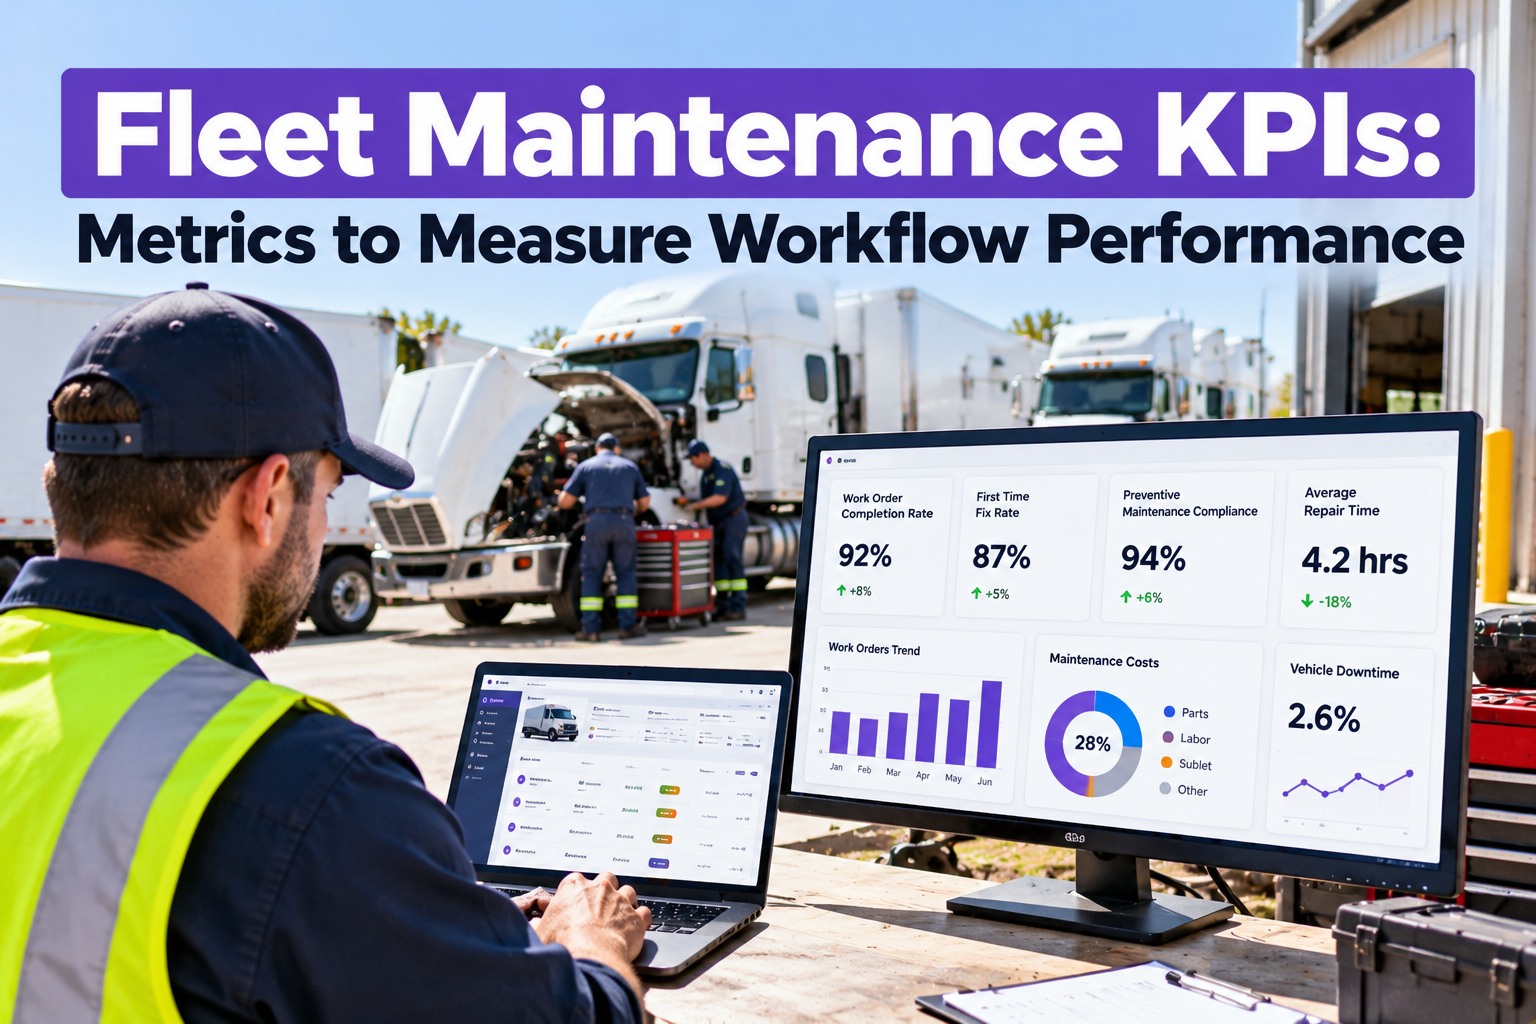
Your fleet throws off numbers all day — work orders, repair hours, overdue PMs, trucks in the shop — but a pile of numbers isn't a dashboard. A dashboard is five or six metrics that tell you, at a glance, whether the fleet is getting healthier or quietly sliding toward the next breakdown — and which numbers lead versus which just report the damage once it's done. Start free and build your first KPI dashboard from the work orders you already write.
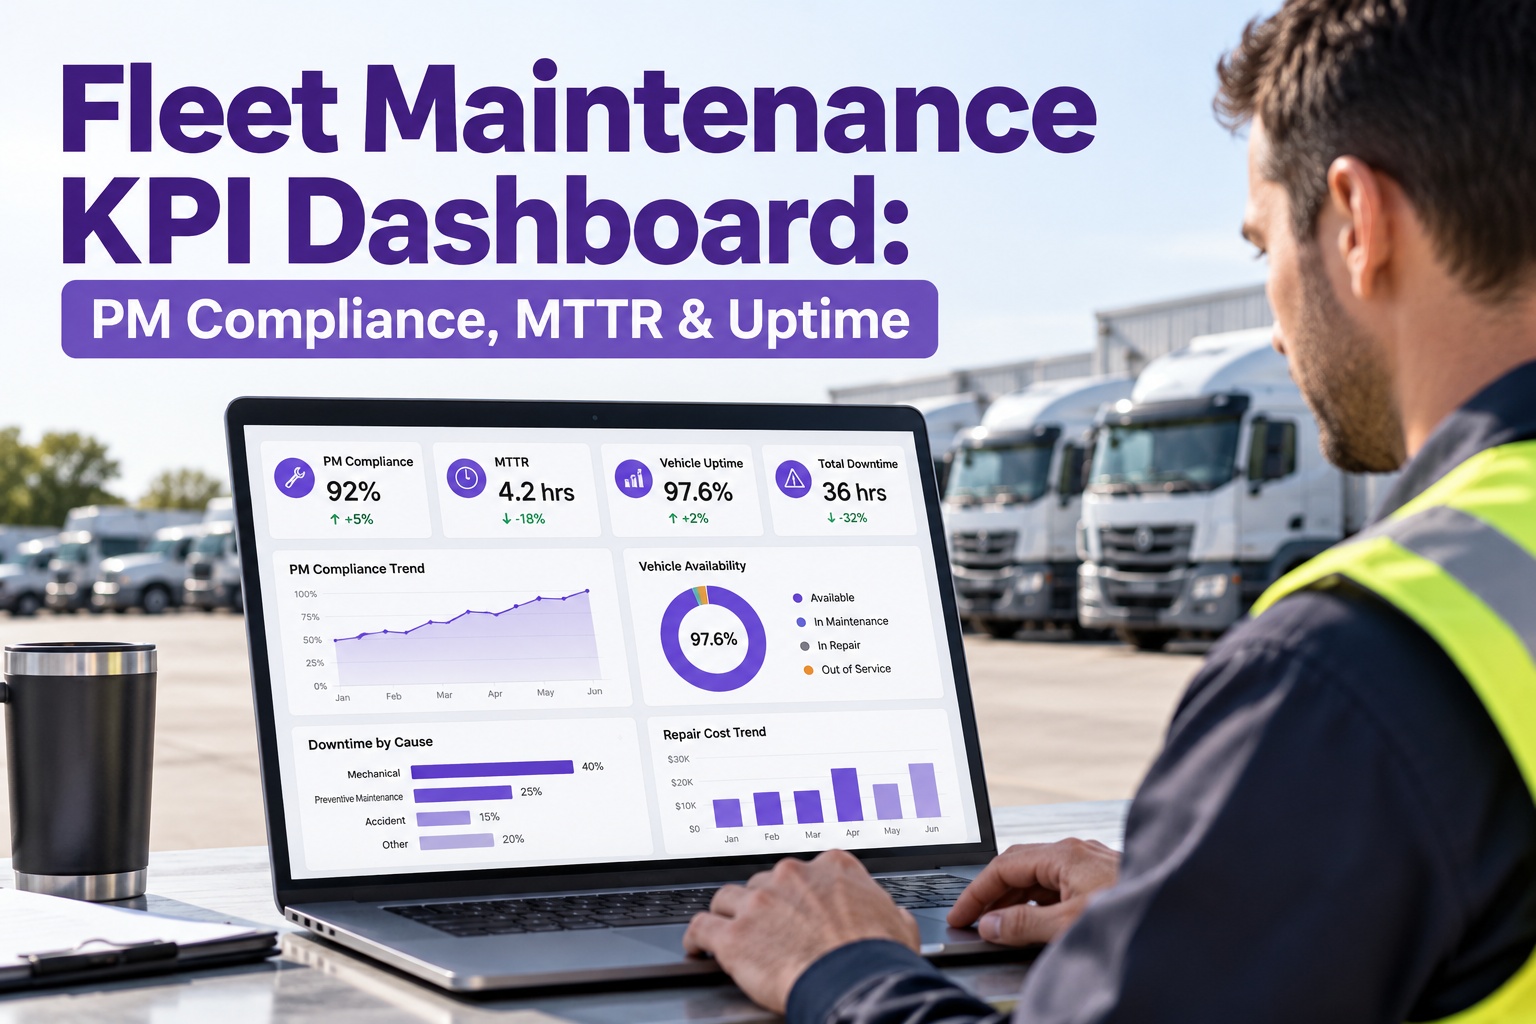
Fleet Maintenance KPI Dashboard: PM Compliance, MTTR & Uptime
Breakdowns that blindside you, overdue PMs, a month-end spreadsheet that's already stale — and no clear read on whether the fleet is improving. You want one screen that shows where every truck stands, right now. Truck Inspection & Maintenance Management Software runs the loop that gets you there: inspections and DVIRs flow in, defects become graded work orders, PMs fire before they're due, and every closed work order rolls into PM compliance, MTTR, MTBF, availability, and cost per mile — live, per truck, and benchmarked against the industry band.
What a KPI Dashboard Actually Is — and Isn't
A report is a wall of history. A dashboard is a decision tool: a short set of metrics, each with a benchmark and a direction, so you can tell in ten seconds whether to act. Most fleets track too many numbers and trust none of them. The fix is six KPIs that cover the four things that matter — readiness, reliability, efficiency, and cost — and reading them against known industry benchmarks instead of against last month.
The Benchmark Scorecard — Where Does Your Fleet Sit?
These are the five numbers every fleet dashboard should carry, with the 2026 industry benchmark bands drawn from SMRP/AEMP reliability frameworks and current fleet KPI research. Read each one against the band, not against a gut feeling — the gap between a mid-pack fleet and a top-quartile one is money you're already spending.
The Five Formulas — Each KPI on One Card
Every number on the dashboard comes from one simple formula, and each exposes a different failure. You don't need a data team — you need the raw inputs captured once, cleanly, on every work order.
The north-star metric. It's the one you can act on before a failure. When it slips, every downstream number follows within 60–90 days.
Mean Time to Repair — shop speed. A high MTTR points at parts availability, diagnostic gaps, or a tech backlog, not bad luck.
Mean Time Between Failures — reliability. Rising MTBF means your PM program is working; a decline is an early reliability warning.
The headline uptime number — and the honest one, because it combines how often trucks fail with how long they sit. Good MTBF with slow repairs still gives poor availability.
Where reliability meets the budget. It's the sum of everything upstream — when PM compliance drops and MTTR climbs, cost per mile is where you feel it.
An MTBF of 500 operating hours with a 5-hour MTTR gives 99% availability. Push MTTR to 15 hours and the same reliability drops you to ~97% — the repair clock, not the failure rate, moved it.
Leading vs Lagging — Why the Order Matters
Here's the mistake that keeps fleets stuck: reviewing only the lagging numbers — downtime and cost — once a month. Those tell you what already went wrong. The fleets that pull ahead watch the leading indicators weekly, because those move first and predict the rest. This is the chain, and it only runs one direction.
Parts availability is the other leading indicator — it moves before MTTR and work-order cycle time. A rising reactive-to-planned ratio is the earliest warning of all: when unplanned work creeps past 20–25% of the total, expect PM compliance to be slipping and cost per mile to worsen inside a quarter.
The Software That Builds This Dashboard For You
Building this dashboard by hand is where most fleets give up — and that's the gap Truck Inspection & Maintenance Management Software closes. Every inspection, defect, and repair becomes a live data point, and the platform does the maths for you: PM compliance, MTTR, MTBF, availability, and cost per mile, per truck and fleet-wide, with no exports or manual tallies. Set a threshold once and it flags the truck the moment a number slips into the red — so your job is acting on the signal, not hunting for it.
What the Gap Is Actually Costing You
The distance between a mid-pack fleet and a top-quartile one isn't abstract — it's a line in your budget. A single truck sitting idle runs a real daily bill, and the fleets that don't track it underestimate the total by a third to a half.
Run the arithmetic: a 50-truck fleet at 8% downtime and $760 a day loses roughly $760,000 a year to unplanned events alone. Lift PM compliance from the 60s into the 90s and you move every number in the chain — which is why the dashboard pays for itself long before the quarter's out. Start free and put a dollar figure on your own downtime.
How the Software Turns Your Daily Logs Into Live KPIs
Truck Inspection & Maintenance Management Software doesn't just file your records away — it runs the whole loop that feeds every KPI and puts the finished dashboard in front of you. Here's how your everyday inspections and work orders become the six numbers that run the shop.
Frequently Asked Questions
Turn Your Work Orders Into a Dashboard That Runs Ahead of Breakdowns
Truck Inspection & Maintenance Management Software is the one tool that does all of this for you — it calculates PM compliance, MTTR, MTBF, availability, and cost per mile straight from the inspections and repairs you already log, benchmarks each against the industry band, flags the trucks drifting into the red, and turns every red metric into a work order. Give it your daily logs and it hands you back a dashboard. Manage the signal, not the spreadsheet.