The average refuse fleet runs 71% PM compliance. Top-quartile fleets hit 94%+. That 23-point gap is not talent, not equipment, not fleet age — it's data discipline plus the right toolset. Fleets at 71% average 2.8 unplanned breakdowns per truck per year; fleets at 94% average 0.4. A 7x differential from a single metric. On a refuse fleet where each mid-route hydraulic failure costs $8,000+ in tow, cleanup, missed route, and customer credits, that compliance gap translates to $2,800-$4,400 per vehicle per year in preventable spend. This article compiles the current 2026 benchmark data across 850+ refuse fleets — PM compliance percentiles by fleet size, body type, and management method, plus the downstream metrics compliance drives. If you don't know where your fleet sits against the industry percentile, you can't tell the difference between "we're doing fine" and "we're leaving six figures on the table." Sign up free for Truck Inspection & Maintenance today — no credit card required to instrument your fleet's PM compliance against these benchmarks, or contact our team for a benchmark diagnostic configured to your fleet size and body type mix.
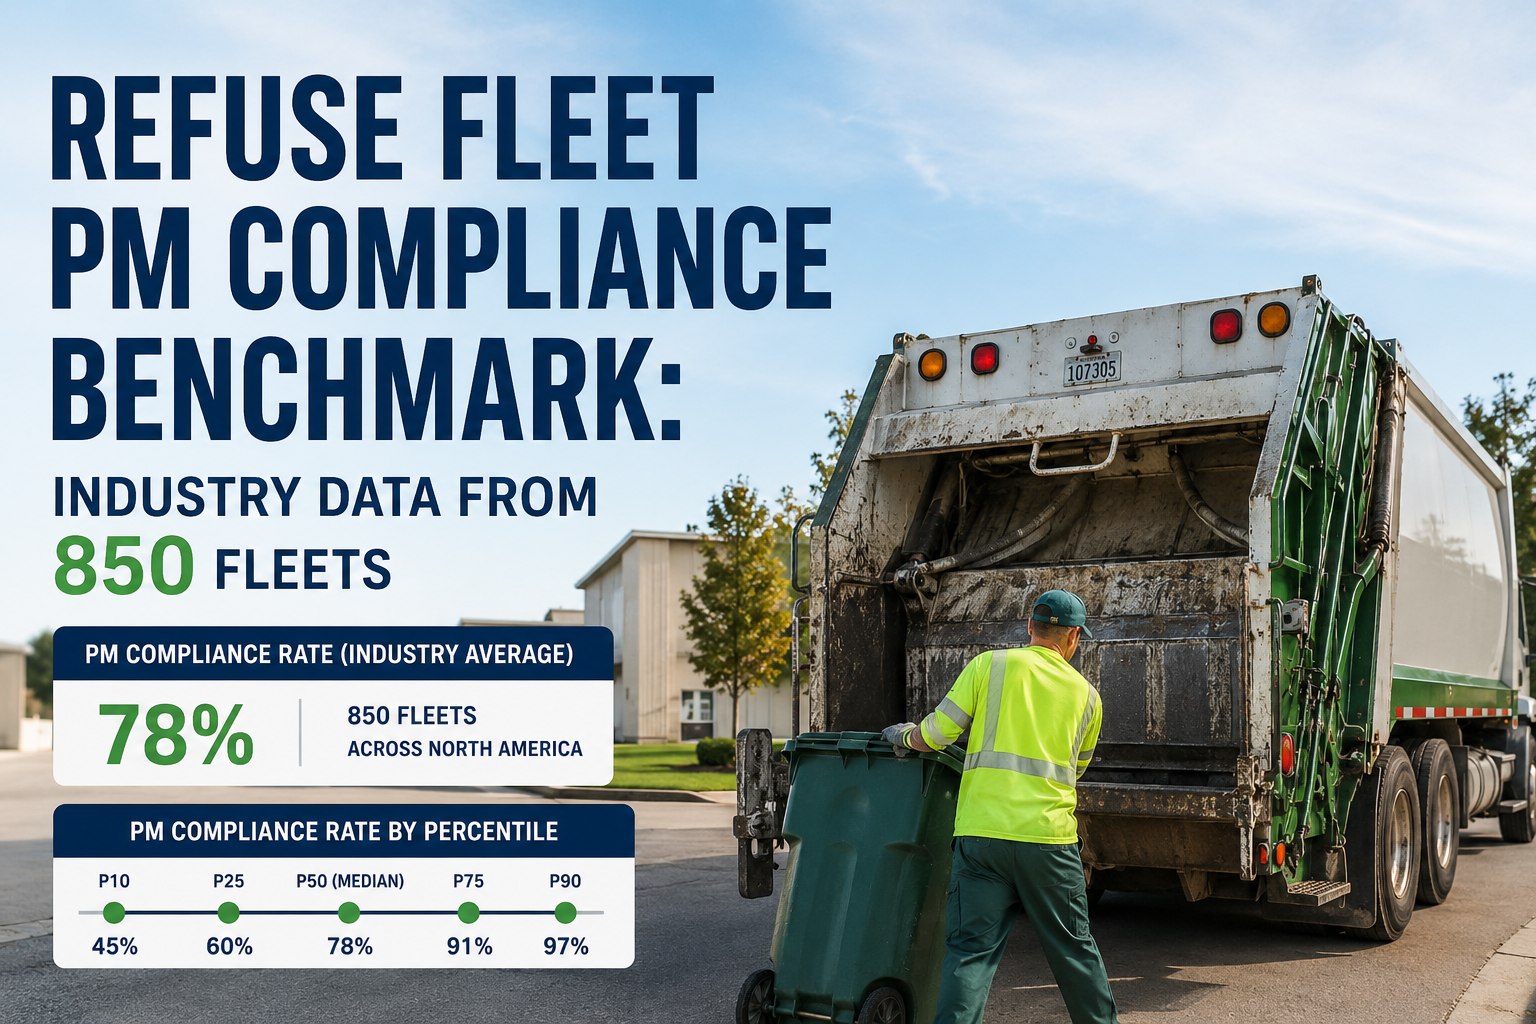
Refuse Fleet PM Compliance Benchmark: Industry Data From 850 Fleets
Industry average PM compliance sits at 71%. Top-quartile fleets hit 94%+. The 23-point gap is worth $2,800-$4,400 per vehicle per year in preventable cost.
The 5-Tier Performance Distribution
Refuse fleet PM compliance distributes across five tiers. Every tier below World-Class carries compounding cost — knowing your tier tells you exactly what a 10-point improvement is worth in dollars.
PM Compliance Distribution — Where Fleets Actually Sit
The 850-fleet dataset shows the actual distribution of refuse fleet PM compliance across the industry. Most fleets cluster in the 65-85% range — a wide middle where the improvement leverage is highest.
PM Compliance by Fleet Size
Compliance patterns vary significantly by fleet size. Small fleets and very large fleets tend to outperform mid-size operations — for different reasons.
| Fleet Size | Median PM Compliance | Top Quartile | Why the Pattern |
|---|---|---|---|
| 1-15 trucks | 82% | 96% | Owner-operator visibility — one person knows every truck |
| 16-50 trucks | 74% | 92% | Growing pains — informal systems outgrown, not yet formalized |
| 51-150 trucks | 71% | 91% | The trough — most under-invested in maintenance software here |
| 151-500 trucks | 79% | 94% | CMMS adoption inflection — structured programs take hold |
| 500+ trucks | 86% | 96% | Enterprise systems, dedicated maintenance leadership |
PM Compliance by Refuse Body Type
Different refuse body types have different PM workloads driven by cycle counts and duty cycles. The compliance benchmarks reflect that reality.
PM Compliance by Management Method
The single strongest predictor of PM compliance rate is the method the fleet uses to track it. The data is stark.
Downstream Metrics — What PM Compliance Actually Drives
PM compliance is a leading indicator. Every downstream metric moves with it, in predictable ratios. Here's what a 20-point compliance improvement typically produces across a 50-vehicle refuse fleet.
Benchmark your fleet against 850+ refuse operations — automatically
PM compliance rate calculated per truck, per body type, per route. Real-time benchmark position against industry percentile. Downstream metrics — breakdown rate, uptime, OOS, CPM — tracked continuously. Know your tier before the next quarter's costs land.
How to Move from Industry Average to Top Quartile
The path from 71% to 94% PM compliance is not mysterious. Fleets that make the jump follow the same 5-step pattern in the same order.
Frequently Asked Questions
71% across the 850+ fleet dataset. The distribution is wide: bottom quartile below 65%, top quartile 92%+, world-class (top 10%) at 95-100%. Most fleets cluster in the 65-85% range — a wide middle where improvement leverage is highest. The gap between industry average (71%) and top quartile (94%) is worth $2,800-$4,400 per vehicle per year in preventable maintenance and downtime cost. For context, the general commercial fleet industry average is ~84%, meaning refuse trucks lag by roughly 13 points — driven by higher cycle counts, hydraulic-intensive duty, and specialized PM structures refuse fleets require but often don't formalize.
Because this size range is stuck between informal and enterprise systems. Small fleets (1-15) hit 82% median through owner-operator visibility — one person knows every truck. Enterprise fleets (500+) hit 86% through dedicated maintenance leadership and enterprise CMMS. The 51-150 range is the trough because these fleets outgrew paper and spreadsheets but haven't yet invested in purpose-built fleet software. This is the largest single opportunity band in the industry: structured CMMS deployment in this range typically moves compliance from 71% to 90%+ within 12 months — the highest-ROI transition in refuse fleet management.
Roughly $84,000 in year-one savings on a 50-vehicle refuse fleet, scaling linearly with size. Savings compound across metrics: breakdowns drop 7x (from 2.8 to 0.9 per truck/year), CPM drops from $0.71 to $0.58, OOS rate falls from 4.2% to 1.9%, hydraulic failures drop 42%, uptime climbs from 88% to 94%. Per-vehicle basis: $2,800-$4,400/year in preventable cost. Fleet-specific platforms typically recover their cost within the first quarter, then ongoing savings drop to the bottom line. Try the platform free to instrument your baseline against these benchmarks.
Recycling and split-body trucks have the lowest median at 68% — they carry two hydraulic systems to track and coordinate. Rear loaders come in second-hardest at 70% because they have the highest cycle count (800-1,200 hydraulic cycles per shift). On the other end, roll-off trucks achieve 79% median because they have the lowest cycle count (20-40 per day) and simpler mechanical systems. Cycle count and mechanical complexity determine baseline compliance difficulty across body types. But top-quartile achievers in every type hit 93-96% — showing the gap is closable regardless of body type with the right tracking discipline.
Three specific failures that digital systems solve automatically. DVIR completion rate: paper produces 61% median, digital 99% — missed DVIRs create missed defect reports, which create missed PMs, which drop compliance. PM trigger visibility: paper requires manual tracking of mileage, hours, and calendar per truck — humans forget, dispatch shifts priorities, PMs get deferred. Digital auto-schedules from real-time telematics data with no human dependency. Audit trail: paper takes hours to compile for the 48-hour audit window; digital produces instantly. The 40-point gap (54% paper vs 94% digital) is the single largest lever available to any refuse fleet — bigger than fleet size, body type, or equipment age.
Typically 12-18 months for a mid-size refuse fleet following the 5-step path. Step 1 (baseline) takes 2-4 weeks. Step 2 (deploy fleet-specific software) takes 4-8 weeks and produces the largest single gain (+12-18 points). Step 3 (first-to-occur PM logic) adds +4-6 points. Step 4 (hydraulic tracking) adds +2-4 points. Step 5 (grace-window discipline) takes 8-12 weeks to habituate, adding the final +2-3 points. Biggest gains land in the first 6 months. Fleets that try to compress the timeline below 12 months often see gains reverse when process discipline hasn't set — the 12-18 month window is what it takes for changes to become the new normal. Contact our team for a phased roadmap scoped to your fleet.
Leading — and it's the single most predictive leading indicator of downstream fleet performance. PM compliance rate today predicts cost per mile 6 months from now. Fleets at 94% compliance average 0.4 unplanned breakdowns per truck per year; fleets at 71% average 2.8. A 7x differential from one metric measured today. This is why fleet dashboards should surface PM compliance before any lagging metric — by the time CPM shows a problem, it's been building for months in the compliance data. Below 85% statistically guarantees higher breakdown frequency within 60-90 days. Above 92%, breakdown rates drop into the top-quartile band and stay there. Every other fleet metric moves as a function of this one.
Know your PM compliance percentile — before your next quarter's costs land
Real-time benchmark against 850+ refuse fleets. PM compliance rate per truck, per body type, per route. Auto-scheduled PMs with first-to-occur logic. Digital DVIR with 99% completion rate. Move from industry average (71%) to top quartile (94%+) in 12-18 months.