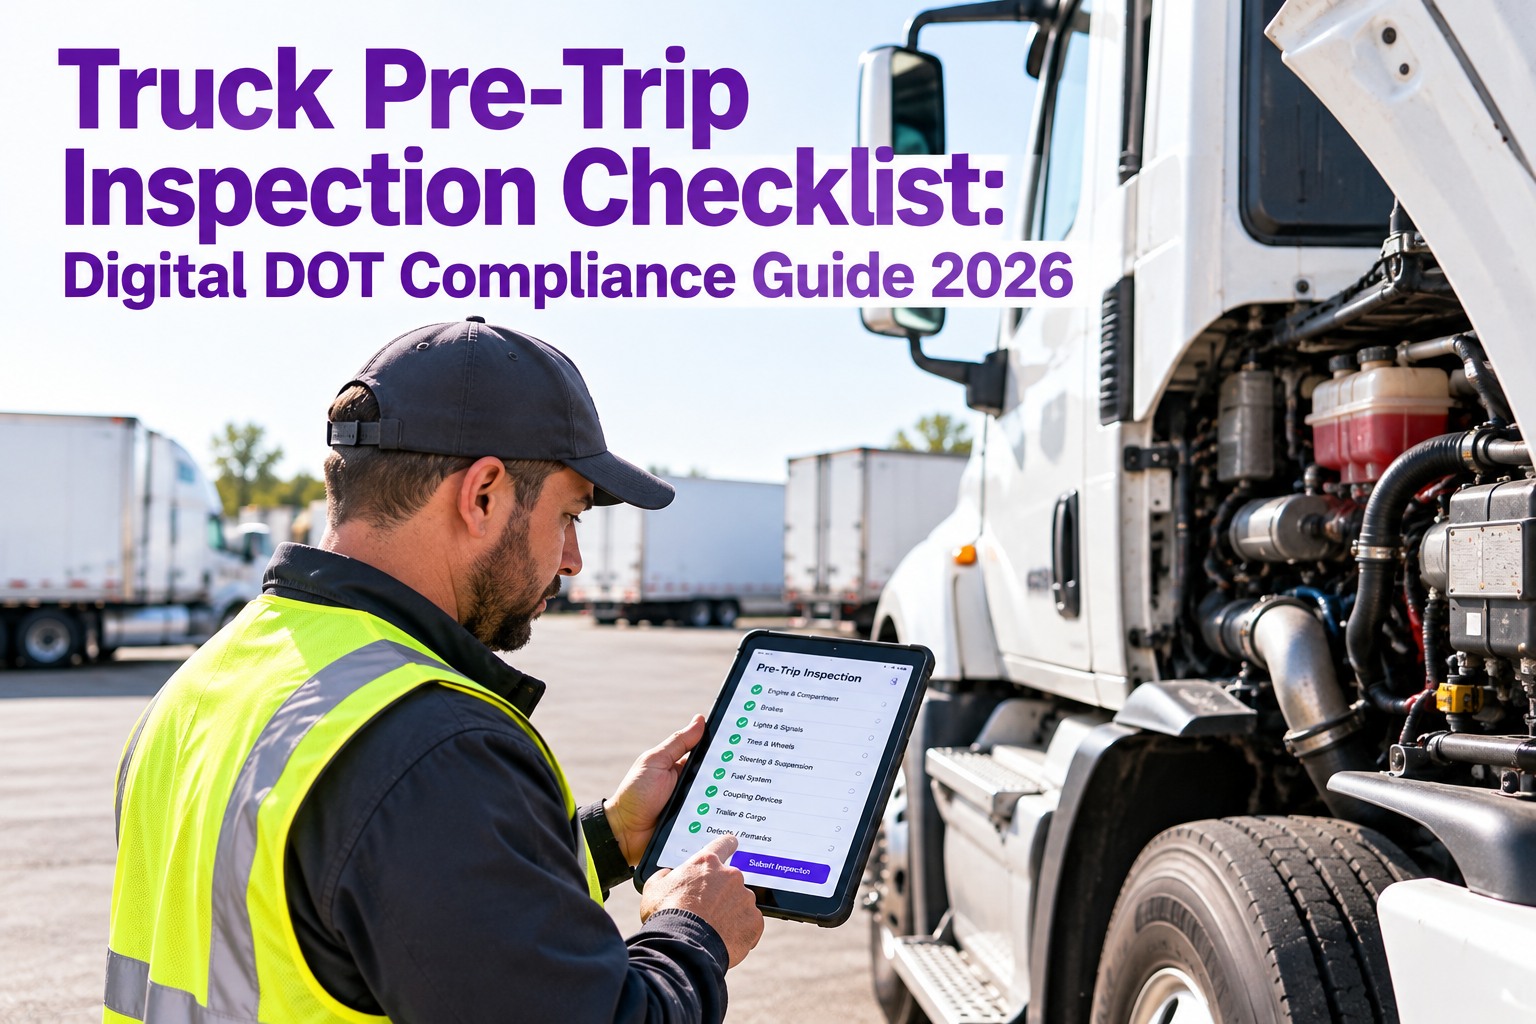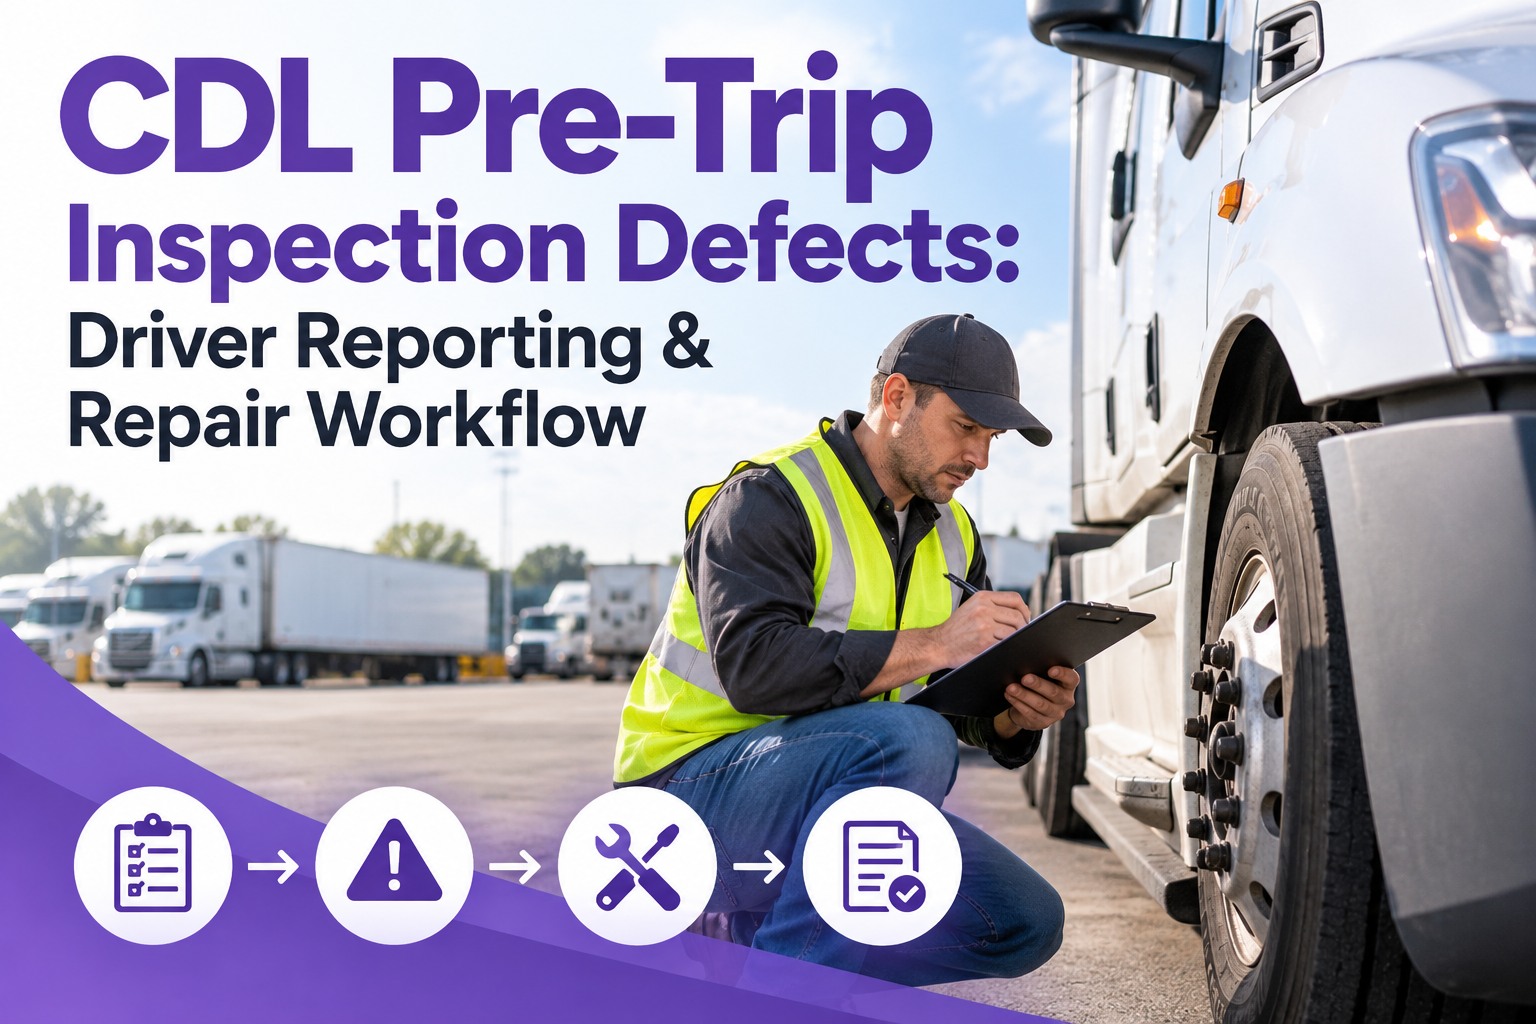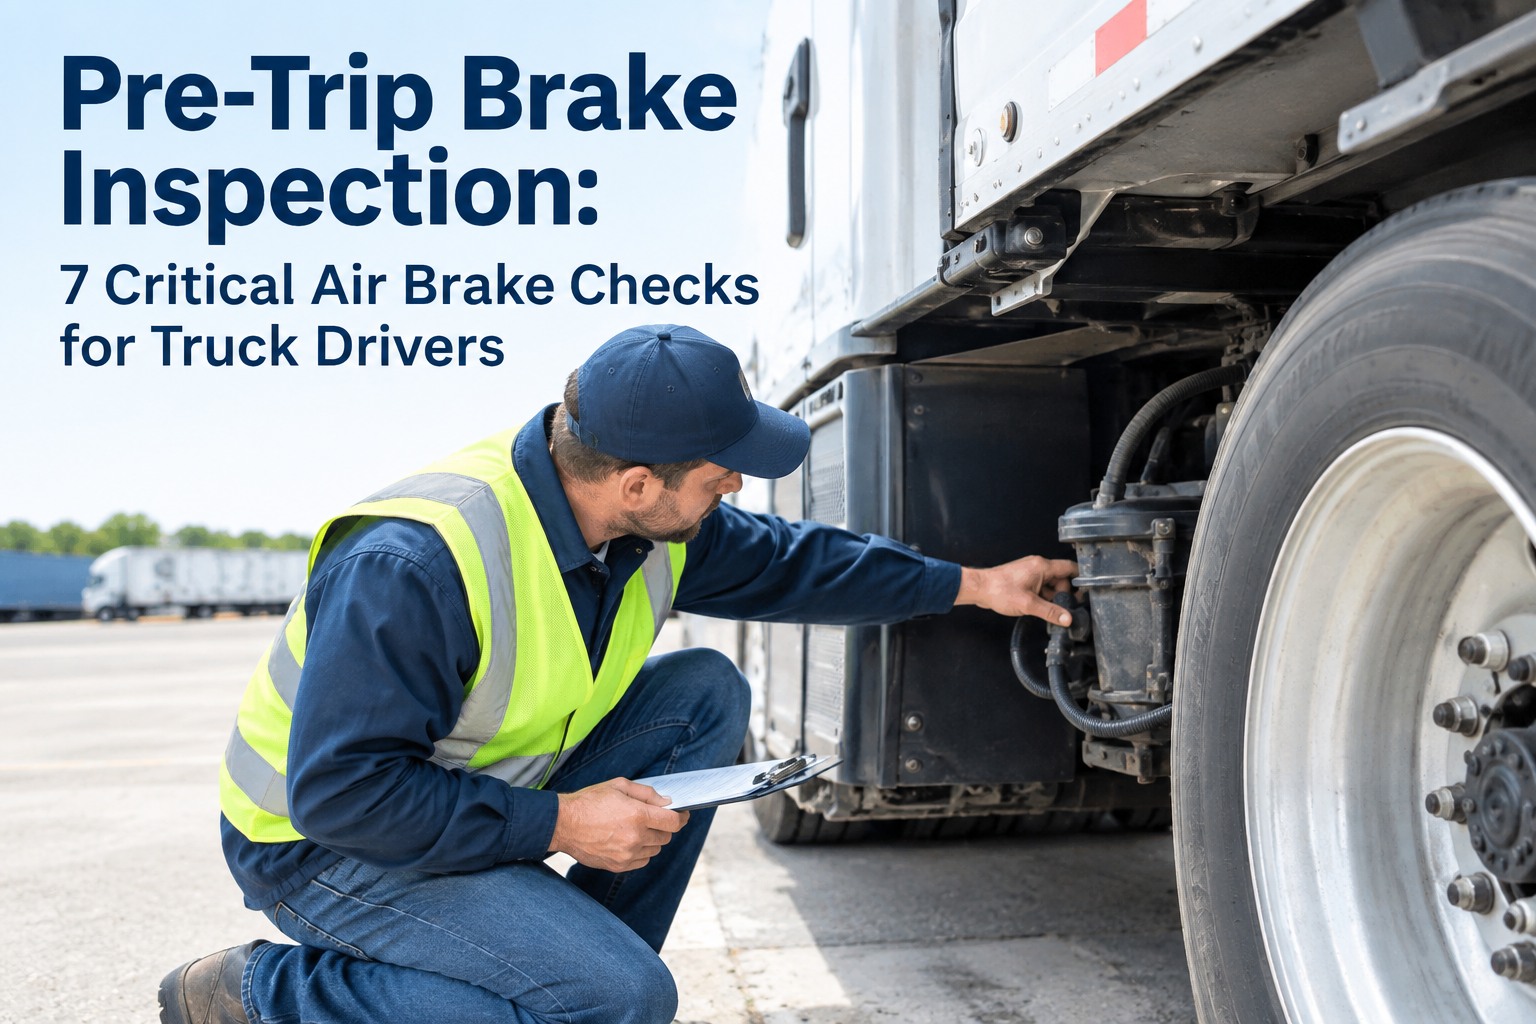
Roadside inspection data tells the same story every year: the defects that put trucks out of service aren't exotic failures — they're the same handful of items a driver could catch in a 10-minute walkaround. During the 2025 CVSA International Roadcheck, 56,178 commercial vehicles were inspected and 18.1% were placed out of service. Brakes drove 41.1% of all vehicle OOS orders (24.4% brake system + 16.7% 20% defective brakes combined), tires drove 21.4%, and lighting drove 14% — together, those three categories accounted for over 75% of every truck parked at roadside. Every one of them is a pre-trip inspection item. Under the 2026 CSA overhaul, each missed defect now scores twice — once in standard Vehicle Maintenance, once in the new "Driver Observed" category — with 2× severity weighting for OOS orders and $4,200 average penalty cost per violation. This article ranks the top 15 defects most frequently missed at pre-trip and caught at roadside, based on 2025 CVSA data and FMCSA violation frequency reports. Ready to eliminate these 15 defects from your fleet? Sign up free for Truck Inspection & Maintenance today — no credit card required and start catching every one of these defects at pre-trip with guided digital DVIRs, or contact our support team for a personalized walkthrough showing how top-performing fleets cut roadside OOS orders in half within 90 days.
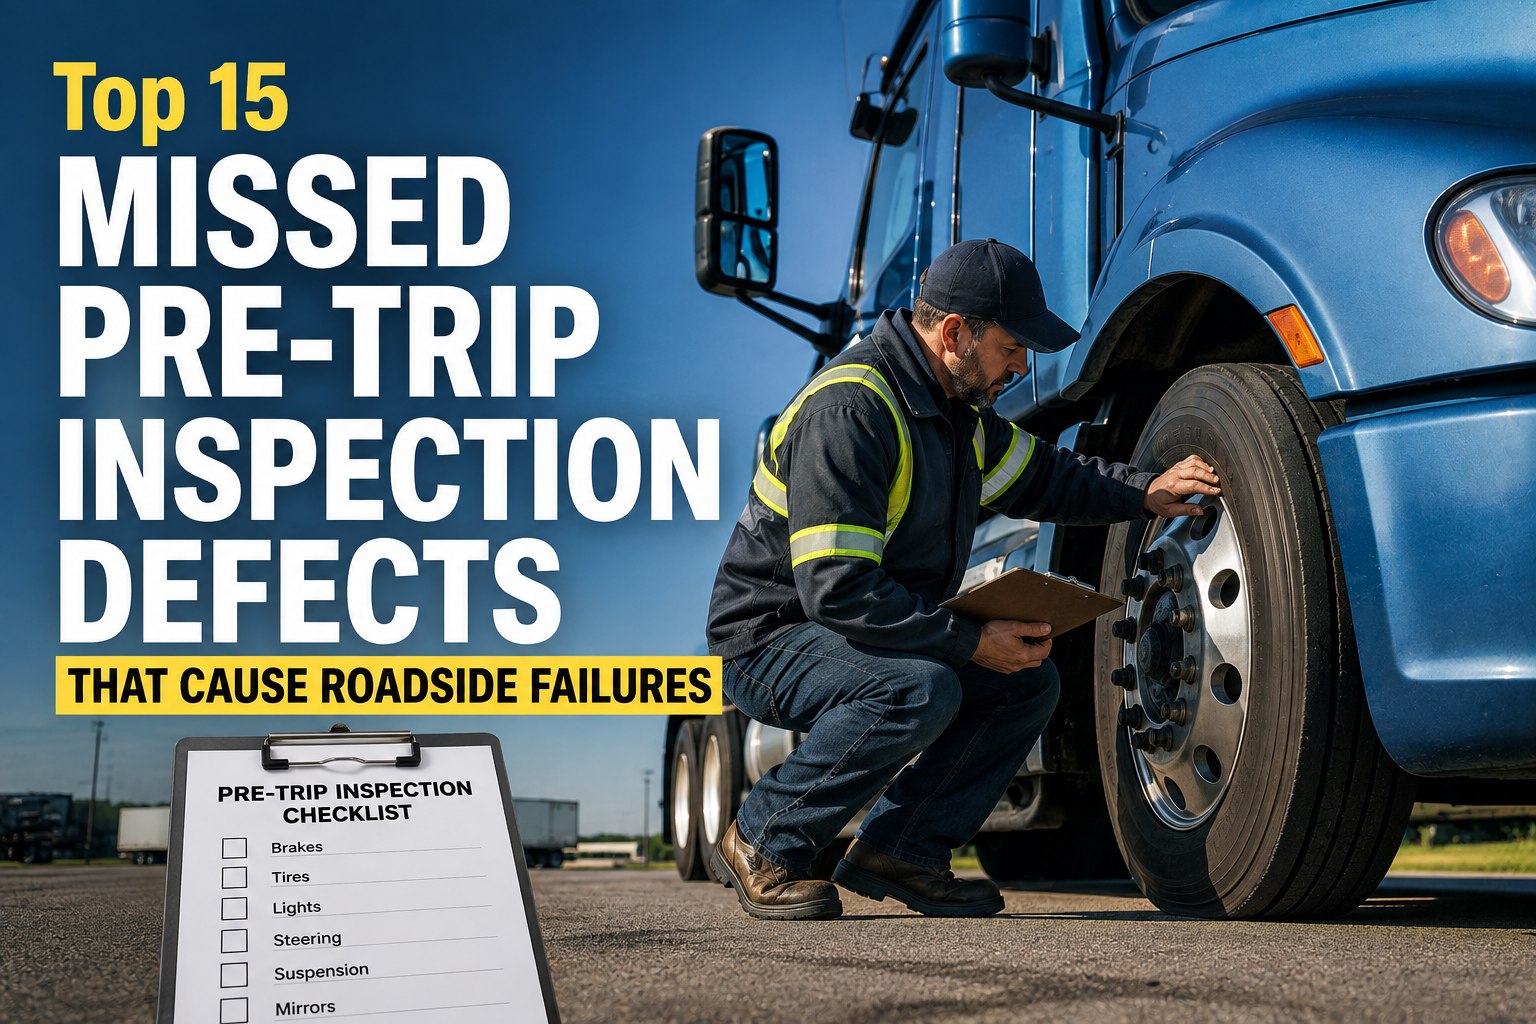
Top 15 Missed Pre-Trip Inspection Defects That Cause Roadside Failures
Brakes. Tires. Lights. In that order — and together they account for 75%+ of every OOS order at roadside. Here are the 15 specific defects fleet drivers miss most.
The 3-Category Impact Snapshot
Before the countdown, understand the scale. These three categories dominate every roadside inspection stop across North America — and every one is caught at pre-trip.
The Top 15 Missed Pre-Trip Defects — Ranked Countdown
Ranked by combined roadside frequency, OOS impact, and CSA point weight. Every one is a defect a driver walkaround should catch — and every one still shows up thousands of times per year at weigh stations across North America.
Catch every one of these 15 defects before the truck leaves the yard
Guided digital DVIRs cover all 15 defect categories with photo verification per checkpoint. Automatic defect routing to the maintenance shop. Real-time compliance tracking. Truck Inspection & Maintenance software turns the daily walkaround from a memory-based routine into a documented, auditable event that top-performing fleets use to cut roadside OOS orders in half within 90 days.
Why These 15 Defects Get Missed — The Root Causes
Every missed defect on the list above traces back to one of these 6 root causes. Fixing the root cause is what cuts the roadside OOS rate — not just re-training on the same walkaround.
The 2026 CSA Cost Multiplier — Why Every Miss Hurts Twice
Under the 2026 CSA overhaul that took effect this year, missed pre-trip defects hit the carrier's Safety Measurement System (SMS) percentile in ways they didn't before. Here's the compounding impact.
Frequently Asked Questions
Based on 2025 CVSA International Roadcheck data covering 56,178 vehicles inspected, three categories dominate every out-of-service order. Brake defects account for 41.1% of all vehicle OOS violations (24.4% brake system + 16.7% "20% defective brakes" combined) — including brake adjustment out of spec, air leak rate over limit, ABS malfunction lamps illuminated, cracked drums, and missing shoes. Tire defects account for 21.4% — including steer tire tread below 4/32", drive/trailer tire tread below 2/32", sidewall damage with exposed cord or belt, and severe cuts. Lighting defects account for 14% — including inoperative brake lights, inoperative turn signals, missing or damaged reflectors, and illegible USDOT identification. Together these three categories drive over 75% of every truck placed out of service at roadside. Every one is a pre-trip inspection item that a driver walkaround should catch. Truck Inspection & Maintenance software covers every one with guided digital DVIRs.
Six root causes explain most missed pre-trip defects. Time pressure and dispatch rush — a hurried 3-minute walkaround misses roughly half the checkpoints of a thorough 15-minute one. Paper checklist autopilot — same form filled out identically every day with no cognitive engagement, no photo verification, and no defect capture beyond the ink signature. Missing tools at the vehicle — no tread gauge, no chalk for brake stroke measurement, no flashlight for underbody inspection means defects that require tools go undetected. Chain-of-custody break — previous driver's DVIR not reviewed at handoff (§ 396.13 requires this before operation). Diffuse responsibility on shared fleet trucks — driver assumes the shop or previous driver already checked. Weather skipping — cold, wet, and dark conditions cause underbody and sidewall inspection to suffer disproportionately. Fixing root causes cuts the OOS rate; re-training on the same walkaround usually doesn't.
Under the 2026 CSA overhaul that took effect this year, each missed pre-trip defect now scores twice on the carrier's SMS percentile. The Vehicle Maintenance BASIC now splits into two separate categories — standard maintenance violations AND a new "Driver Observed" violation type that specifically captures defects a driver should have caught at pre-trip. Every roadside citation feeds both categories. Out-of-service orders now carry 2× severity weight in the SMS scoring algorithm compared to non-OOS violations of the same defect. FMCSA uses 116 grouped violation types instead of the previous individual violation codes, and each pre-trip defect maps to a specific group with its own scoring weight. Violations remain on the CSA record for a 12-month rolling window — a single Q1 OOS event compounds against the SMS percentile every month through the following Q1. Combined with the $4,200 average per-violation cost, the 2026 model makes pre-trip inspection quality directly visible in carrier safety scores in ways it wasn't before.
The evidence from fleets that have made the transition supports significant OOS reduction. Digital pre-trip inspection apps address every one of the 6 root causes documented above. Time pressure — guided workflows compress inspection time from 30-45 minutes on paper to 10-15 minutes digitally while covering MORE checkpoints, not fewer. Paper autopilot — photo verification per checkpoint creates cognitive engagement (the driver has to actually look at the item and capture evidence). Missing tools — many apps prompt for gauge measurements, brake stroke chalk marks, and other tool-based measurements as required fields. Chain-of-custody — the previous DVIR appears on the driver's phone or tablet automatically, with signature enforcement before dispatch. Diffuse responsibility — every DVIR captures the specific driver who verified each checkpoint, eliminating "someone else checked it" thinking. Weather — flashlight and camera on the driver's phone work in every condition. Top-performing fleets have documented 40-60% reduction in roadside OOS orders within 90 days of digital DVIR rollout. Contact our team to see how Truck Inspection & Maintenance software delivers those results with fleet case studies.
A single out-of-service violation now averages $4,200 in direct penalties, but the total cost to the carrier is significantly higher. Direct costs include the citation itself, mandatory repair before the truck can move (roadside service call at premium rates because tow-to-shop is often prohibited on OOS trucks), missed delivery window and any customer contract penalties, driver time lost during the incident (still on the clock), and insurance premium impact at renewal. Indirect costs include the 12-month CSA scoring impact reducing the carrier's SMS percentile (which affects new customer bidding and insurance rates), the Driver Observed category scoring under the 2026 CSA overhaul (double-counting on Vehicle Maintenance), and reputational damage in load boards and dispatcher networks where safety scores are visible. When the true fully-loaded cost is calculated, most fleet operators find each OOS event runs $8,000-$15,000 in total impact — orders of magnitude higher than the $10-$50 cost to catch the defect at pre-trip.
Lighting defects — burned-out marker lights, brake lights, turn signals, and missing reflectors — are the easiest OOS category to prevent and the highest-value quick win for any fleet. A replacement LED marker lamp costs $10 to $30, a bulb costs $2 to $5, and the citation for an inoperative light costs $500+ direct plus 12 months of CSA score damage plus the 2026 Driver Observed double-scoring. Every pre-trip should include: parking lights on, walk the entire vehicle counting all clearance/marker/tail/ID/license plate lamps. Helper presses brake pedal, walk rear, verify all 3 stop lamps steady and bright. Left signal on, walk truck front-side-rear, then right signal same check. Reflectors and conspicuity tape intact, no missing sections. Any single defect = fix in the yard before departure. Lighting alone accounts for 14% of all OOS violations — capturing it eliminates roughly one in seven roadside OOS events at nearly zero cost. Try free: sign up here.
Truck Inspection & Maintenance software eliminates all 15 defects from your roadside record
Guided digital DVIRs covering every § 392.7 item plus the top 15 defect categories. Photo verification per checkpoint. Tread gauge and brake stroke measurement prompts. § 396.13 chain-of-custody enforcement. Automatic defect routing to the maintenance shop before dispatch. 2026 CSA-aware categorization tracking Driver Observed violations. Every element of pre-trip compliance managed in one platform — because top-performing fleets have documented 40-60% reduction in roadside OOS orders within 90 days of digital DVIR rollout.