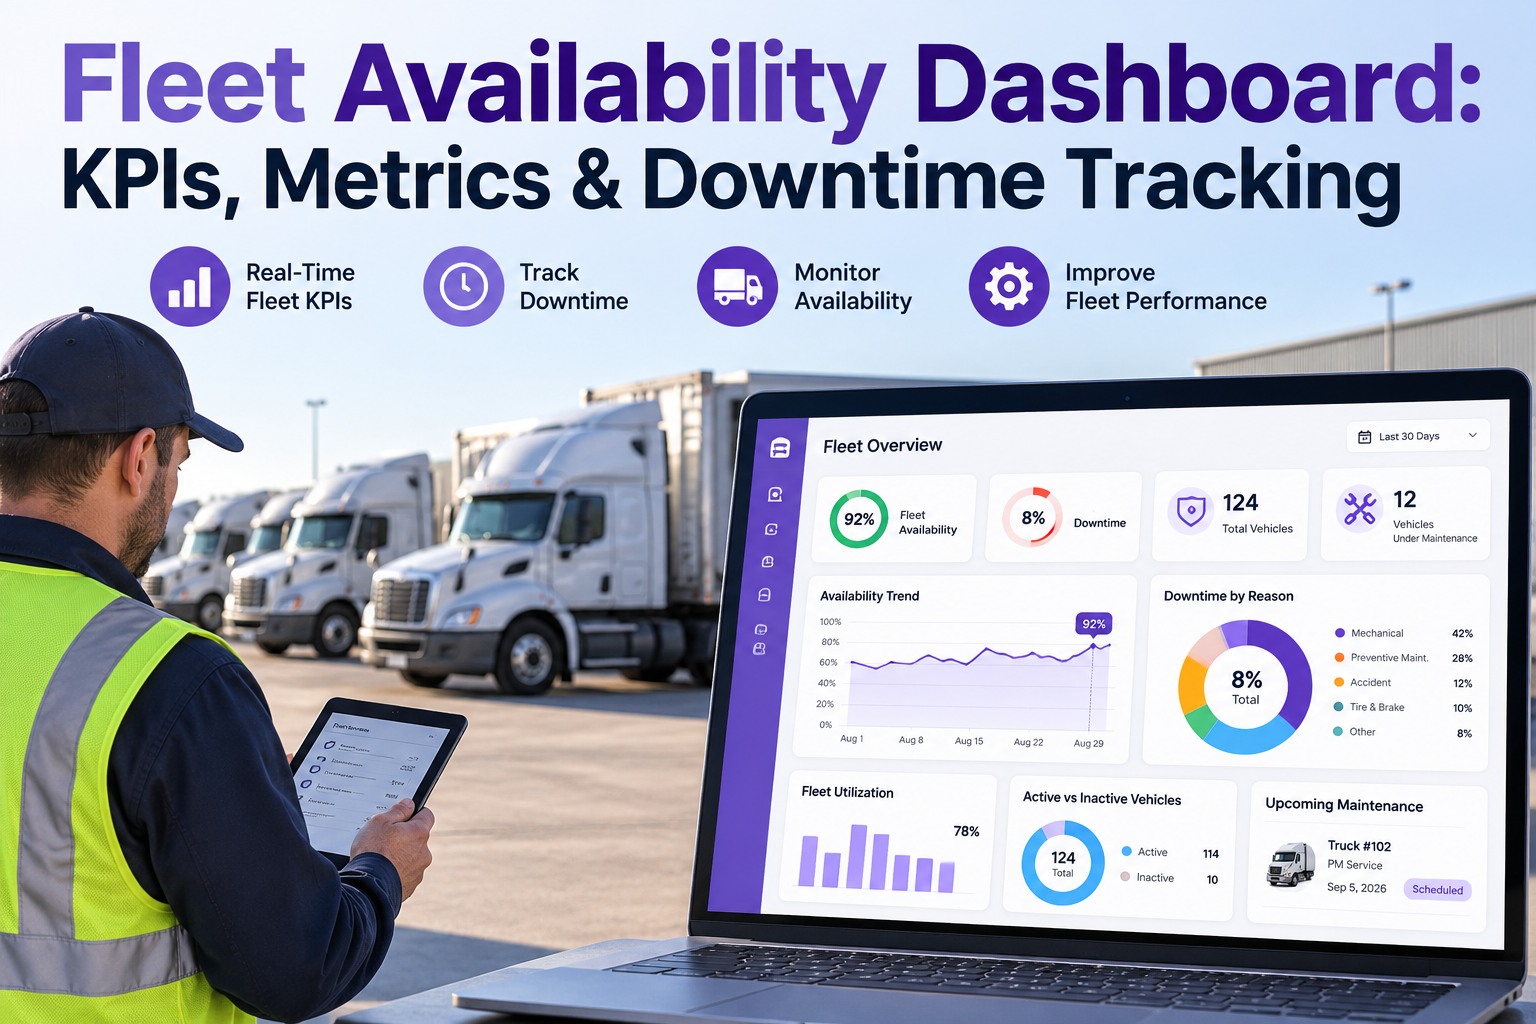
Most "fleet dashboards" show a single number — total downtime hours this month which tells you something went wrong without telling you why, where, or what to fix first. A real availability dashboard works backward from that number: PM compliance predicts MTBF, MTBF and MTTR together predict availability, and availability predicts whether tomorrow's loads have a truck to run on. Build the dashboard in that order and it stops being a report nobody opens and starts being the thing you check every morning. Start free and see your fleet's availability KPIs calculated automatically.
Live Fleet Scorecard · PM Compliance → MTBF → MTTR → Availability
A Dashboard Should Tell You What's About to Break — Not Just What Already Did
A single downtime number is a lagging indicator; by the time it moves, the damage is done. Truck Inspection & Maintenance Management Software builds the dashboard from the leading indicators up — PM compliance, open defects, and parts fill rate — so a dip shows up as a warning on today's screen, not a surprise on next month's report.
What a Real Availability Dashboard Looks Like
A working dashboard fits on one screen and answers one question at a glance: where is downtime risk building right now? Here's the tile layout that does it.
Fleet Availability
92%
World-class: 95%+
MTBF
410hrs
Trending up = PM working
MTTR
6.5hrs
High = parts or skill gap
PM Compliance
88%
Target: 90–95%+
Open Defects
14
Age-sorted, oldest first
Parts Fill Rate
81%
Low fill rate stretches MTTR
The Chain — Why PM Compliance Is the Number That Moves First
These six tiles aren't independent of each other. They sit in a cause-and-effect chain, and the metric at the front of that chain is the one most within a team's direct control.
PM Compliance DropsScheduled maintenance slips past its due date
→
MTBF ShortensEquipment fails faster than the PM program intended
→
Unplanned Downtime RisesMore trucks pulled from service without warning
→
Fleet Availability FallsFewer trucks available when a load needs one
Why this matters for review cadence A fleet that only reviews cost per mile and total downtime monthly ends up chasing symptoms after the fact. A fleet that reviews PM compliance and parts fill rate weekly is watching the two numbers that move first — and catching the problem before it reaches the availability line at all.
The Formulas Behind Every Tile
Benchmarks — Where Each KPI Should Sit
| KPI | Target / World-Class | Warning Zone |
| Fleet Availability |
95%+ |
Below 90% |
| PM Compliance |
90–95%+ |
Below 85% |
| MTBF |
Trending upward |
Trending downward |
| MTTR |
Trending downward |
Rising repeatedly |
| Parts Fill Rate |
90%+ |
Below 80% |
One Dashboard, Every Leading Indicator
Our Truck Inspection & Maintenance Management Software calculates fleet availability, MTBF, MTTR, PM compliance, and open defect backlog automatically from your actual inspection and work order data — no spreadsheet, no manual math, no waiting for month-end to find out something was already going wrong.
Frequently Asked Questions
What's a good fleet availability target to aim for?
Many high-performing fleet operations treat 95% or higher as a world-class benchmark for availability, though the right target varies by fleet age, duty cycle, and how much spare capacity the operation can tolerate. The trend over time generally matters more than any single month's number.
Start free and see where your fleet currently sits against this benchmark.
Why track PM compliance separately from downtime if they measure similar things?
PM compliance is a leading indicator — it predicts downtime weeks before it happens — while downtime itself is a lagging indicator that only confirms damage already done. Tracking PM compliance gives a team time to act; tracking downtime alone only gives them something to explain afterward.
What does a consistently high MTTR usually indicate?
A persistently high mean time to repair more often points to a parts availability problem — technicians waiting on a part to arrive — than a lack of technician skill. Checking parts fill rate alongside MTTR usually reveals which one is actually the bottleneck.
How often should a fleet actually review these KPIs?
Leading indicators like PM compliance and parts fill rate are worth reviewing weekly, since they move first and give the most time to react. Lagging outcomes like total cost per mile and overall downtime are typically fine on a monthly cadence, since they summarize what the leading indicators already predicted.
Contact us to set up a review cadence that fits your fleet size.
Availability · MTBF · MTTR · PM Compliance — One Live Screen
Stop Finding Out About Downtime After It Already Cost You
Our Truck Inspection & Maintenance Management Software builds your fleet's availability dashboard from real inspection, defect, and work order data — automatically calculated, benchmarked, and ready to check every morning instead of reconstructed once a month.
No credit card required. Free for up to 3 trucks.