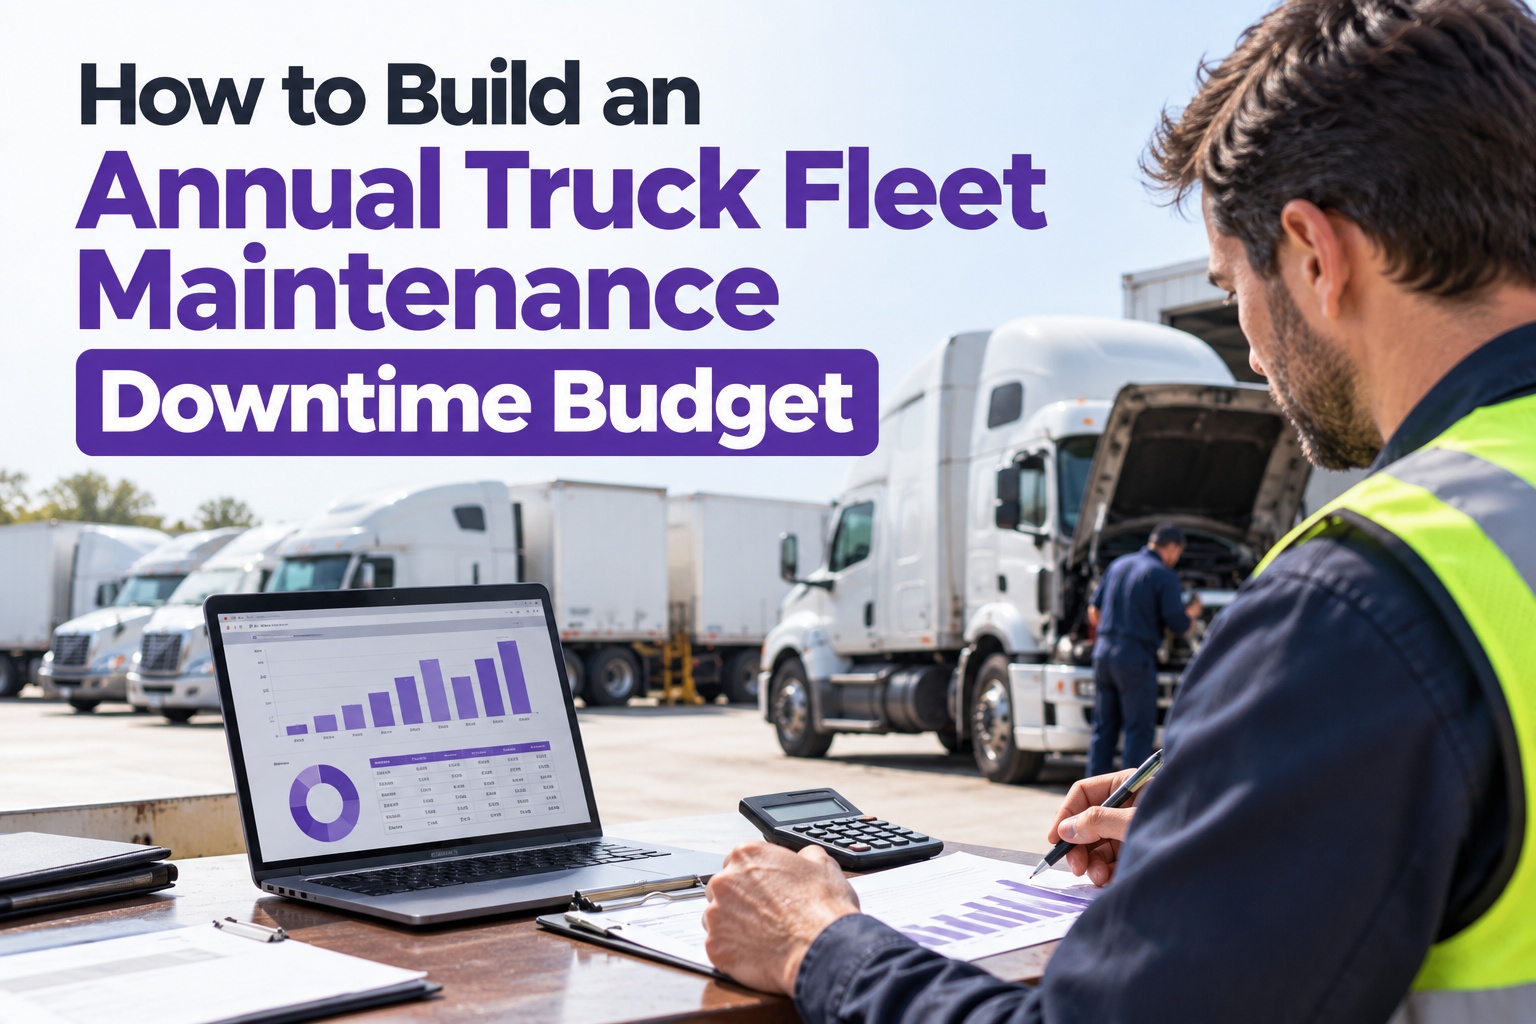
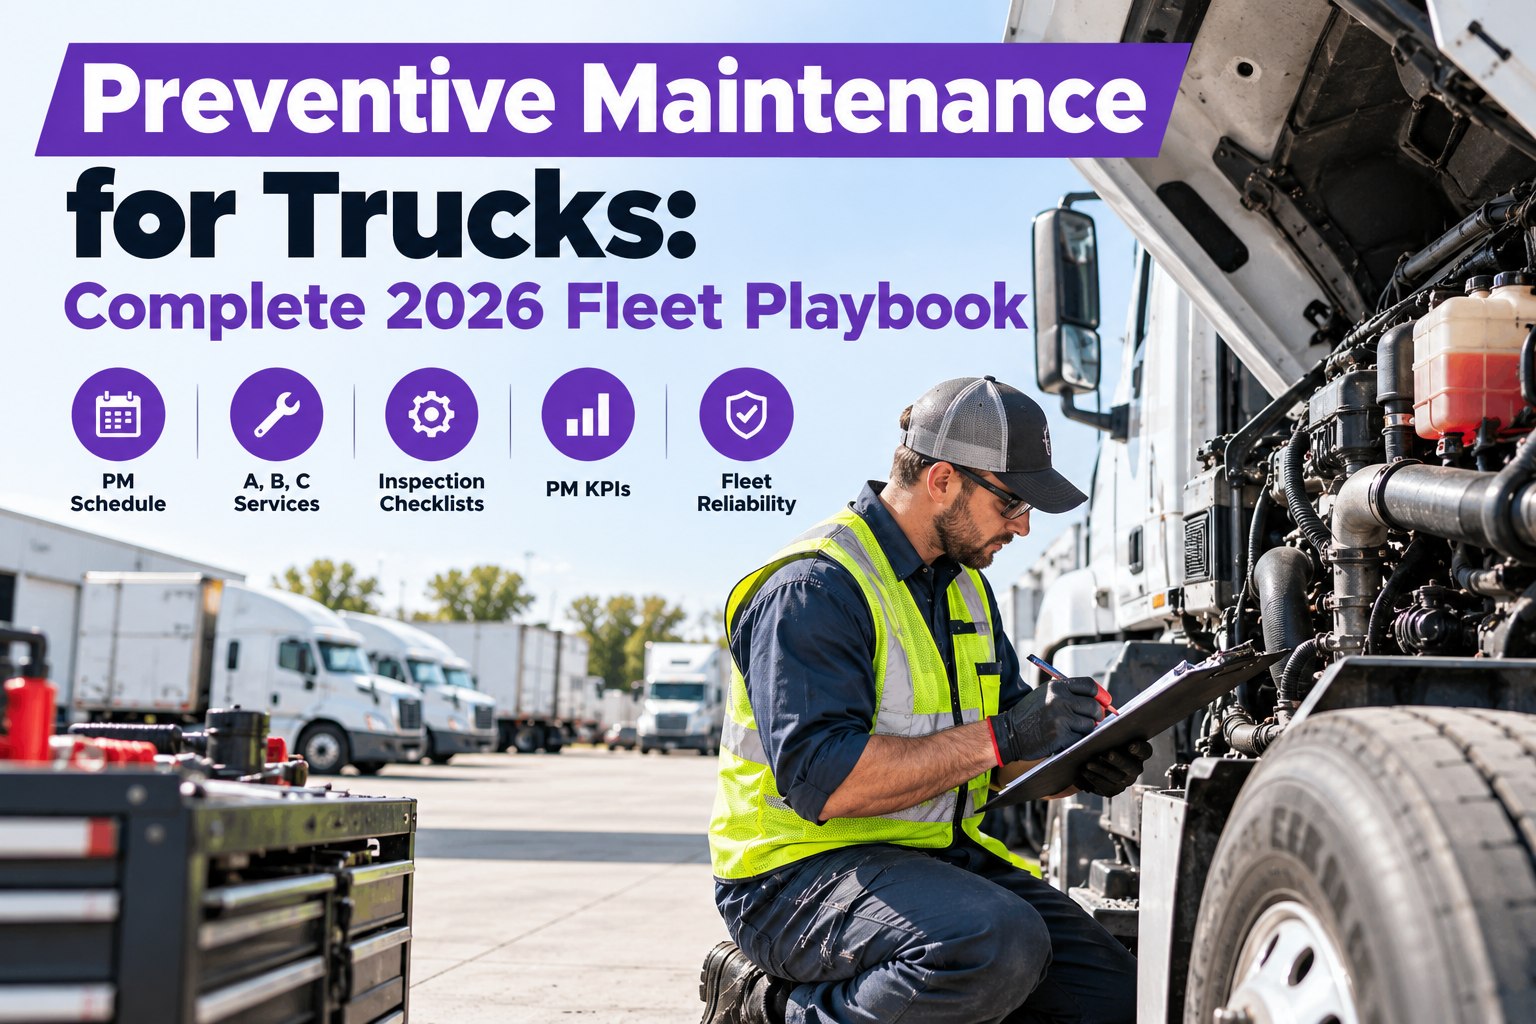
Most fleets don't budget for downtime — they get billed for it. A downtime budget flips that: it turns the most unpredictable line in your P&L into a number you set, defend each month, and drive down on purpose. Here's the model, the review cadence, and the 2026 benchmarks that tell you if your number is good. Start free and turn every inspection into the cost data your budget runs on.
Inspection → DVIR → Defect → Work Order → PM
Your Downtime Budget Is Only as Real as the Data Behind It.
Maintenance keeps blowing past plan and you can't say which trucks did it or why — because the cost lives in a stack of invoices, not a system. Truck Inspection & Maintenance Management Software runs the whole loop: guided inspections and DVIRs on the driver's phone, defects routed to graded work orders, PM scheduled before failures — with every check, repair, and dollar recorded against its unit. That's a budget built from what your fleet actually did.
$448–$760cost of one truck-day of downtime
~8.7 daysunplanned downtime per truck / year
$0.2022026 ATRI maintenance cost per mile
Why "Whatever the Invoices Add Up To" Is Not a Budget
What separates a fleet that controls maintenance cost from one that gets controlled by it is whether the number was decided in advance — a budget lets you catch a wearing pattern in March; an invoice pile lets you find it in December, after it's cost you. And the stakes keep climbing: maintenance now runs about 8.9% of operating cost, at $0.202 per mile in 2026 — up 8.6% in a year.
No budget — the invoice pile
- Cost is discovered at month-end, after it's spent
- Reactive repairs quietly become the majority of spend
- Emergency parts bought at 3–5× standard price
- Variance can't be explained — only absorbed
- Replace-vs-repair calls made on gut, not cost-per-unit
vs
A downtime budget — the plan
- Cost is set in advance and defended monthly
- Planned-vs-reactive ratio is a target you steer toward
- Parts pre-staged against a known PM calendar
- Every overage traces to a unit, a route, or a cause
- The worst-cost trucks are visible two inspections early
The Six-Line Model
A downtime budget isn't one number — it's six line items that each behave differently. Some are predictable enough to schedule; others are statistical, forecast as events × average cost. The point of splitting them: predictable lines get cheaper when you fund them, and statistical lines shrink when the predictable ones are funded properly. Build each from your own trailing-12-month data, and the benchmarks below where you can't.
1
Planned PM & scheduled service
The predictable core — oil, filters, brakes, tires, DOT-annual inspections. Priced at standard parts and labor rates. This line should grow as a share of the budget, because every dollar here removes several from line 4.
Scheduled
2
Wear-based component replacement
Clutches, batteries, DPF service, wear items that fail on a mileage or hours curve. Not calendar-scheduled, but forecastable per unit from run-hours and history.
Forecast
3
Tires
Its own line because it's large and trackable — the 2026 industry tire cost sits around $0.05 per mile. Budget by position and tread policy, not as a lump in "repairs."
Forecast
4
Unplanned repair & roadside
The statistical line: events × average cost. A single breakdown runs $3,000–$9,000, and the average truck sees a handful a year. This is the line a good PM program is designed to shrink.
Statistical
5
Downtime revenue & disruption
The invisible half: $448–$760 per truck per day, plus idle driver pay, load recovery, and rebalanced dispatch. Usually larger than the repair itself — and almost never budgeted.
Statistical
6
Contingency & age reserve
A reserve scaled to fleet age. Trucks over 10 years old cost several times more per mile than those under 5 — an aging fleet needs a bigger reserve, or a replacement plan that shrinks this line on purpose.
Reserve
The Lever That Makes the Budget Shrink
Every line is downstream of one ratio: how much of your maintenance is planned versus reactive. Reactive work costs 3 to 5 times more per equivalent repair — up to 9× for a catastrophic roadside failure. A $300 brake job you scheduled becomes a $2,000 emergency when it fails on the interstate. Shift the ratio and the budget follows it down.
Bottom quartile40–45% planned
Reactive work is the majority. Cost per mile runs well above average and variance is uncontrollable.
Industry average55–60% planned
Roughly half the spend is still unplanned — the largest available savings sit right here.
Best-in-class80–85% planned
The 80/20 target. Cost per mile lands 20–30% below industry average and the budget becomes predictable.
The 10-point rule Industry data is consistent on the payoff: every 10-percentage-point shift from reactive to planned maintenance cuts total maintenance cost by roughly 6–12%. You don't have to reach 80/20 in year one to see it — moving from 50/50 to 60/40 is a real, budgetable line-item reduction. That's why the ratio belongs in the budget itself as a target, not just in a strategy deck.
Where the Benchmarks Land in 2026
You can't tell whether your budget is good without a yardstick. These are the reference points fleets measure against this year — anchor your model to the ones matching your class mix and duty cycle, then treat the gap as the size of your opportunity.
| Metric | 2026 benchmark | Top-quartile | What it tells your budget |
| Maintenance cost per mile (Class 8) |
~$0.202 / mile |
$0.12–$0.18 |
The anchor for lines 1–4 combined |
| Annual M&R per truck |
~$16,192 |
Materially lower |
Sanity-check on total budget ÷ trucks |
| Downtime cost per truck-day |
$448–$760 |
Fewer days, not cheaper days |
Sizes line 5 |
| Unplanned downtime days / truck / yr |
~8.7 days |
Well below average |
Events feeding lines 4 & 5 |
| Planned-to-reactive ratio |
55–60% planned |
80–85% planned |
The lever on every line |
| PM compliance rate |
Varies widely |
>95% |
Leading indicator the budget will hold |
| Cost, truck >10 yrs vs <5 yrs |
Up to ~5.5× per mile |
Managed by replacement plan |
Sizes line 6 reserve |
A Worked Example: 25 Trucks
Numbers make it real. Here's a mid-size fleet's downtime exposure before optimization, built from the benchmarks above — swap in your own counts. The point isn't the total; it's how much lives in lines 4 and 5, the ones the budget attacks.
LineBasisAnnual estimate
Unplanned events25 trucks × ~2 events~50 events / yr
Direct repair (line 4)50 × ~$5,000 avg~$250,000
Downtime days (line 5)25 × 8.7 days~217 truck-days
Downtime cost (line 5)217 days × ~$600~$130,000
Reactive exposurelines 4 + 5~$380,000 / yr
That ~$380K is the target — not fixed cost, but the portion a disciplined PM program is built to shrink. Move this fleet from 50/50 toward 70/30 and a double-digit share comes back as budget you keep.
Your Budget Is Only as Good as Your Data
A budget built on estimates drifts; one built on your fleet's own numbers holds. Truck Inspection & Maintenance Management Software logs each inspection, defect, work order, and repair cost as it happens and ties it to a unit and date — so every budget line traces to real events. Guided inspections run on the driver's phone, failed checks become graded work orders on their own, and the cost lands against the truck. When finance asks why a line ran over, the answer is already in the system.
The Review Cadence That Keeps It Honest
A budget set in January and reopened in December isn't a budget — it's a prediction you forgot to check. What makes one work is the review rhythm: fast enough to intervene, structured enough to repeat. Each cadence answers a different question.
Weekly
Are we accruing to plan?
Scan open work orders, roadside events, and any truck approaching an OOS threshold. Catch the wearing pattern while it's still a reading, not a breakdown.
Monthly
Where's the variance, and why?
Compare actual vs budgeted by line. Every overage should trace to a unit, a route, or a cause — not "repairs were high." This is where the budget earns its keep.
Quarterly
Is the ratio moving?
Check planned-vs-reactive trend and PM compliance. If the ratio isn't shifting toward planned, the annual number won't improve no matter how the invoices look.
Annual
Rebuild from actuals.
Next year's budget is this year's real per-unit data plus the age reserve for another year of fleet aging — or the replacement plan that resets it.
Building It, Start to Finish
Starting from a blank sheet, the order matters. Do it in this sequence and each step feeds the next; do it out of order and you'll guess at the lines that matter most.
1
Pull your trailing 12 months by categorySeparate planned PM, wear replacement, tires, unplanned repair, and downtime days. Most fleets have never split reactive out from planned — this split is the whole exercise.
2
Establish your current ratioPlanned spend ÷ total spend. This is your starting point and your single most important lever.
3
Set next year's ratio targetA realistic 10-point shift, not a leap to 80/20. Each 10 points is worth roughly 6–12% off total cost.
4
Forecast each of the six linesPredictable lines from the calendar and run-hours; statistical lines from events × average cost, adjusted down for your ratio target.
5
Add the age reserveScale line 6 to fleet age. Older iron needs a bigger reserve or a replacement schedule — decide which, don't drift.
6
Wire in the review cadenceWeekly accrual scan, monthly variance, quarterly ratio check. A budget without a review loop reverts to an invoice pile by March.
Frequently Asked Questions
How much should I budget for truck maintenance per mile in 2026?
The 2026 ATRI industry average for maintenance and repair is about $0.202 per mile for Class 8 trucks — roughly $16,192 per truck annually and around 8.9% of total operating cost. Top-quartile fleets run $0.12–$0.18 per mile through PM discipline and fleet-age management. But the blended average is dominated by long-haul truckload operations, so if you run a mixed fleet, segment by duty cycle and class and benchmark each segment against its own appropriate figure rather than the single blended number. The value isn't in hitting the benchmark — it's in knowing your own number precisely enough to make replace-vs-repair calls on specific units.
Start free and track your cost per mile per unit automatically.
What's the difference between a maintenance budget and a downtime budget?
A maintenance budget covers what you spend fixing and servicing trucks — parts, labor, PM. A downtime budget goes further and includes the cost of the truck not earning while it's out: $448–$760 per truck per day in lost revenue and disruption, plus idle driver pay and load recovery. That invisible half is usually larger than the repair itself, and it's the line most fleets never budget for. Including it is what turns the exercise from "controlling repair spend" into "protecting uptime," which is the number that actually moves profitability.
What planned-to-reactive ratio should I aim for?
Best-in-class fleets run 80–85% planned and 15–20% reactive. Industry average sits around 55–60% planned, and the bottom quartile is 40–45% planned. You don't need to reach 80/20 immediately — every 10-percentage-point shift toward planned work cuts total maintenance cost by roughly 6–12%, so moving from 50/50 to 60/40 is a real, budgetable win in a single year. The reason the ratio matters so much is cost per event: reactive repairs run 3–5 times more than the equivalent planned service, and higher still when a roadside failure pulls in towing and lost freight.
How do I forecast unplanned breakdowns I can't predict?
You forecast them statistically, not individually — events per truck per year × average cost per event. Industry data puts the average around 8.7 unplanned downtime days per truck annually, with a typical breakdown costing $3,000–$9,000 in direct repair. Multiply your truck count by your own event rate and average cost to size the line, then reduce it in proportion to your planned-vs-reactive target, because a better ratio produces fewer events. Your own trailing-12-month history is far more accurate than any benchmark once you have it captured per unit.
Does fleet age change how I should budget?
Significantly. Trucks over 10 years old can cost up to around 5.5 times more per mile in maintenance than trucks under 5, so an aging fleet needs either a larger contingency reserve (line 6) or a replacement plan that deliberately shrinks that line. The mistake is letting the reserve drift upward every year without deciding whether you're managing old iron or replacing it. Build the age reserve as a conscious number tied to your fleet's actual age curve, and revisit it every annual cycle.
Forecast · Review · Drive It Down
Turn Downtime From a Surprise Into a Line Item
Every number this budget depends on — inspections, defects, work orders, repair cost — is captured by Truck Inspection & Maintenance Management Software the moment it happens, tied to its unit. Drivers run guided pre-trips on their phones, failed checks become graded work orders automatically, PM reminders keep the planned share climbing, and audit-ready reports make every variance easy to explain. That's how fleets move toward an 80/20 planned ratio and pull cost per mile below the industry average.
No credit card required. Free for up to 3 trucks. Built for FMCSA-compliant fleets.