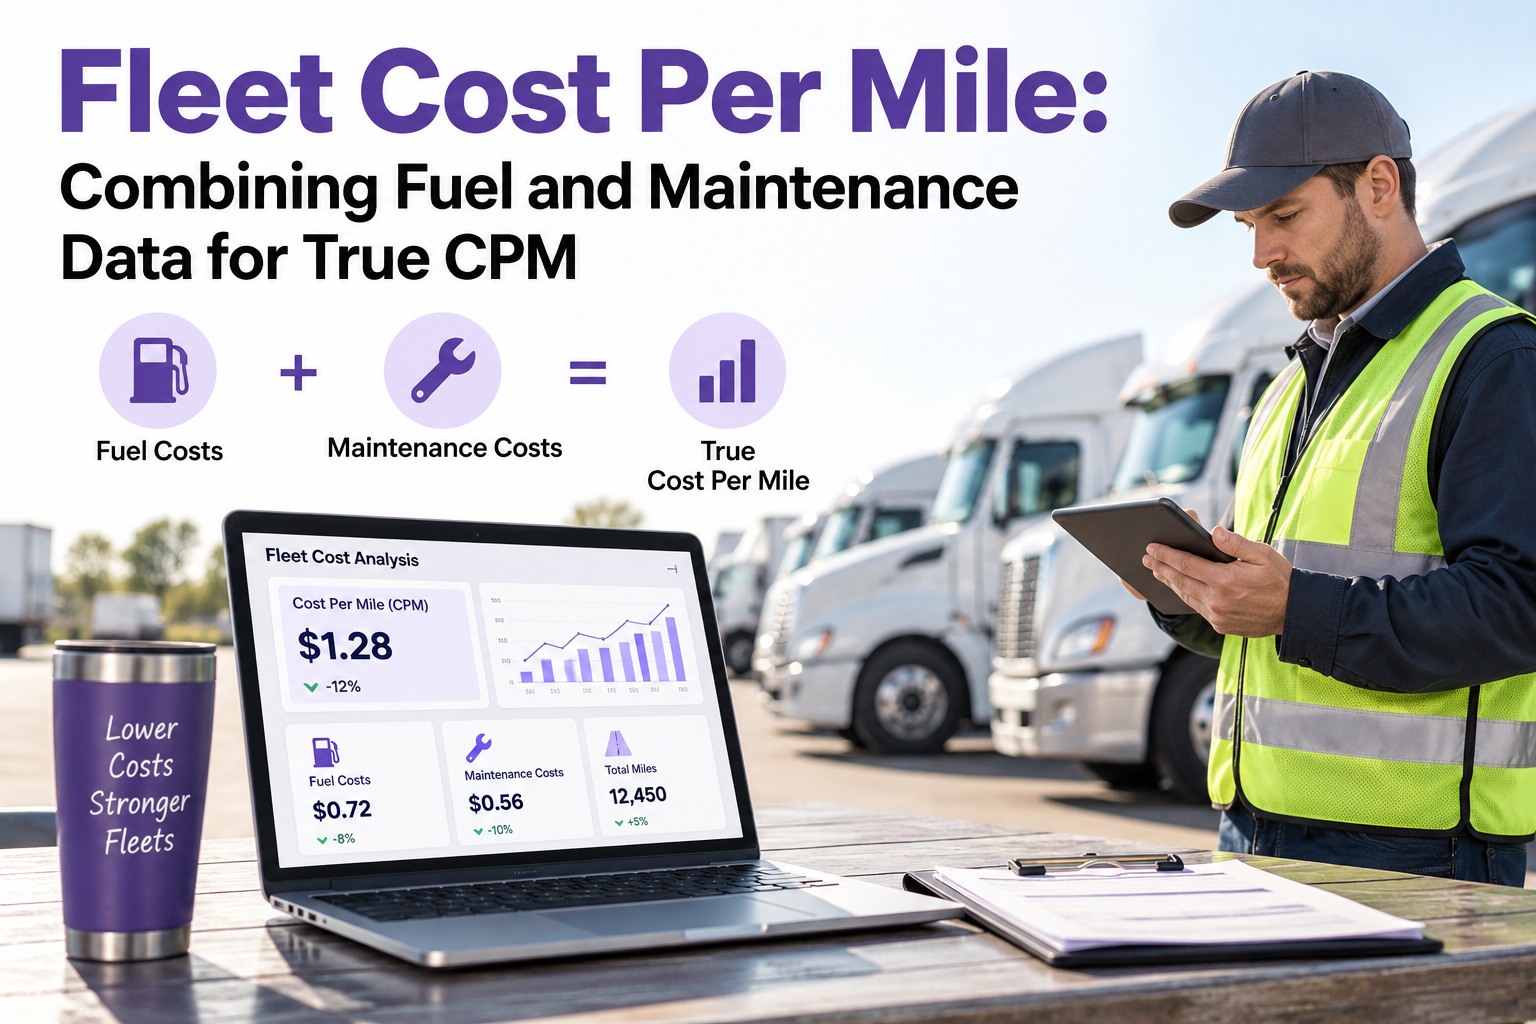
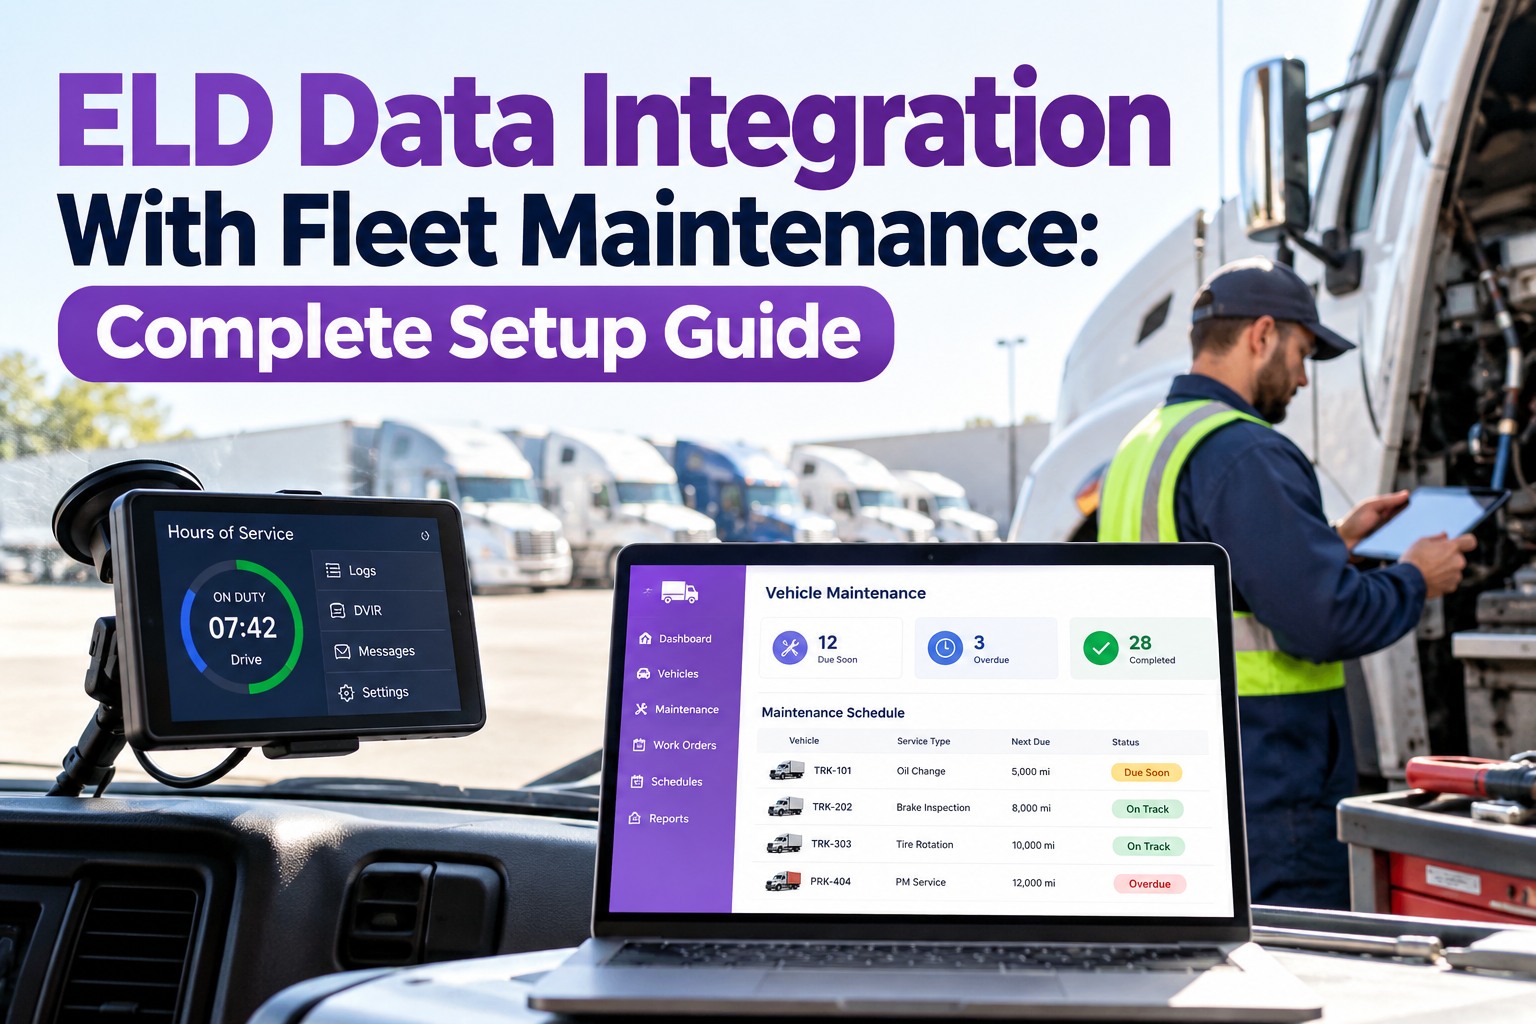
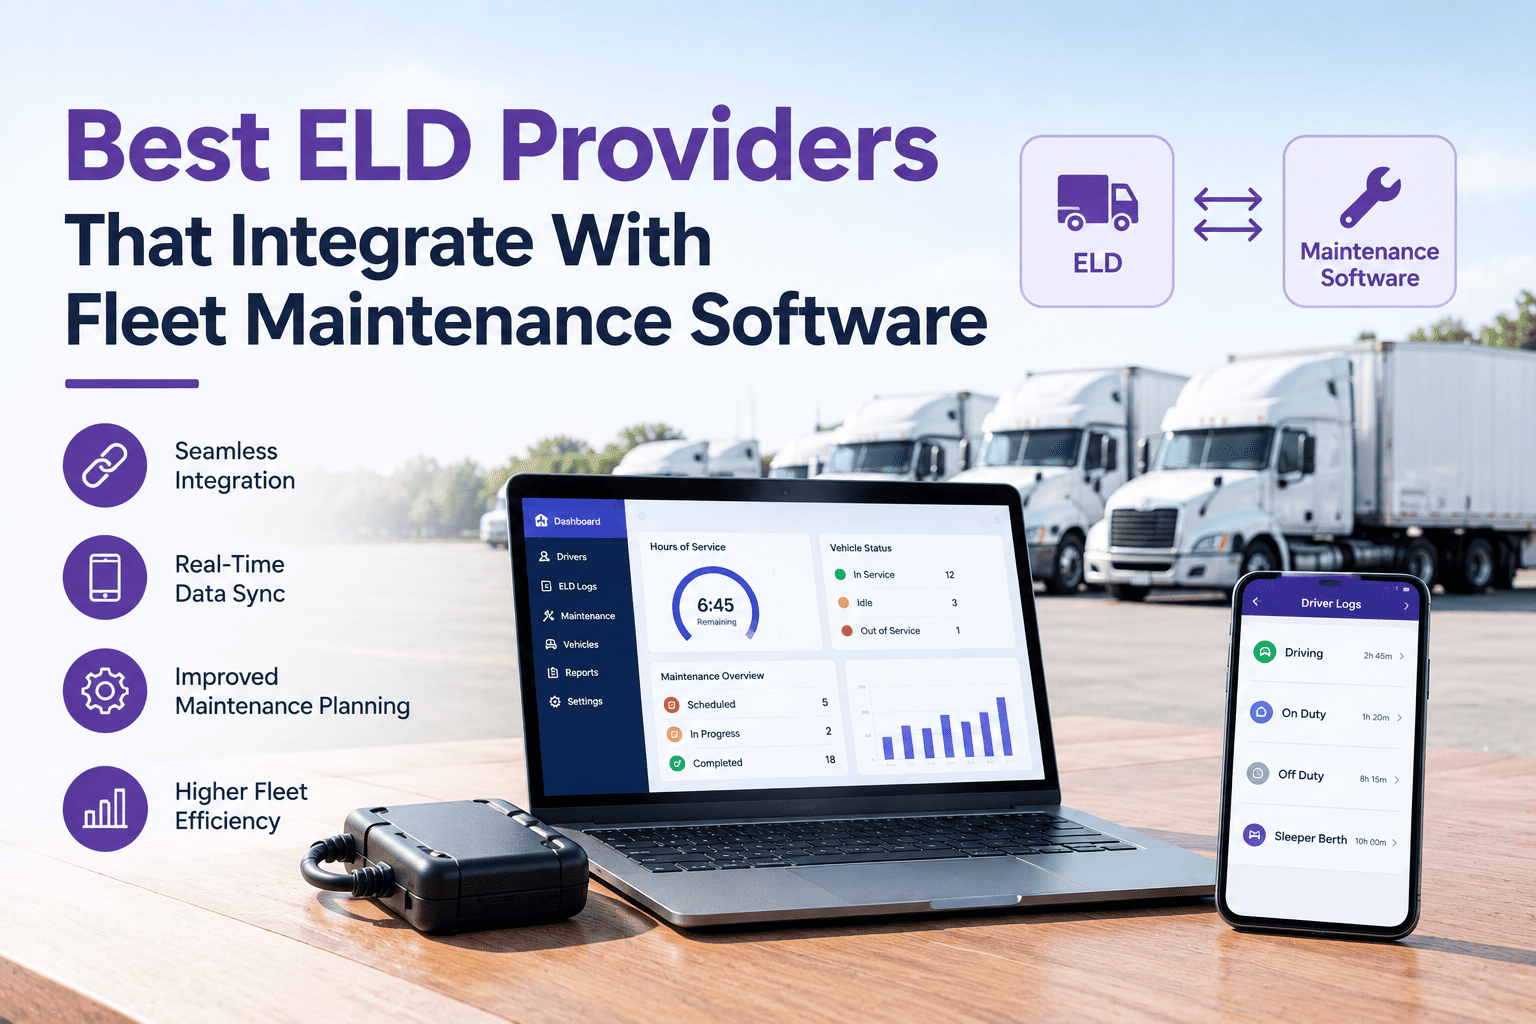
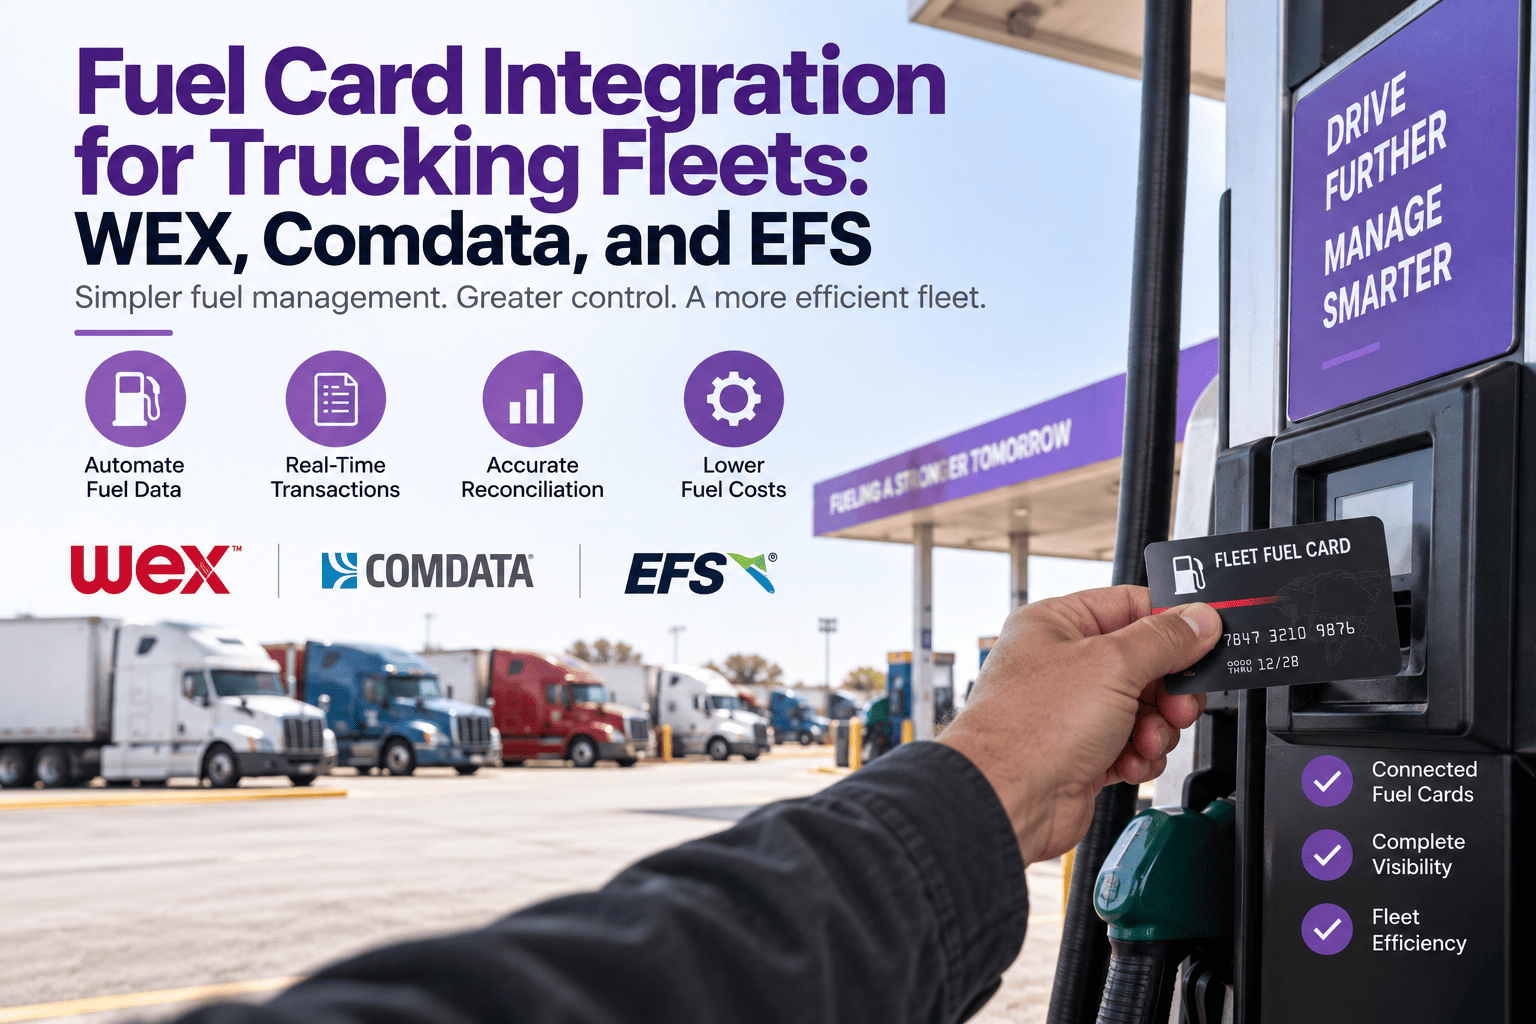
Ask five fleet managers their cost per mile and you'll get five different numbers not because their trucks cost different amounts to run, but because they're calculating from different data sets. Some pull fuel from the fuel-card portal and stop there. Some add labor from the shop system but forget parts. Some report on the trucks that fueled up this week and ignore the trucks that didn't. True CPM combines fuel and maintenance data on the same asset, over the same window, and gives you a number you can defend in a rate conversation with a shipper. Everything else is a partial answer. Start free and pull fuel and maintenance data into one CPM report.
Cost Per Mile · Fuel + Maintenance · Real Numbers
Calculate a Cost Per Mile You Can Actually Defend
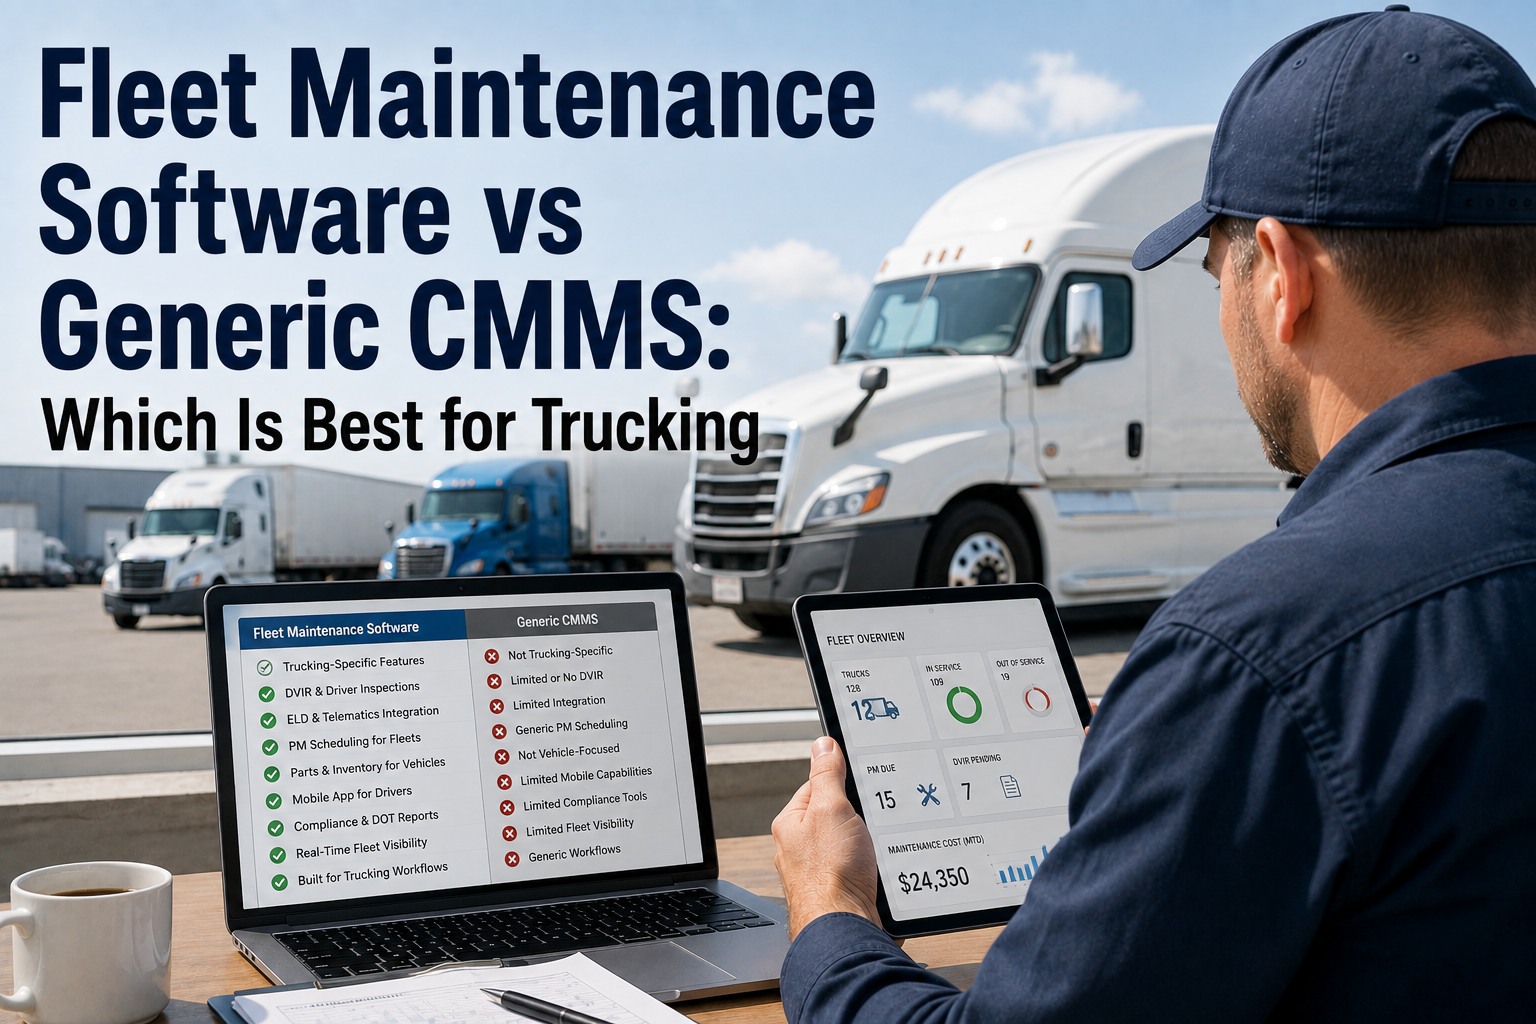
Most fleets track fuel CPM in one system and maintenance CPM in another and never add them up. Truck Inspection & Maintenance Management Software pulls fuel-card and shop data onto the same asset record, calculates true operating CPM per truck weekly, and gives you the number that drives rate-per-mile conversations and truck-by-truck retirement decisions.
2 streamsfuel + maintenance, one number
Per assetfleet averages hide the outliers
Weeklythe cadence CPM stays useful at
What "True CPM" Actually Means
CPM is only as useful as the completeness of the formula behind it. The most-quoted number in trucking is also the most-corrupted — fleets casually report "our CPM is $1.84" without saying whether that includes tires, whether it accounts for the truck that was in the shop for two weeks, or whether it uses the fuel a driver bought last month or the fuel that actually powered last month's miles. Getting the formula right is the whole game.
What this doesn't include True operating CPM stops at what it costs to run the truck. Fixed costs — insurance, licensing, depreciation, driver wages, dispatch overhead — belong in total CPM, calculated at the fleet level and usually monthly, not weekly. Mixing the two is the fastest way to make CPM meaningless. Track operating CPM per truck to make maintenance decisions; track total CPM at fleet level to price freight.
Why Fuel-Only or Maintenance-Only CPM Misleads
Half the picture is worse than none — a partial CPM lets fleets rationalize decisions the full number would kill. Three ways single-stream tracking goes wrong.
⛽
Fuel-only CPM
Fuel-card portal shows $0.58/mile. Truck looks efficient. Nobody sees the $0.24/mile in maintenance because that lives in the shop system — the truck is actually $0.82/mile and losing money on every haul.
Real risk: pricing freight below full cost
🔧
Maintenance-only CPM
Shop reports $0.19/mile in repairs. Fleet manager assumes the truck is a good performer. Fuel MPG has quietly dropped 8% due to a partly clogged aftertreatment — $0.06/mile in extra fuel nobody is watching.
Real risk: missing preventable degradation
📊
Fleet-average CPM
Fleet reports $1.04/mile average. Ten trucks in the fleet are at $0.92; two are at $1.68. The two outliers cost more to run than they earn per mile — but averaging hides them until someone asks the right question.
Real risk: keeping trucks that shouldn't be on the road
The Data Sources — And How to Unify Them
Every fleet already has the raw data. What they don't have is a way to key it together — fuel-card transactions in one system, work orders in another, mileage in a third. Unification is what turns three data sources into one number.
💳
Fuel-card data
- Transaction date, station, gallons, price
- Truck ID (unit number on card)
- Driver ID (some cards)
- Odometer entered by driver at pump (often wrong)
Source: WEX, Comdata, EFS, RTS, etc.
🔧
Maintenance data
- Work order date, asset, defect
- Parts consumed (line item cost)
- Labor hours × labor rate
- Vendor invoices for outsourced work
Source: maintenance / CMMS platform
📏
Mileage data
- Miles per asset per day
- Live from ELD or telematics
- Attributed to the asset, not the driver
- The denominator that ties everything else together
Source: ELD / GPS telematics
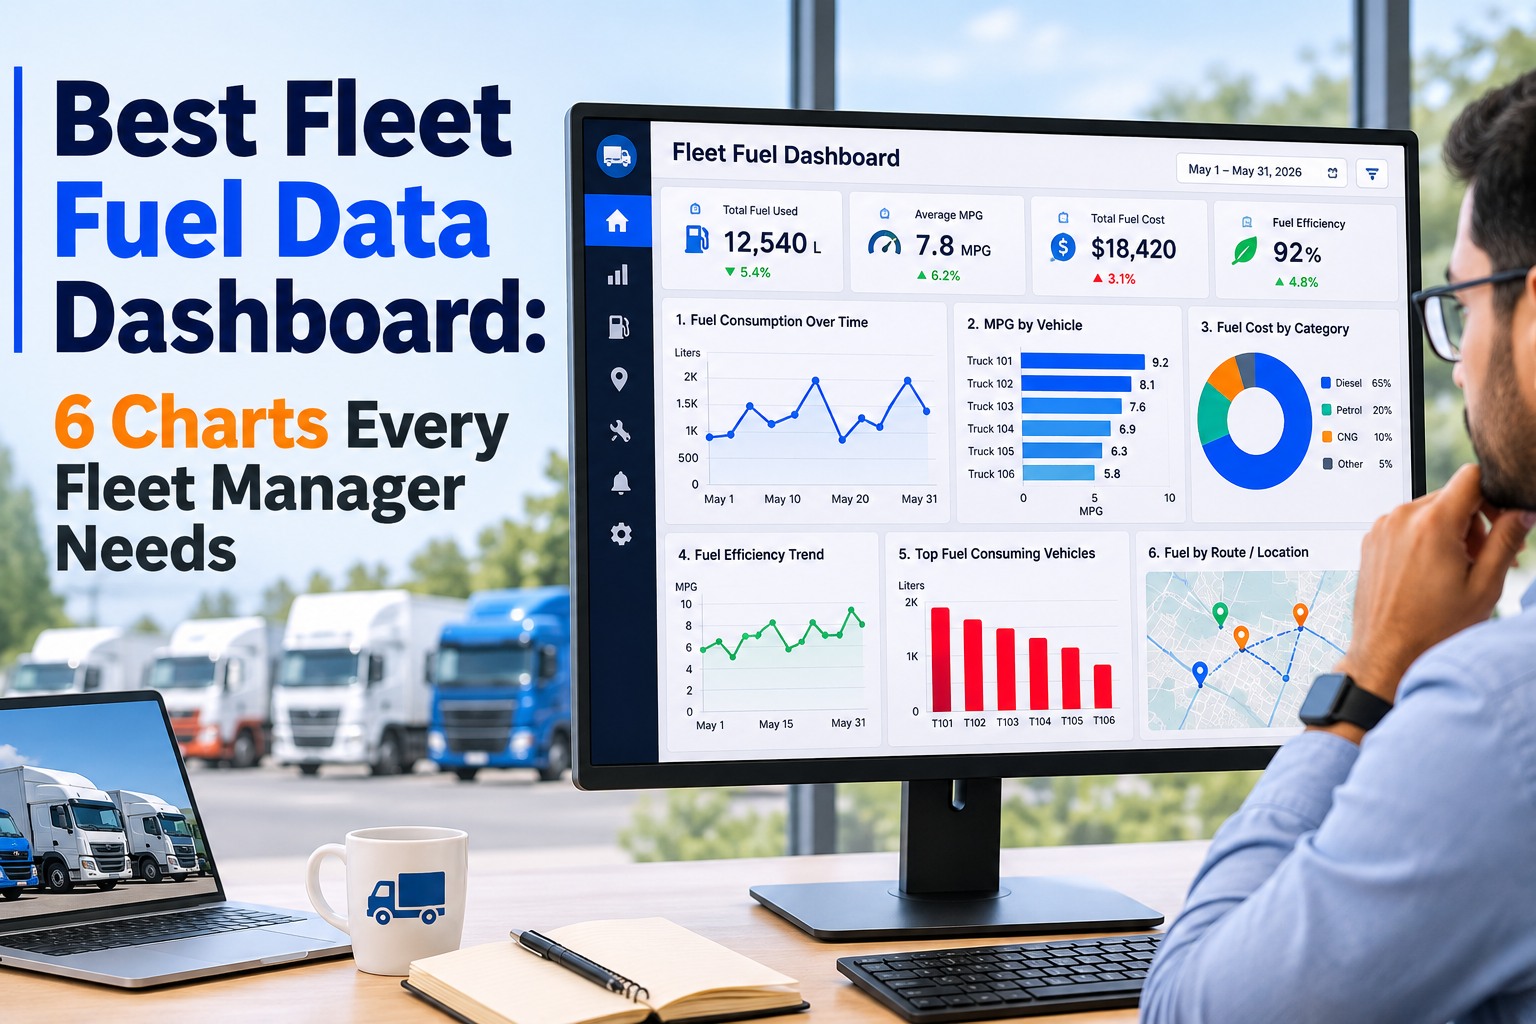
The CPM Dashboard — What Fleet Managers Actually Watch
A useful CPM view isn't a single number — it's a per-asset table sortable by outlier, with the drill-down that shows why a truck is high. Fleet managers who use CPM to make decisions look at it weekly, not quarterly.
Fleet Operating CPM · Week 37
Fleet avg $1.08/mi
| Asset | Miles | Fuel $/mi | Maint $/mi | Total CPM | vs Avg |
|---|
| T-2201 | 4,120 | $0.62 | $0.18 | $0.80 | −26% |
| T-2244 | 3,880 | $0.64 | $0.22 | $0.86 | −20% |
| T-2247 | 3,940 | $0.68 | $0.31 | $0.99 | −8% |
| T-3018 | 3,610 | $0.71 | $0.34 | $1.05 | −3% |
| T-3055 | 2,890 | $0.74 | $0.58 | $1.32 | +22% |
| T-3061 | 1,720 | $0.79 | $0.94 | $1.73 | +60% |
Reading the Numbers — What CPM Actually Tells You
A CPM table without interpretation is a spreadsheet, not a decision aid. Three patterns worth spotting, and what each one means for the fleet.
PATTERN 1
Fuel high, maintenance low
Truck burns more fuel than the fleet baseline. Cause is usually alignment, tire pressure, aftertreatment restriction, or driver behavior — investigate BEFORE the shop cost catches up. Cheapest to fix early.
PATTERN 2
Fuel normal, maintenance high
Truck is running efficiently but breaking often. Repeat-defect pattern likely; root-cause investigation needed. Maintenance spend running above $0.35/mile is a red flag on a long-haul asset.
PATTERN 3
Both high, miles dropping
The retirement candidate. Truck spent more time in the shop than on the road; both fuel efficiency and reliability are gone. Continuing to run costs more than replacing.
Fuel + Maintenance + Miles, One Per-Asset Number
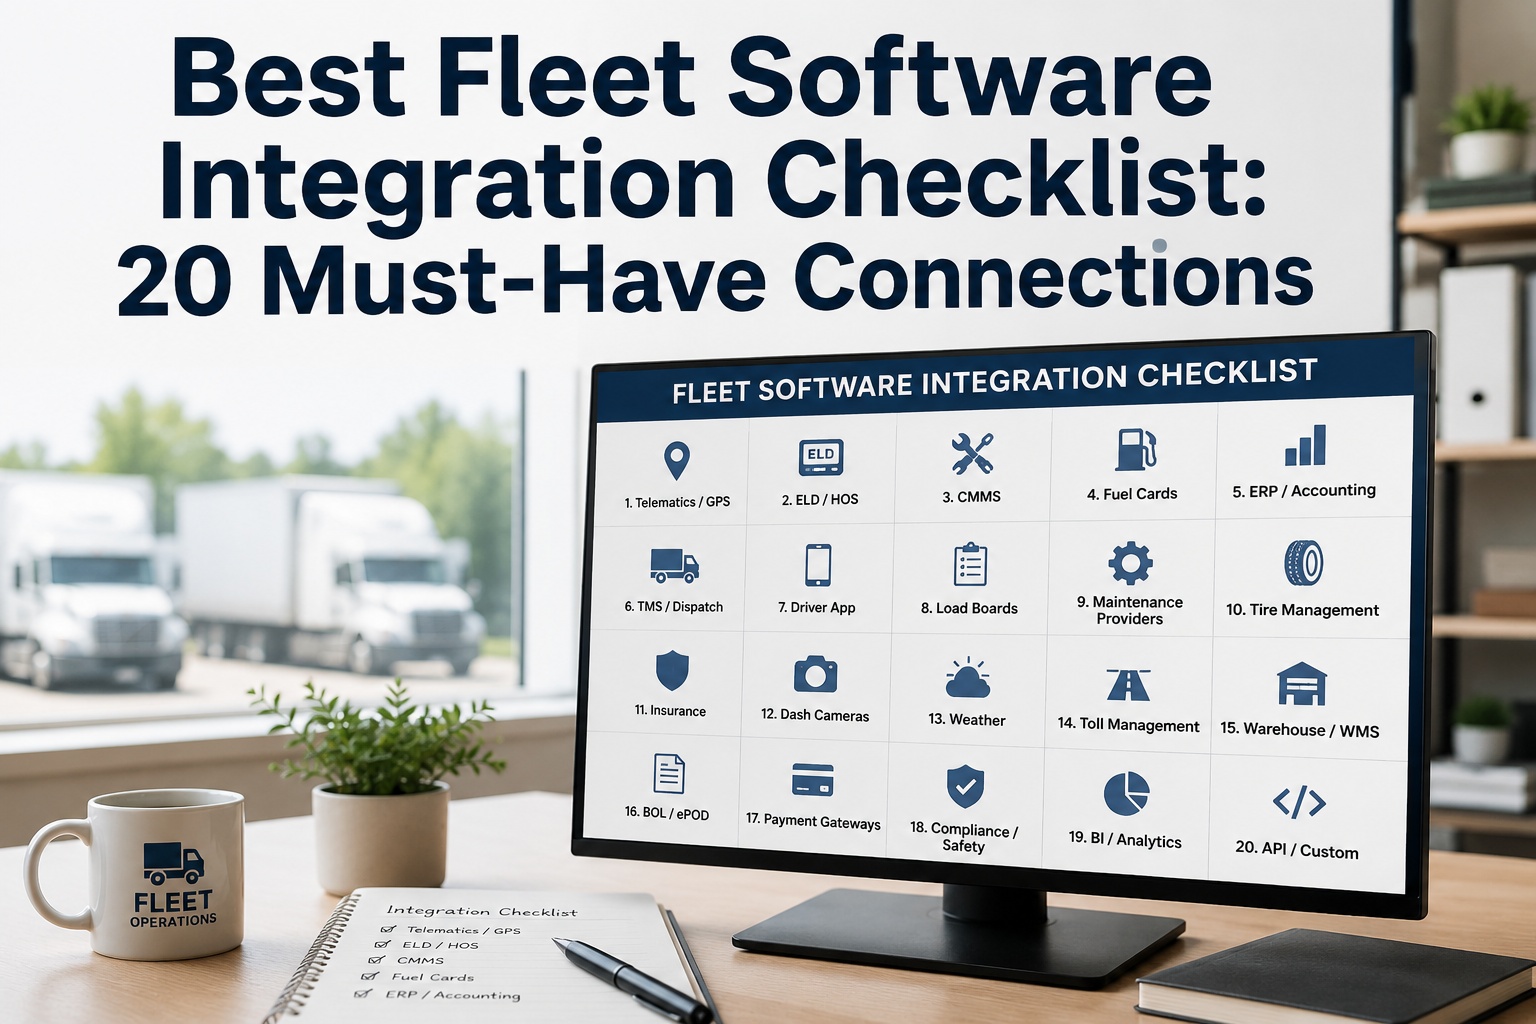
Truck Inspection & Maintenance Management Software integrates with major fuel-card providers (WEX, Comdata, EFS, RTS) and ELD/telematics feeds to combine fuel, maintenance parts, labor, and miles into a per-asset weekly CPM. Fleet managers see the outliers immediately, drill into fuel vs. maintenance split, and take retirement-vs-repair decisions off a defensible number instead of a fleet average.
The Retirement-vs-Repair Decision
The most valuable use of a per-asset CPM is the age-old fleet question: is this truck worth keeping? The answer isn't the truck's age or its total repair spend — it's the CPM trend against fleet baseline over the last 12 weeks.
KEEP
CPM within 15% of fleet avg
Truck is a normal performer. Continue running; monitor for drift.
WATCH
CPM 15-30% above fleet avg
Investigate the driver — fuel side; investigate repeat defects — maintenance side. Fixable in most cases.
REVIEW
CPM 30-50% above, 4+ weeks
Root-cause analysis; is this a fixable pattern or structural? Get repair-vs-replace quote from vendor. Decision within a month.
RETIRE
CPM 50%+ above, 8+ weeks, trending up
Structurally uneconomic. Retirement pays back inside a quarter on operating cost savings alone. Approve the replacement.
Common CPM Calculation Mistakes
Five mistakes that turn CPM from a decision aid into a number nobody trusts. Every one of them is fixable, and every one shows up in fleets that built their CPM report in a spreadsheet instead of a system.
01
Mismatched time windows
Fuel from this week's purchases (some for next week's driving) paired with this week's miles. The right way: match the fuel that powered the miles, using tank fills to bracket the window.
02
Missing outsourced repairs
In-house shop labor is tracked; the $2,400 tire replacement at a truck-stop is a vendor invoice sitting in accounting. Both belong in maintenance CPM.
03
Excluding low-mile weeks
A truck in the shop 3 days runs 800 miles and has a spike CPM. Excluding it flatters the average; including it exposes the real cost of a repair week.
04
Using rated MPG instead of actual
Some fleets compute fuel spend from mileage × EPA rated MPG × price. Actual fuel-card spend is what matters — the rated number ignores real-world load, route, and driver.
05
Forgetting DEF, tires, oil changes
DEF fluid, tire replacements, and scheduled fluid changes are consumables that some fleets accidentally park in "other" cost buckets. They're operating CPM — include them.
Frequently Asked Questions
What's a "good" CPM for a long-haul Class 8 tractor?
Industry benchmarks put operating CPM (fuel + maintenance + tires, no fixed costs) for a well-run long-haul fleet in the $0.85–1.10 range depending on region, fuel price, and truck age. Vocational or heavy-haul runs $1.20–1.60. Reefer adds $0.15–0.25 for the fueling and PM of the reefer unit itself. What matters more than the industry benchmark is your own fleet's baseline — a truck at $1.32 is a problem in a fleet averaging $1.05 and a normal performer in a fleet averaging $1.30. Track relative CPM against your own baseline, not published numbers.
Start free and benchmark against your own fleet
How often should CPM be calculated?
Weekly at asset level, monthly at fleet level. Weekly per-asset catches drift early — a truck creeping up on fuel or maintenance spend shows in 2-3 weeks of data, not one. Monthly fleet CPM smooths week-to-week noise and is the right cadence for rate conversations with shippers or for board-level reporting. Quarterly is too coarse to catch the fixable — by the time you see a bad quarter, the truck has already cost you the money. Our software runs the weekly per-asset roll and the monthly fleet roll automatically.
Contact us to set up your CPM cadence
Which fuel-card providers integrate with maintenance systems?
The major providers all expose transaction data via API or scheduled file feed — WEX, Comdata, EFS, RTS, Fleetcor. What varies is granularity. Some feed per-transaction detail with driver and asset attribution; others feed weekly summaries that need reconciliation against ELD odometer to attribute correctly. The right question to ask any fleet software vendor: which fuel-card providers are prebuilt, and do they attribute at asset level or driver level? Asset-level is what you need for CPM. Our software supports the major providers out of the box.
Start free and check your fuel-card provider
How should CPM change the way we price freight?
CPM is the floor, not the price. Fleet-level total CPM (operating + fixed costs) tells you what a mile costs to produce; the rate you charge has to clear that with margin. Where CPM gets useful in rate conversations is per-lane and per-customer analysis — if certain lanes force high-CPM trucks into service (short-haul, city runs on heavy-duty tractors), those lanes cost more to run and the rate needs to reflect it. Blended fleet CPM in shipper rate discussions is fine; but internally, per-asset CPM is what tells you which lanes are profitable and which are subsidizing others.
Contact us to build per-lane CPM into your rate model
Fuel + Maintenance + Miles · Per Asset · Weekly
Stop Guessing What Each Truck Actually Costs to Run
Truck Inspection & Maintenance Management Software integrates fuel-card, maintenance, and ELD/telematics data into a per-asset weekly cost per mile — showing outliers immediately, splitting fuel vs. maintenance drivers, and turning retirement-vs-repair conversations into decisions backed by numbers. Fleets use it to find the two trucks in every twenty that cost 60% more than average, catch fuel-efficiency drift before it becomes a repair, and price freight off a CPM they can defend.
No credit card required. Free for up to 3 trucks. Built for FMCSA-compliant fleets.