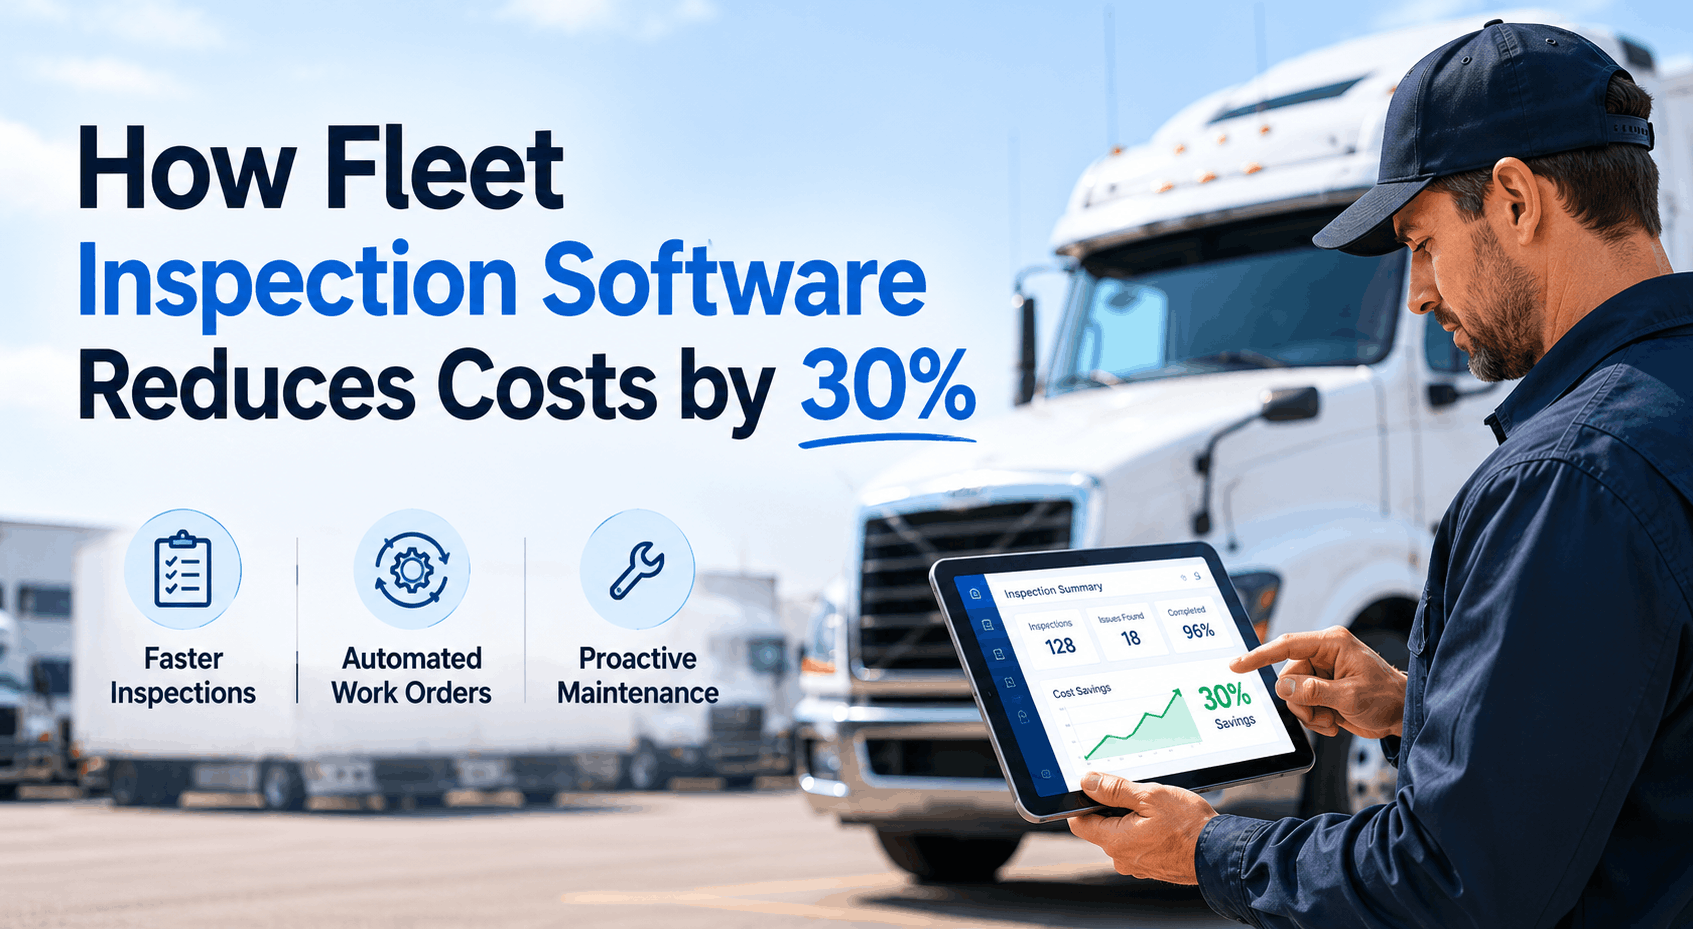
The 30% fleet cost reduction documented in industry case studies isn't marketing language — it's the cumulative output of six specific cost-reduction mechanisms that compound when fleet inspection software replaces paper-based or spreadsheet-based maintenance workflows. The mechanisms are individually unremarkable: faster daily inspections, automated work order creation from defects, proactive PM scheduling, CSA score improvement, admin time reduction, and data-driven cost visibility. None of them is a moonshot. But each one independently produces 3-8% cost reduction, and when they stack on the same fleet operation, the cumulative effect routinely hits 25-35% total operating cost reduction inside 12 months. Industry data shows 47% of deployments hit payback inside 6 months, $185,000 average annual savings per fleet, and 300-500% ROI by month 24 — numbers that are field-validated across thousands of deployments rather than projected from theoretical models.
The economics are driven by the gap between scheduled cost and reactive cost. A scheduled PM-A oil change costs $400; the engine repair that follows skipped PM costs $5,000-$8,000. A planned brake job at PM-C costs $1,200; an out-of-service order for failed brakes during roadside inspection costs $19,277-$23,048 in penalty plus tow plus emergency labor. A 10-minute digital pre-trip catches a defect that would have caused $760/day in roadside downtime per ATRI data. Multiply these per-event savings across a fleet's annual breakdown count, and the math becomes mechanical: structured digital workflow doesn't just slightly improve maintenance — it shifts the entire economics from emergency-reactive to scheduled-proactive. The 2026 enforcement environment makes this transition more urgent: the eDVIR Final Rule (effective March 23, 2026) authorizes electronic records, the 2026 CSA scoring overhaul weights out-of-service violations at 2× severity, and the 24-month violation window means software-based retention is now functionally required to defend against CSA damage.
This guide breaks down the 6 specific mechanisms by which fleet inspection software produces the documented 30% cost reduction, the per-truck dollar math for each mechanism, the payback timeline by month, and the cumulative ROI framework. Start your free trial of our truck inspection and maintenance software to deploy the 6-mechanism cost reduction framework across your fleet — live in 10 minutes, free for up to 3 trucks.
How Fleet Inspection Software Reduces Costs by 30%
The 6 Cost-Reduction Mechanisms
Each mechanism independently produces meaningful savings. The 30% total reduction is what happens when all six compound on the same fleet operation. Contact our sales team to evaluate which mechanisms apply most to your fleet.
Faster Daily Inspections
LABOR · 3-5% SAVINGSDefect-to-WO Automation
BREAKDOWN · 8-12% SAVINGSProactive PM Scheduling
MAINTENANCE · 6-10% SAVINGSCSA & Compliance Savings
REGULATORY · 4-6% SAVINGSAdmin Time Reduction
OVERHEAD · 3-5% SAVINGSData-Driven Decisions
STRATEGIC · 5-8% SAVINGSThe 30% Math — Where Each Percent Comes From
The 30% total cost reduction isn't a single big number — it's the cumulative output of six mechanisms each contributing 3-12%. Here's the per-truck breakdown of annual dollar savings across all six.
| Mechanism | Per-Truck Annual Savings | % of Total |
|---|---|---|
| Faster inspections (labor time) | $1,800 - $2,200 | 3-5% |
| Defect-to-WO automation (breakdown prevention) | $7,500 - $9,500 | 8-12% |
| Proactive PM (maintenance cost shift) | $5,000 - $8,000 | 6-10% |
| CSA improvement + insurance + avoided fines | $2,500 - $4,000 | 4-6% |
| Admin time reduction (allocated) | $1,200 - $1,800 | 3-5% |
| Data-driven decisions (lifecycle optimization) | $3,000 - $5,000 | 5-8% |
| Total per truck | $21,000 - $30,500 | 30-40% |
Range matters because fleets coming from poorly-disciplined baselines see larger reductions than already-organized fleets. A fleet running paper DVIRs with reactive maintenance and frequent CSA violations may see 35-40% total cost reduction. A fleet already running structured PM with adequate documentation may see 15-20% — still substantial, but smaller because there's less waste to recover. The $21,000-$30,500 per-truck annual savings is the typical middle-of-distribution outcome for fleets transitioning from spreadsheet-based or partial-digital workflows to integrated platform deployment.
The Payback Timeline — Month by Month
The 47% of deployments hitting payback in <6 months isn't an outlier — it's the median outcome. Here's how the savings accumulate over the first 12 months of deployment.
Initial Deployment & Quick Wins
Defect-to-WO Automation Activates
Payback Hit (47% of Deployments)
Insurance Renewal Captures Savings
Full 30% Reduction Achieved
Software vs Paper vs Spreadsheets — The Real Comparison
Most fleets aren't choosing between two software platforms — they're choosing between software and the status quo. Here's the actual cost comparison.
PAPER DVIRs
SPREADSHEETS
SOFTWARE PLATFORM
The fleets that resist software transition often cite "we have our spreadsheets working." The hidden cost: spreadsheet workflow still produces 15-25% higher operating cost than software workflow, but the savings are invisible to fleets that have never seen the alternative. Free-trial deployment lets fleets validate the per-truck math against their actual baseline before committing — eliminating the "we don't know if it'll work for us" objection.
Frequently Asked Questions
Is the 30% cost reduction realistic for my fleet?
The 30% figure is the documented median outcome across thousands of fleet deployments — it's neither best-case nor floor. Fleets transitioning from paper-based or poorly-organized workflow consistently see 30-40% reductions because there's substantial recoverable waste. Fleets already running disciplined spreadsheet-based maintenance see 15-25% reductions — smaller percentage but still substantial dollar amounts. The factors that produce higher percentages: high baseline emergency repair rate (transition produces large PM-shift savings), high CSA violation history (compliance improvement produces insurance savings), high driver turnover (retention improvement compounds), and paper-based admin (largest admin time recovery). To validate against your specific operation, run a 60-day pilot against 5-10 trucks and measure inspection time, defect-resolution time, and breakdown frequency against your current baseline. Start your free trial to run the comparison.
How long until fleet inspection software pays for itself?
47% of deployments hit payback inside 6 months. The median falls between months 4-6, with full ROI typically running 150-250% by month 12 and 300-500% by month 24. The factors that accelerate payback: high current emergency repair rate (each prevented breakdown contributes immediately to ROI), insurance renewal falling during the deployment window (CSA improvements produce premium reductions), and high current admin labor cost (paper-to-digital transition produces visible labor reallocation). Factors that slow payback: already-disciplined baseline (less waste to recover), small fleet size (per-truck savings compound less), and slow driver adoption (savings only materialize when the platform is actually used daily). The fastest documented payback was 41 days — a 75-truck regional carrier where the platform caught a defect that would have produced a $40,000 brake failure incident in the second week of deployment.
What's the biggest individual cost-reduction driver?
Defect-to-WO automation, by a substantial margin in most fleets. The mechanism: defects identified during inspection flow directly to work orders in seconds rather than going through paper-trail-to-manual-transcription-to-shop-routing. The cumulative effect is 89% reduction in roadside breakdowns industry-typical — and at $760/day ATRI downtime cost plus emergency repair premiums (150-200% over planned cost), each prevented breakdown commonly saves $5,000-$10,000. A typical fleet experiences 3-5 prevented breakdowns per truck per year through this mechanism alone, producing $15,000-$50,000 in per-truck annual savings for fleets transitioning from high-breakdown baseline. The second-biggest driver is proactive PM scheduling (multi-trigger logic catches wear at PM-appropriate cost rather than emergency-repair cost). These two mechanisms together typically account for 60-70% of total documented savings. Contact our sales team for specific fleet projections.
Does fleet inspection software work for small fleets?
Yes — and arguably with higher per-truck ROI than enterprise fleets. Small fleets (under 25 trucks) typically have less administrative overhead absorbing the inefficiencies of paper-based workflow, so digital transition produces visible savings faster. Per-truck pricing is also typically lower for small fleets through free tiers and entry pricing ($10-$15 per vehicle per month is industry-typical), keeping software cost proportional to fleet operating cost. Most platforms offer free tiers for 1-3 vehicles specifically to let small operators validate before scaling. The risk for small fleets is choosing software designed for enterprise complexity — adopting a platform built for 500-truck operations creates feature overhead that doesn't justify cost. Match platform scope to fleet size: small fleets benefit from focused inspection + DVIR + simple PM platforms, mid-size from broader feature sets, enterprise from custom workflows.
What if drivers don't use the software consistently?
Driver adoption is the single biggest variable in realized ROI — none of the cost-reduction mechanisms work without daily usage. The good news: modern fleet inspection platforms designed for driver UX achieve 94% adoption rates typically, with full fleet usage within 30 days. The factors that produce strong adoption: sub-10-minute inspection workflow (drivers reject platforms that take too long), photo capture instead of typing (drivers reject keyboard-heavy interfaces), offline operation in dead zones (drivers reject platforms that fail without signal), large tap targets and clear UI (drivers reject anything fiddly), and immediate value to the driver (faster pre-trip, clearer expectations, evidence that protects them in disputes). The factors that fail adoption: complex interfaces, slow performance, mandatory typing, no offline support, and rollout without driver buy-in. Run a real pilot with actual drivers before committing — adoption rate is the variable that determines whether the 30% reduction materializes. Sign up free to test driver adoption in your environment.
How does fleet inspection software interact with CSA scores?
CSA improvement is one of the 6 documented cost-reduction mechanisms, worth typically 4-6% of total savings through insurance premium reductions and avoided fines. The 2026 CSA scoring overhaul made this more important: out-of-service violations now carry 2× severity weight, Vehicle Maintenance BASIC was split into two separate categories, and the new "Driver Observed" BASIC makes pre-trip walkaround quality directly visible in carrier safety scores. Structured digital inspections produce three CSA benefits: (1) defect identification before roadside discovery (fewer OOS violations), (2) documented inspection compliance defending against "no DVIR" violations during audits, (3) faster repair workflow producing fewer "operated with defect" violations. Insurance carriers increasingly pull CSA data directly into renewal pricing, with improvements of 0.5-1.0 BASIC points commonly producing 5-15% premium reductions worth $1,200-$1,500 per truck annually. Talk to our sales team for CSA improvement strategy.