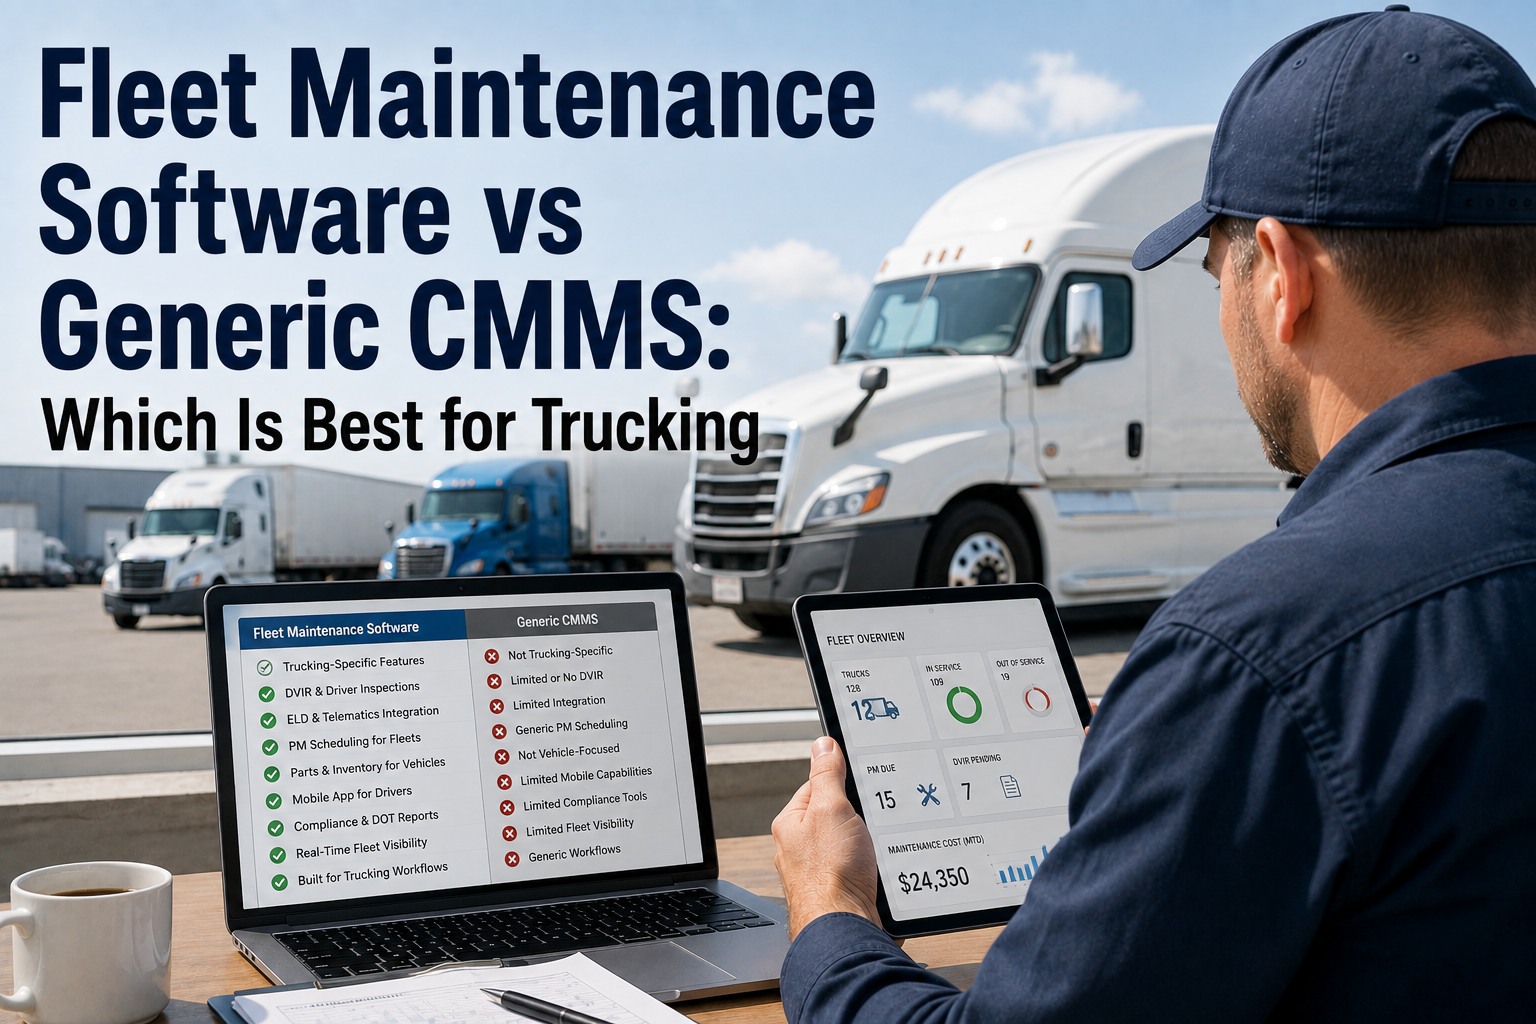
A truck that isn't rolling isn't earning — and downtime rarely disappears in one big block. It leaks out in dozens of small handoffs: a DVIR that sits in an inbox, a defect sent to the shop as three words, a PM that comes due while the truck is already parked. Truck Inspection & Maintenance Management Software closes those leaks by turning every inspection into a routed work order the moment it's filed. Start free and tighten your uptime loop.
Fleet Uptime · Inspection → Work Order
Every Hour a Truck Waits on Paperwork Is an Hour You Never Booked
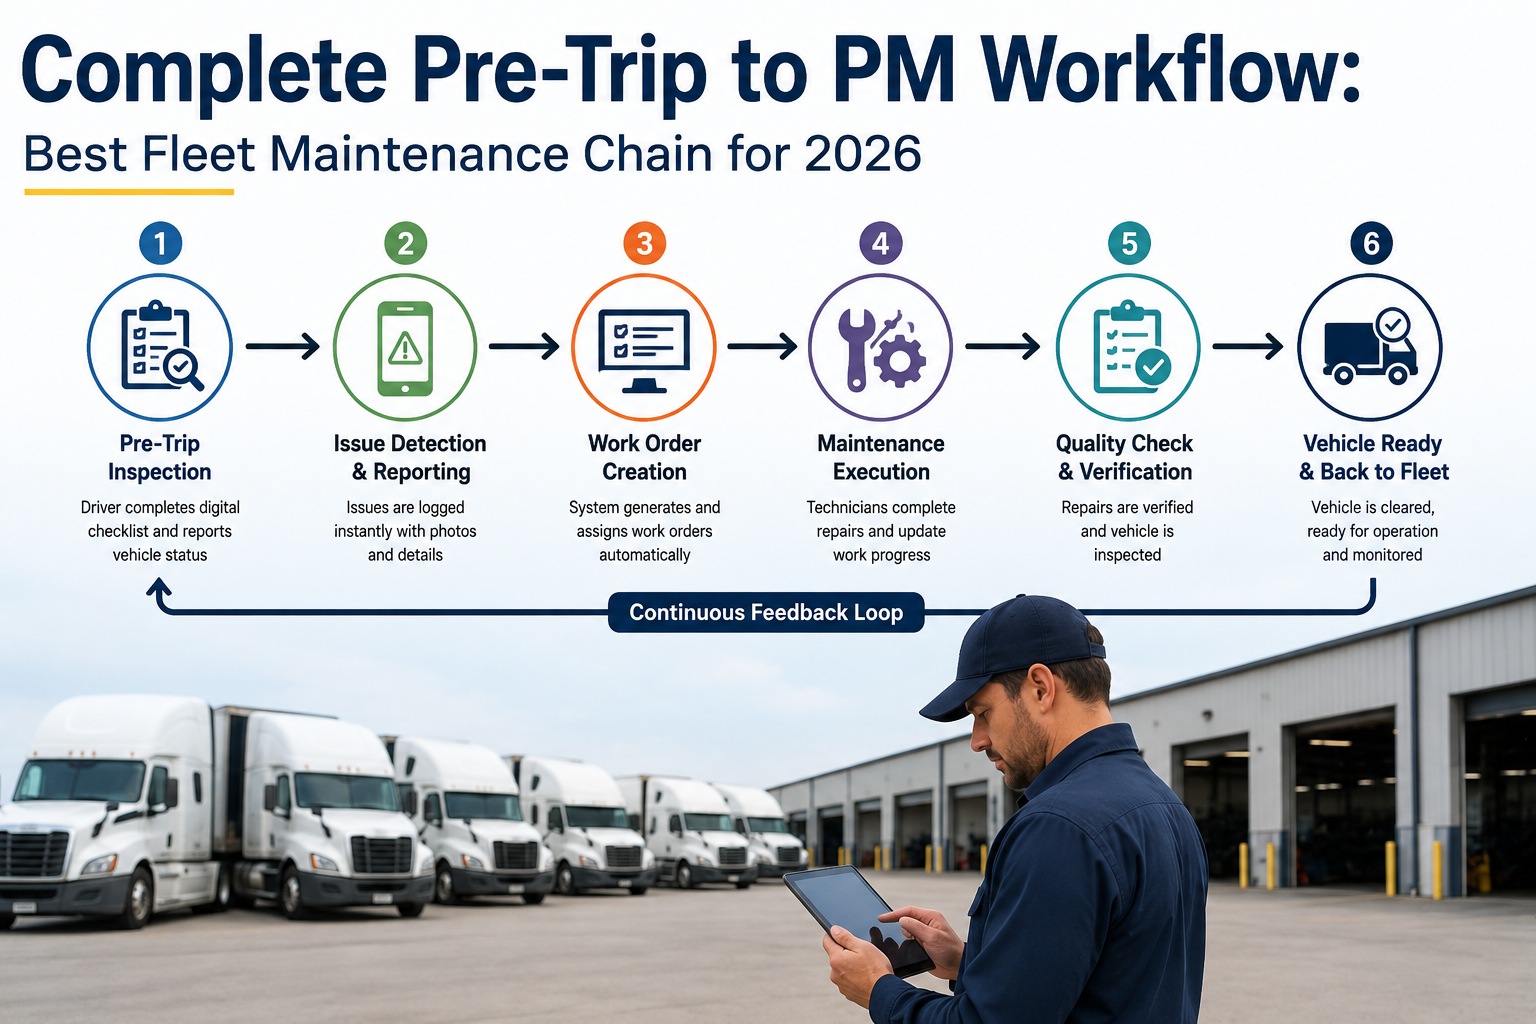
Top-quartile fleets run at 96% availability; the industry average sits at 89%. The gap isn't equipment — it's the loop between what a driver flags and what a shop does. Truck Inspection & Maintenance Management Software runs that loop end-to-end: guided DVIR → auto-graded defect → routed work order → PM merged → signed eDVIR. Your first uptime KPI moves in week one.
96%top-quartile fleet uptime
89%industry-average availability
440hlost per year, per 1% below 92% (50-unit fleet)
The Uptime Equation — Where the Hours Go
Fleet availability is one number that hides two. Split it, and the fixable half becomes obvious.
Uptime hours
Hours a truck is ready to dispatch. Counted live on our dashboard from every eDVIR filed.
Downtime hours
Planned PM + breakdowns + diagnosis + waiting-on-parts + waiting-on-a-signature. We split each one so you can see what's fixable.
The trap: most fleets track downtime as one number and never separate "planned" from "waiting." The waiting portion is what our inspection-to-work-order flow eliminates.
Where Uptime Leaks Out Without an Integrated Loop
Downtime doesn't announce itself — it accumulates in small handoffs. Every leak below is a place our software plugs by design.
Inspection Data In
100 hrs of DVIR + defect data this week
−4h
DVIR sits in an inbox
Paper or unrouted mobile — the shop sees it hours late. Our software pushes it live on submit.
−6h
Defect gets re-typed
A dispatcher opens the WO by hand and loses detail. Our platform auto-generates it intact.
−9h
Diagnosis in the bay
A vague line makes the mechanic start from scratch. Our photo-attached defects stage the right part before arrival.
−7h
PM windows collide
Repair and PM come due the same week. Our scheduler combines them into one bay slot.
Uptime Hours Out
74 hrs delivered · 26 hrs leaked
The 7 KPIs Our Software Moves
Uptime is a lagging indicator. The leading indicators below predict next quarter's availability — and every one is generated live inside our software, no spreadsheets.
01
PM Compliance %
PM on time ÷ PM scheduled × 100
Top ≥95%Avg 61%
Strongest predictor of next-quarter availability. Our scheduler fires the WO at the trigger.
02
Vehicle Availability %
Available hours ÷ Scheduled hours × 100
Top ≥96%Avg 89%
The headline number. Our live dashboard rolls it up across every terminal in real time.
03
MTBF
Operating hours ÷ Failures
Top 600+ hrsAvg 450 hrs
Rising = PM working. Our repeat-defect flag catches drifting components early.
04
MTTR
Repair time ÷ Repairs
Top ≤3 hrsAvg 6 hrs
Shop efficiency. Our photo-attached, pre-graded WOs cut diagnosis to near zero.
05
Planned : Reactive
Planned WOs ÷ Total WOs × 100
Top ≥80%<60% = reactive
Reactive culture = 3× repair cost. Our software tags every WO at open time.
06
First-Time Fix Rate
First-visit fixes ÷ Total repairs × 100
Top ≥85%Target 80%
Every repeat visit doubles downtime. Full repair history + photos land with the WO.
07
DVIR-to-WO Cycle Time
Defect flag → WO opened
Top <15 minManual: hours-days
The KPI most managers miss — and the one that unlocks the other six. Ours drops it under a minute.
Integration on One Shift — Same Defect, Two Systems
The test of "integration" is what happens between 6:14 AM and truck-released. Same defect, minute by minute.
DisconnectedPaper + email + spreadsheet
06:14Driver notes "air leak near LR axle" on paper
09:30Shift manager retypes into email to shop
11:45Shop opens WO manually
14:00Mechanic starts diagnosis from scratch
15:20Wrong part on hand; new order placed
Wed AMReleased — ~24 hrs down
IntegratedTruck Inspection & Maintenance Software
06:14Driver flags LR chamber, attaches photo
06:15WO opens auto-graded P2 schedulable
06:22Shop lead pulls Type-30 chamber from stock
10:00Truck arrives at pre-booked bay slot
11:15eDVIR closed with before/after photos
11:30Released — ~5 hrs down
Every Handoff Costs You Hours You Never Booked
Our software turns the driver's DVIR into a graded work order the instant it's logged — staging parts, bay time, and mechanic before the truck moves. Fleets use it to close the gap between 89% and 96% availability without adding a mechanic or a bay.
The Four Habits Our Software Enforces
The gap between average and top-quartile isn't equipment — it's four disciplines top performers run every week. Our platform makes each one automatic.
Habit 01
Every DVIR is graded at log-time
Our software auto-classifies OOS vs schedulable. OOS locks the truck; schedulable routes to the PM queue.
Habit 02
Repeat defects flagged by pattern
Our engine spots the third wheel-seal on the same axle in 30 days and opens a root-cause WO — automatically.
Habit 03
PM + repair share one bay slot
Our scheduler checks for PM due in the next 14 days and combines it with the repair. One trip, not two.
Habit 04
Weekly KPI review in 15 minutes
All seven KPIs live on our dashboard. If a number moves, it's visible before the week is over.
The 30-Day Uptime Recovery Path
Most recoverable hours are lost to workflow gaps, not equipment — so the first 30 days on our software is where the biggest gains happen.
1
Week 1
Baseline & digitize DVIRs
Drivers file pre- and post-trip in our app. Availability, MTTR, and cycle time baseline in the dashboard.
2
Week 2
Auto-grading + photo defects live
Our software takes over classification. Photos land in the shop queue. Cycle time drops to minutes.
3
Week 3
PM + repair bay-merging on
Our scheduler combines shop visits. Planned-to-reactive ratio climbs. PM compliance visible.
4
Week 4
First 15-minute KPI review
Seven KPIs reviewed live. Repeat-defect flags surface chronic components. Availability trend above baseline.
Frequently Asked Questions
Where's the biggest uptime gain — better mechanics or better workflow?
Workflow, almost every time. Top-quartile mechanics aren't faster — they spend 55–65% of their shift on wrench time versus 30–40% at average fleets. The gap is diagnosis, parts-hunting, and admin. Our software cuts all three: live photos, auto-generated WOs, repeat-defect flags.
Start free and see your first wrench-time gain
Availability vs utilization — which one should I track?
Both. Availability = what percent of your fleet is ready to work (maintenance question). Utilization = what percent of available trucks are assigned a load (dispatch question). This page is about availability — the one our inspection-to-work-order loop directly controls.
Contact us to map both for your fleet
We have telematics — doesn't that solve uptime?
Telematics tells you where the truck is and what its ECM reports. It doesn't tell you whether a driver-flagged defect has been graded or a WO opened. Those are workflow questions our software answers. Run both side by side — they don't overlap.
Start free and layer our software on your telematics
How fast does availability actually move?
DVIR-to-WO cycle time drops from hours to minutes in week one — visible on the dashboard immediately. Availability moves in weeks 3–4 as combined bay slots pull redundant visits out, with a clearer trend by month 2–3. The 89%→96% gap typically closes over 6–12 months.
Contact us to set a 90-day uptime target
Close The Loop · Reclaim The Hours · Move The Number
Turn Every Inspection Into an Uptime Decision
Truck Inspection & Maintenance Management Software connects DVIR to a graded, routed work order in one flow — so all seven KPIs that predict availability move together, week over week.
No credit card required. Free for up to 3 trucks.