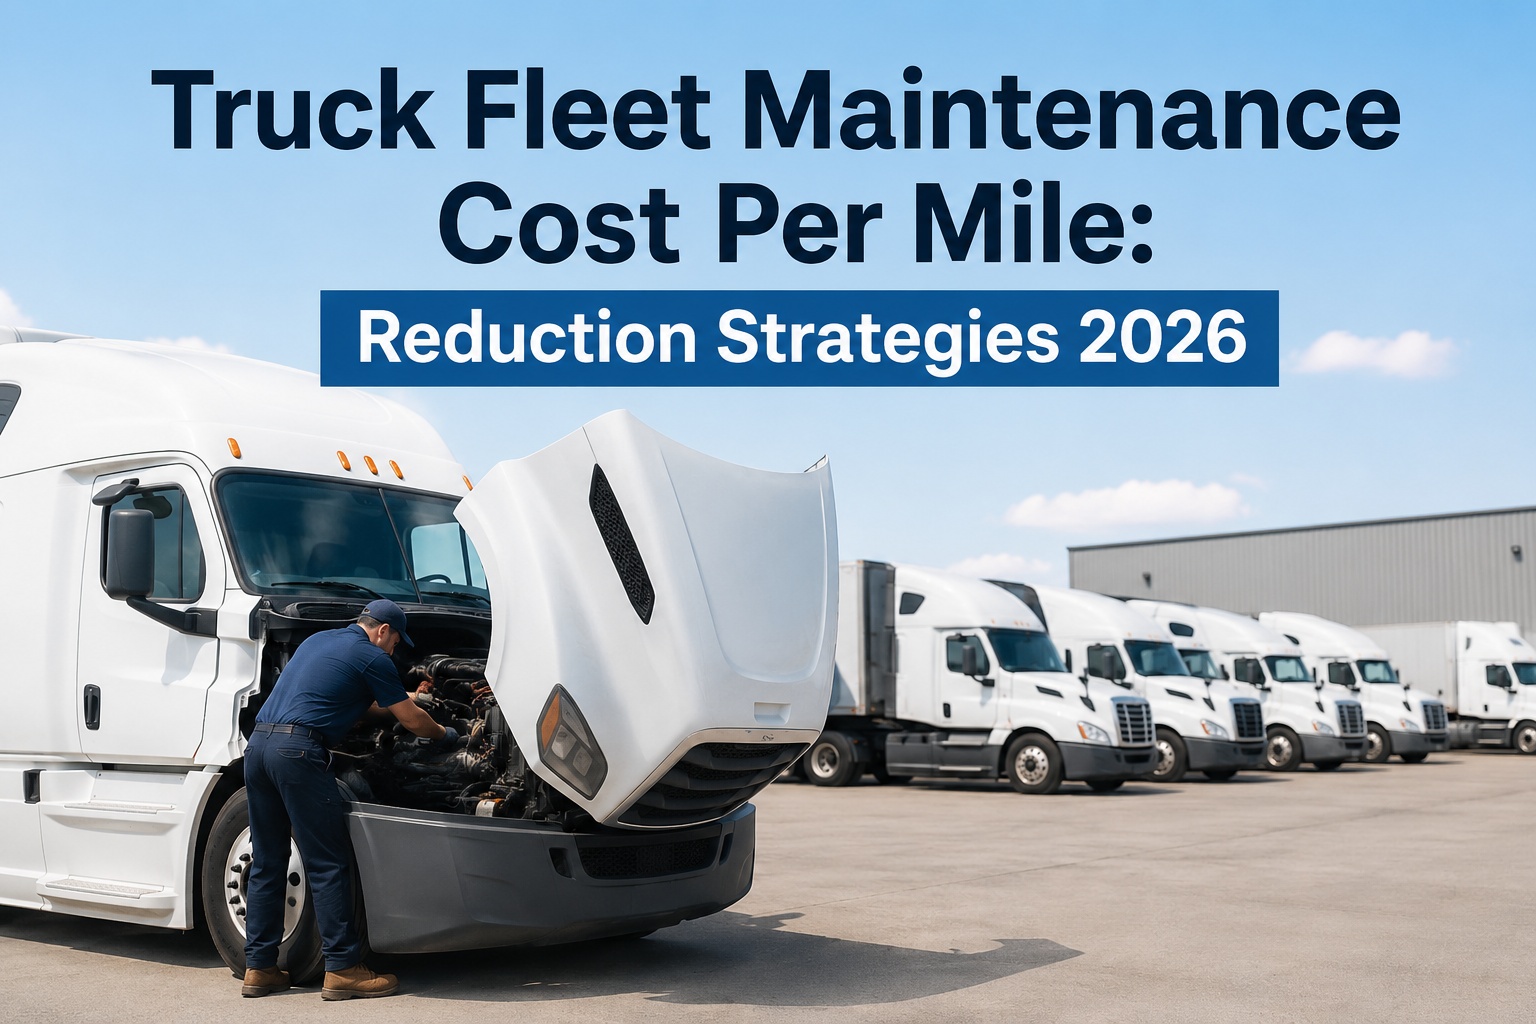
Two fleets running identical trucks on identical routes can have maintenance cost per mile gaps of 60% or more — one fleet at $0.18 per mile, the other at $0.30 or above. Industry data from the American Transportation Research Institute puts the 2026 average maintenance CPM at $0.202 ($16,192 per heavy-duty truck annually), with top-quartile fleets achieving $0.12-$0.18 while bottom-quartile fleets exceed $0.30. The gap isn't talent, luck, or fleet age — it's visibility. Top-quartile fleets know their cost per mile per vehicle, their reactive-vs-planned ratio, their defect-to-repair time, and their PM compliance rate. They run less than 20% reactive maintenance while the industry average sits at 45%. They catch the highest-cost outlier vehicles in days, not quarters. This guide breaks down exactly where the dollars go, the five cost levers you can pull, and the 2026 benchmarks every fleet should be measured against. Talk to our team for a CPM analysis on your fleet.
Where You Stand — The 2026 CPM Benchmark
Most fleet managers know their total maintenance number. Almost none know whether it's competitive. Use this benchmark table to find out exactly where your fleet sits and what the gap to top-quartile actually costs you:
The math is brutal: a 100-truck fleet at $0.30/mile vs $0.20/mile, running 80,000 miles per vehicle annually, leaks $800,000 in maintenance waste every year from the same roads, fuel prices, and labor market.
Where the CPM Dollars Actually Go
Knowing your CPM is one thing. Knowing where each dollar flows is another — and it's the prerequisite to cutting any of it. Here's the typical breakdown of a $0.202/mile maintenance cost on a heavy-duty truck:
Brakes, tires, filters, fluids, structural hardware. Up 3.7% YoY through Q4 2025; tariff pressure on steel and aluminum compounds the climb.
In-house techs at $45-$75/hour; outsourced labor runs $125-$175/hour. The biggest hidden lever — most fleets pay more for labor than they realize.
ATRI clocks tires at 4.7 cents per mile alone. Tread pattern matching, casing quality, retread strategy, and TPMS adoption directly move this number.
Specialty repairs (alignments, transmissions, emissions), mobile services, towing. Higher for fleets without in-house shops.
Lost revenue per breakdown day ($448-$760), admin overhead, expedited parts shipping (3-5x base cost), schedule disruption ripple effects.
The 5 Cost Levers That Close the Gap
The 60-150% CPM gap between top and bottom quartile fleets comes from five specific operational levers. Each one is measurable, each is fixable, and each contributes a quantifiable percentage to the total cost gap:
Shift Reactive to Planned Maintenance
The single most powerful CPM lever. Every 10% shift from reactive to planned cuts total maintenance costs 15-20% because reactive repairs cost 3-9x more than the same job done proactively. Bottom-quartile fleets run 55%+ reactive; top-quartile fleets stay under 20%.
Optimize Parts Procurement & Inventory
Bulk purchasing reduces per-unit cost 15-25% on commodity items (filters, fluids, hardware). Fixed-pricing agreements with primary vendors for 6-12 month terms hedge against tariff-driven price increases on steel and aluminum components.
Tire Strategy & TPMS
Tires alone account for 23% of maintenance CPM. Proper inflation extends life 25%+; tread pattern matched to application reduces wear; quality casings enable 2-3 retread cycles cutting replacement cost in half. Only 25-30% of tractors and 15% of trailers run TPMS today — significant gap for adoption.
Time Vehicle Replacements by CPM
Vehicles over 10 years old cost 5.5x more per mile than vehicles under 5. They account for only 12% of miles driven but 33.5% of total maintenance spend. Replace by CPM-trend, not by odometer or hunch. Annual maintenance exceeding 40-45% of fair market value is the standard replacement trigger.
In-House vs Outsource Mix
LTL carriers doing 78% of maintenance in-house pay $45-$75/hour in labor; fleets outsourcing the same work pay $125-$175/hour. For routine PM, alignments, and brakes, in-house typically wins on cost. For specialty (transmissions, emissions, diagnostics), outsourcing can be cheaper than equipping for low-volume work.
Calculate your CPM. See exactly where the leaks are.
Truck Inspection & Maintenance auto-calculates cost per mile, reactive-vs-planned ratio, PM compliance, and per-vehicle profitability from every work order. No spreadsheets, no manual entry. Benchmarked against 2026 ATRI standards. Sign up free to see your first dashboard in 10 minutes.
The Compound Cost of Deferring PM
Every PM deferred has a downstream cost — and the downstream cost is always larger. Here's what happens when fleets push routine maintenance past its trigger:
Industry rule of thumb: every $1 in deferred PM compounds to $4-$8 in unplanned repair within 12-18 months. Fleets running structured PM programs see 70-85% breakdown reduction within the first year.
The 6 KPIs Every Fleet Should Track Monthly
You can't cut what you can't see. These six metrics give you the biggest CPM visibility for the effort invested. Track them monthly per vehicle and per fleet — patterns surface within 60-90 days:
Total maintenance cost divided by miles driven. Rising CPM on a specific vehicle is the earliest replacement-timing signal.
The most revealing metric of program maturity. Every 10% shift toward planned saves 15-20% of total cost.
PMs completed within 10% of scheduled interval. Improving from 70% to 95% typically cuts breakdowns 50%.
Mean time between failures + mean time to repair. Declining MTBF on a unit signals impending replacement need.
Calculated as MTBF / (MTBF + MTTR). Below 90% means reliability problems are eating margin invisibly.
Track planned vs reactive separately. If costs are similar, your PM isn't preventing the expensive failures it should.
The 90-Day CPM Reduction Roadmap
A structured rollout cuts CPM 15-25% within one quarter. Skip the consultant playbook — this is the field-tested 4-phase approach that fleets actually use:
Baseline Visibility
Deploy CMMS. Auto-import telematics mileage. Categorize all current maintenance spend by vehicle, work order type, and reactive vs planned. By day 14, you know your starting CPM per vehicle.
PM Discipline
Implement multi-trigger PM scheduling. Connect DVIRs to maintenance workflow. Train technicians on standardized checklists. By day 45, reactive ratio should drop 10-15 percentage points.
Parts & Labor Optimization
Negotiate vendor contracts. Move routine PM in-house. Standardize tire selection. Implement TPMS on top-mileage trucks. By day 75, parts and labor CPM components show measurable drop.
Replacement Decisions
Identify top 10% CPM outlier vehicles. Run replacement-vs-repair analysis on each. Build a 6-month replacement queue. By day 90, CPM should be down 15-25% with clear path to top-quartile.
Frequently Asked Questions
What's a good fleet maintenance cost per mile in 2026?
The 2026 ATRI industry average is $0.202 per mile, representing 8.9% of total operating costs. Top-quartile fleets achieve $0.12-$0.18 per mile through structured PM programs and digital tracking. Bottom-quartile fleets exceed $0.30. If your fleet is above $0.25/mile, significant optimization opportunity exists — typically 25-35% reduction is achievable within 12 months.
How much do reactive repairs really cost vs planned maintenance?
Reactive repairs cost 3-9x more than the same job done proactively. A scheduled oil analysis at $800-$1,500 prevents a reactive engine failure at $15,000-$35,000. Every 10% shift from reactive to planned cuts total maintenance costs 15-20%. Industry average is 45% reactive; top-quartile fleets stay under 20%. Contact our specialists to map your current reactive-vs-planned ratio.
When should I replace a truck instead of continuing to repair it?
When annual maintenance cost exceeds 40-45% of the vehicle's current fair market value. For most U.S. commercial vehicles, this occurs between years 6-8 or 400,000-600,000 miles. Include downtime cost in the calculation — a truck that costs $8,000/year in repairs but is down 45 days for those repairs costs $30,000+ in total impact. Vehicles over 10 years old cost 5.5x more per mile than vehicles under 5.
What percentage of maintenance should be planned vs reactive?
Top-performing fleets run less than 20% reactive maintenance. Industry average sits at 45%. The gap is almost entirely a function of program discipline: PM compliance rate, DVIR-to-work-order automation, telematics integration, and predictive analytics on high-failure components. Sign up free to see your reactive ratio surfaced on day one.
How quickly will I see CPM reduction from a software rollout?
Measurable reduction within 60-90 days; full annual impact typically compounds over 6-12 months. Phase 1 (visibility) takes 14 days. Phase 2 (PM discipline) shows reactive-ratio drops within 30-45 days. By day 90, structured fleets see 15-25% CPM reduction. The first prevented breakdown often pays for several months of software cost — typical ROI in under 6 months.
Can software really cut my CPM by 25%?
The software itself doesn't cut anything. What it cuts is the invisibility — the 30%+ of triggers spreadsheet-based fleets miss, the parts price creep that goes unnoticed, the underperforming vehicles that hide in the fleet average. Industry data from MaintainX, Fleetio, OxMaint, and others consistently shows 25-35% CPM reduction within 12-18 months of structured CMMS deployment. Talk to our team for a realistic CPM-reduction estimate based on your starting point.
You can't cut what you can't see.
Truck Inspection & Maintenance auto-calculates CPM per vehicle, reactive-vs-planned ratio, PM compliance, parts cost trends, and replacement-decision analytics from every work order. Benchmarked against ATRI 2026 standards. Free for up to 3 vehicles. Start closing your CPM gap today.