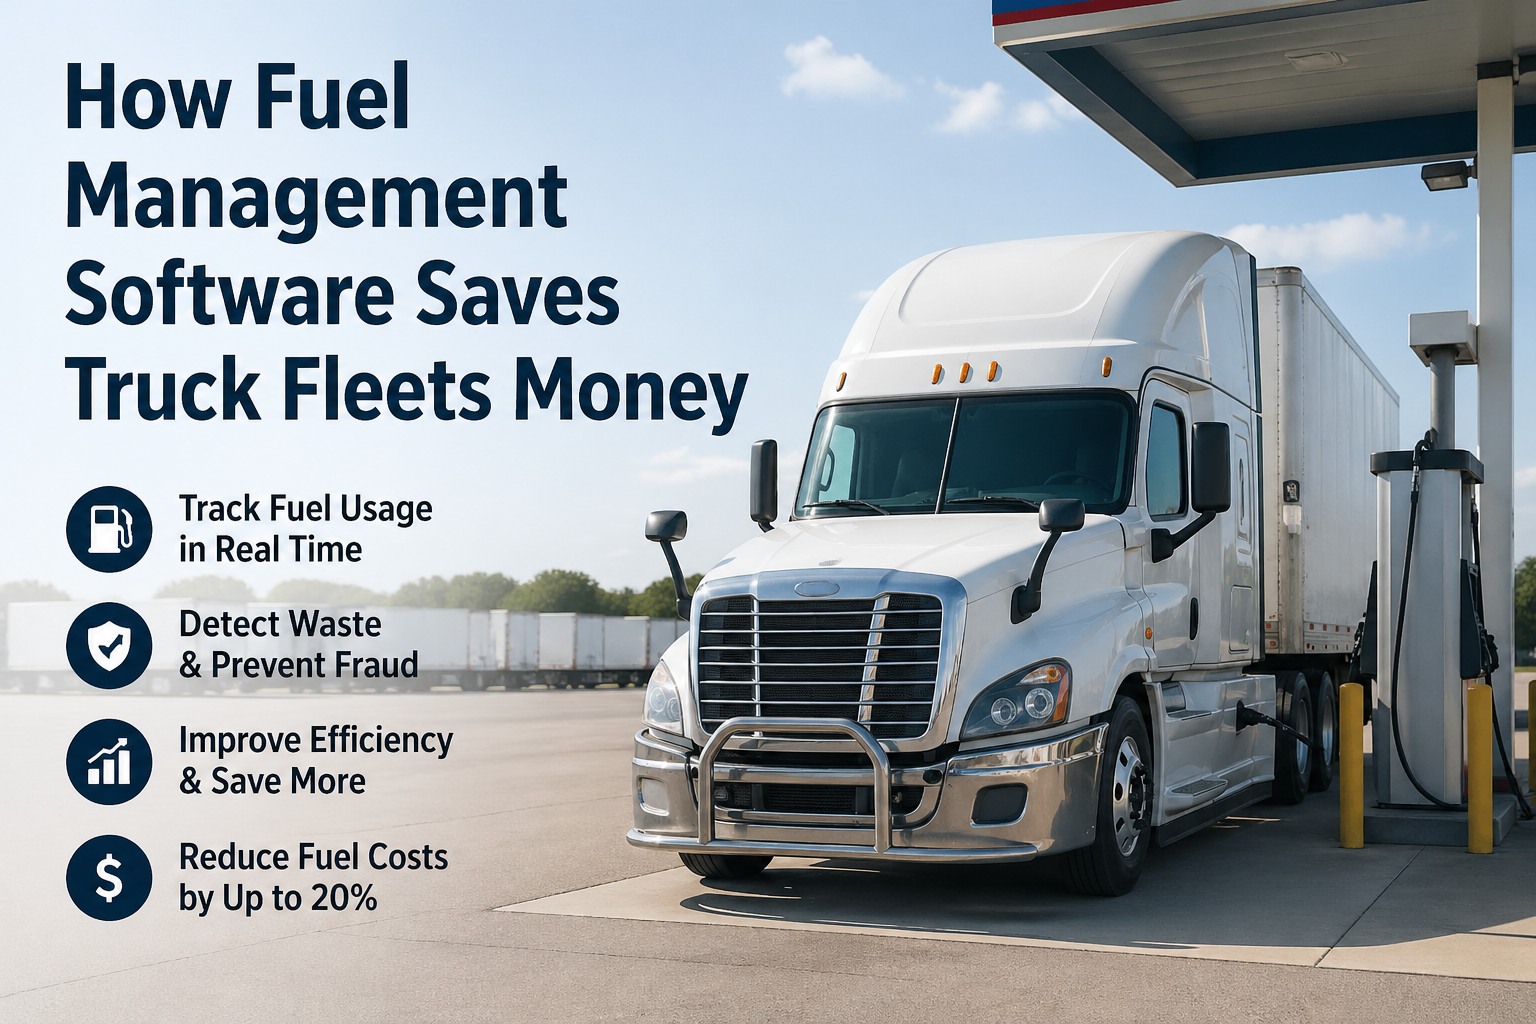
Fuel is the second-largest variable cost on any commercial fleet's P&L — right behind driver pay — and unlike labor, it's the one line item you can genuinely move without hiring, firing, or renegotiating a contract. The 2026 ATRI Operational Costs of Trucking report pegs the industry-average fuel cost at $0.482 per mile, roughly 21% of total operating cost. But that number is a fleet-wide average, and averages hide the truth: a truck idling 40% of its running time is bleeding 4–8% of total fuel spend into thin air; a driver with harsh acceleration habits burns 5–10% more fuel than a smooth peer; a fleet-wide 10 psi tire under-inflation quietly costs another 1.5% in fuel economy. Stack these leaks and 15–25% of your fuel spend is genuinely recoverable — often without buying newer trucks. This guide walks through exactly where fuel is lost, what each recovery lever is worth, and how our Truck Inspection & Maintenance software makes those recoveries stick. Prefer a walkthrough on your own fleet? Reach out to our support team.
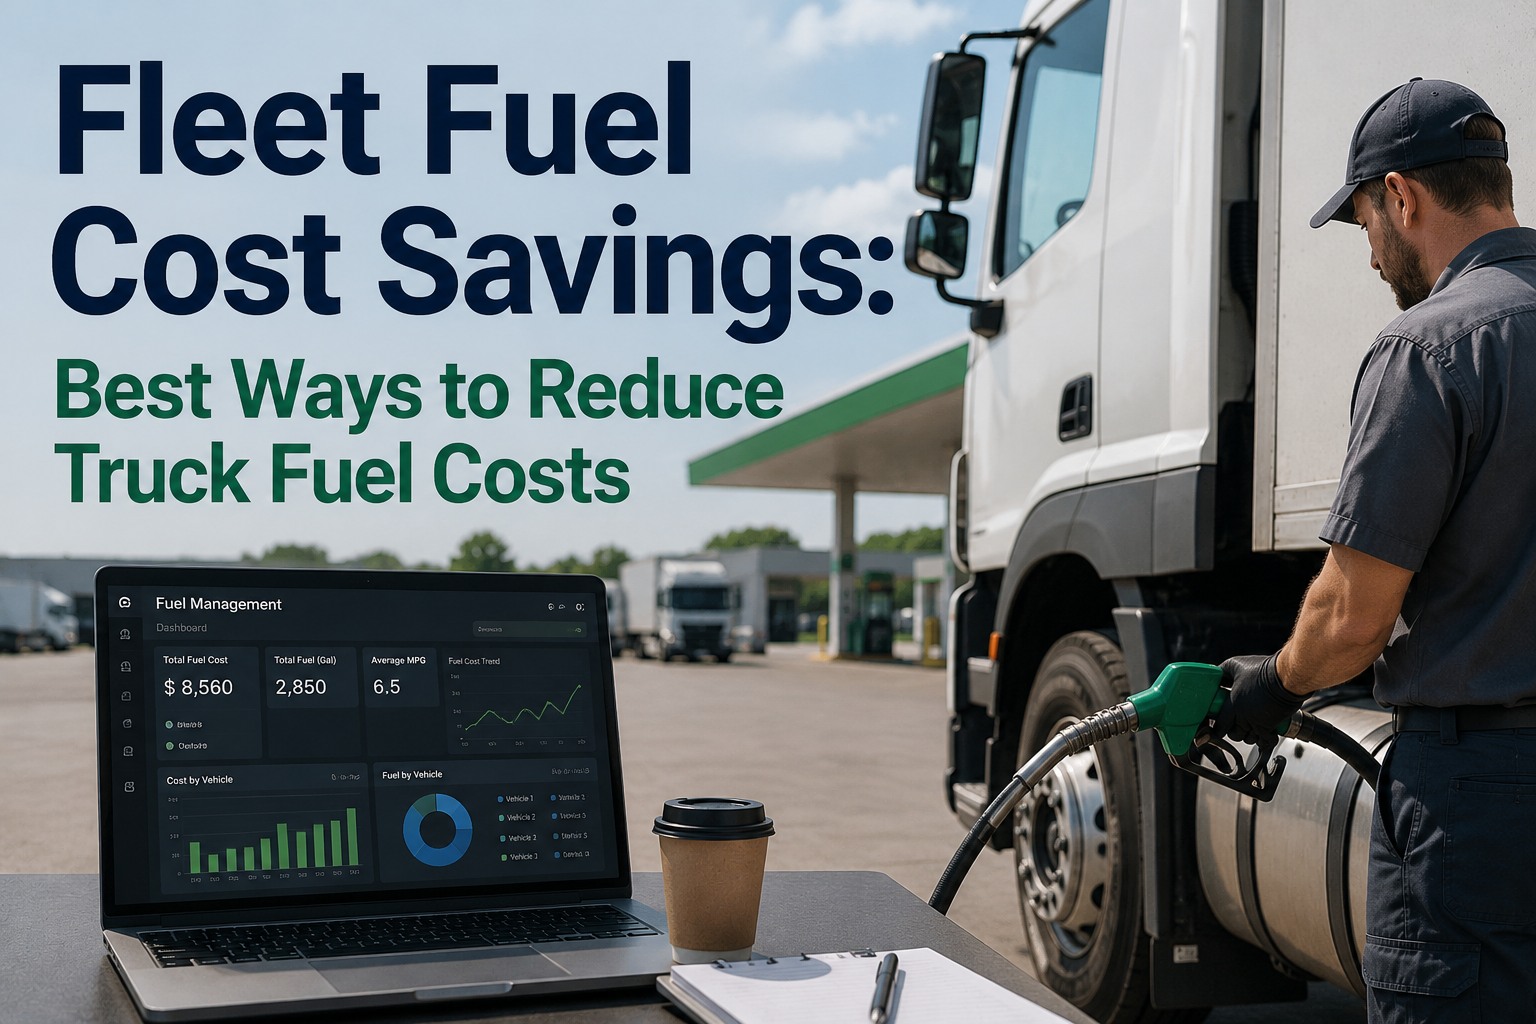
Fleet Fuel Cost Savings: The Complete Guide to Reducing Truck Fuel Costs
15–25% of your fleet's fuel spend is recoverable without buying new trucks. Here's exactly where the leaks are, how much each is worth, and the exact playbook top-quartile fleets use to fix them.
Where Fuel Actually Gets Wasted
Fuel doesn't disappear randomly. Every wasted gallon traces to one of five specific mechanisms. Fix these and the fleet economy takes care of itself.
Excessive Idling
Heavy trucks burn 0.8–1 gallon per hour idling. A driver idling 3 hours per shift wastes ~$4,500 per truck per year.
Harsh Driving Behavior
Hard acceleration, aggressive braking, speeding above 65 mph. A driver 10 mph over the sweet spot burns 15% more fuel.
Suboptimal Routing
Every unnecessary mile is a wasted gallon. Algorithm-driven routing cuts miles 8–15% on typical urban delivery routes.
Under-Inflated Tires
Every 1 PSI drop cuts fuel economy 0.3%. A fleet-wide 10 psi underinflation on 50 trucks wastes ~$10,000/year in fuel alone.
Fuel Card Fraud & Theft
Unauthorized purchases, off-route fill-ups, cash-back scams. Fuel-card monitoring flags anomalies in real time.
Poor Maintenance
Dirty air filters, worn injectors, misaligned drivetrain. A neglected truck burns 3–5% more fuel over its service life.
Quick Fuel Savings Calculator
Plug in your fleet's fuel numbers. See what a conservative 12% reduction looks like on your P&L.
Your Fleet Today
The Driver Behavior Impact
Two drivers, same truck, same route — and often a 15–20% gap in fuel economy between them. Understanding what specifically drives that gap is where the biggest per-truck savings live.
The 6-Lever Fuel Savings Playbook
These are the six levers, in the order of fastest impact. Every fleet running a serious fuel program pulls all six — but the sequence matters.
Track fuel per truck, per driver, per shift
You can't reduce what you can't measure. Baseline visibility — MPG per vehicle, per driver, per route — is the foundation. Everything else compounds off this.
Idle-time monitoring & alerts
Set an idle threshold (typically 5 minutes). Every event over threshold is flagged and reported. Driver-visible scorecards cut idle 40–60% in 90 days.
Route optimization
Algorithm-driven route sequencing plus real-time traffic integration. Reduces unnecessary miles 8–15%. Also cuts congestion idle indirectly.
Driver behavior scoring
Weekly scorecards showing MPG, harsh-event count, and idle time per driver. Peer visibility does more than punitive coaching — top-quartile competition drives behavior.
Tire pressure & PM discipline
Weekly cold pressure check. Timely air filter, injector, and alignment service. Small maintenance items with outsized fuel impact.
Fuel card fraud controls
Real-time transaction matching against vehicle location, permitted grades, allowed vendors. Automated anomaly flagging catches theft and unauthorized purchase.
Turn every lever with one platform
Fuel logs, driver scorecards, PM cadence, tire pressure tracking, fuel card monitoring — all connected to the same vehicle record. Nothing to reconcile between systems.
The Fuel-Maintenance Connection Most Fleets Miss
Maintenance and fuel look like separate cost buckets on the P&L. On the truck itself, they're the same problem — and the software that tracks one should track the other.
Underinflated tires
Every 10 psi drop = ~1% fuel economy loss. Also cuts tire life 10–15%. Same defect, two P&L hits.
Dragging brakes
A caliper that doesn't fully release adds continuous rolling resistance. Fuel goes up. Brake components wear faster.
Misalignment
1/16" of toe = 8 feet of sideways drag per mile. Fuel economy drops 3–5%. Tire wear accelerates 25–40%.
Worn injectors
Poor spray pattern = incomplete combustion = higher fuel burn + higher emissions + more DPF regen cycles.
Dirty air filter
Restricted airflow forces the engine to work harder to hit target power. Direct 1–3% fuel penalty.
Missed oil changes
Degraded oil increases internal friction. Fuel economy slips gradually — often unnoticed until the next PM.
How Truck Inspection & Maintenance Software Helps
Fuel programs live and die on data discipline. Manual tracking works for a week; automated tracking works forever.
Per-vehicle MPG dashboard
Every fill-up logged against the vehicle record. Trend charts show MPG drift the moment it starts — before it costs you a full tank.
Tire pressure at every pre-trip
Drivers log pressure per position on the DVIR. Below-spec readings auto-flag as defects — before they cost you fuel or a tire.
Air filter & injector intervals
Fuel-impact PM services fire on schedule based on engine hours — not on someone remembering. Small services with outsized fuel returns.
Alignment & balance tracking
Alignment check dates stored per vehicle. Overdue trucks flagged automatically. Prevents fuel drag from silent misalignment.
Fuel + maintenance CPM combined
Track total operating CPM per vehicle. See which trucks eat both fuel and maintenance — the compound offenders are the fastest ROI targets.
Fleet-wide fuel program dashboard
One view of every lever — MPG, idle time, defect closure rate, PM compliance — so leadership tracks the program, not a stack of spreadsheets.
Frequently Asked Questions
The 2026 fleet-technology surveys report average fuel savings of 16% from combined fuel programs — up from 9% in 2024. Conservative estimates land at 10–15%; aggressive programs (all six levers plus scorecarding) hit 20–25%. Every fleet's starting baseline determines which end of the range applies.
Idle-time monitoring, typically. Turning on visibility and setting an idle alert threshold produces 40–60% idle reduction within 90 days — often equal to 4–8% total fuel savings. It's the cheapest, fastest lever with the least behavior-change friction.
Yes — but only when they stay visible. Fleets that combine weekly scorecards with monthly coaching typically see 5–10% fuel reduction from driver behavior alone. Take the scorecard away and behavior drifts back within 60 days. Visibility is the mechanism, not coaching.
Every 1 PSI drop reduces fuel economy 0.3%. A fleet-wide 10 psi underinflation on 50 trucks wastes ~$10,000/year in fuel — plus 10–15% of tire life. Weekly cold pressure checks are one of the cheapest ways to protect both.
Most fleets see software cost recovered within the first month of the fuel program. On a $2.4M fuel budget, even a conservative 8% reduction is $192,000 in year one — well above the total cost of a mid-range fleet-management platform for a 50-truck fleet.
On urban delivery routes, yes — 8–15% mileage reduction is typical. On long-haul lanes with fixed origin-destination pairs, savings are smaller (usually 2–5% via congestion avoidance) but still meaningful at fleet scale.
Stop leaking fuel — start tracking it
Automated MPG tracking. Idle-time alerts. Driver scorecards. Tire pressure logging on every DVIR. PM cadence tied to fuel-impact services. Fuel card monitoring. All the fuel-program levers in one platform — with cost-per-mile and cost-per-vehicle dashboards to prove the savings.