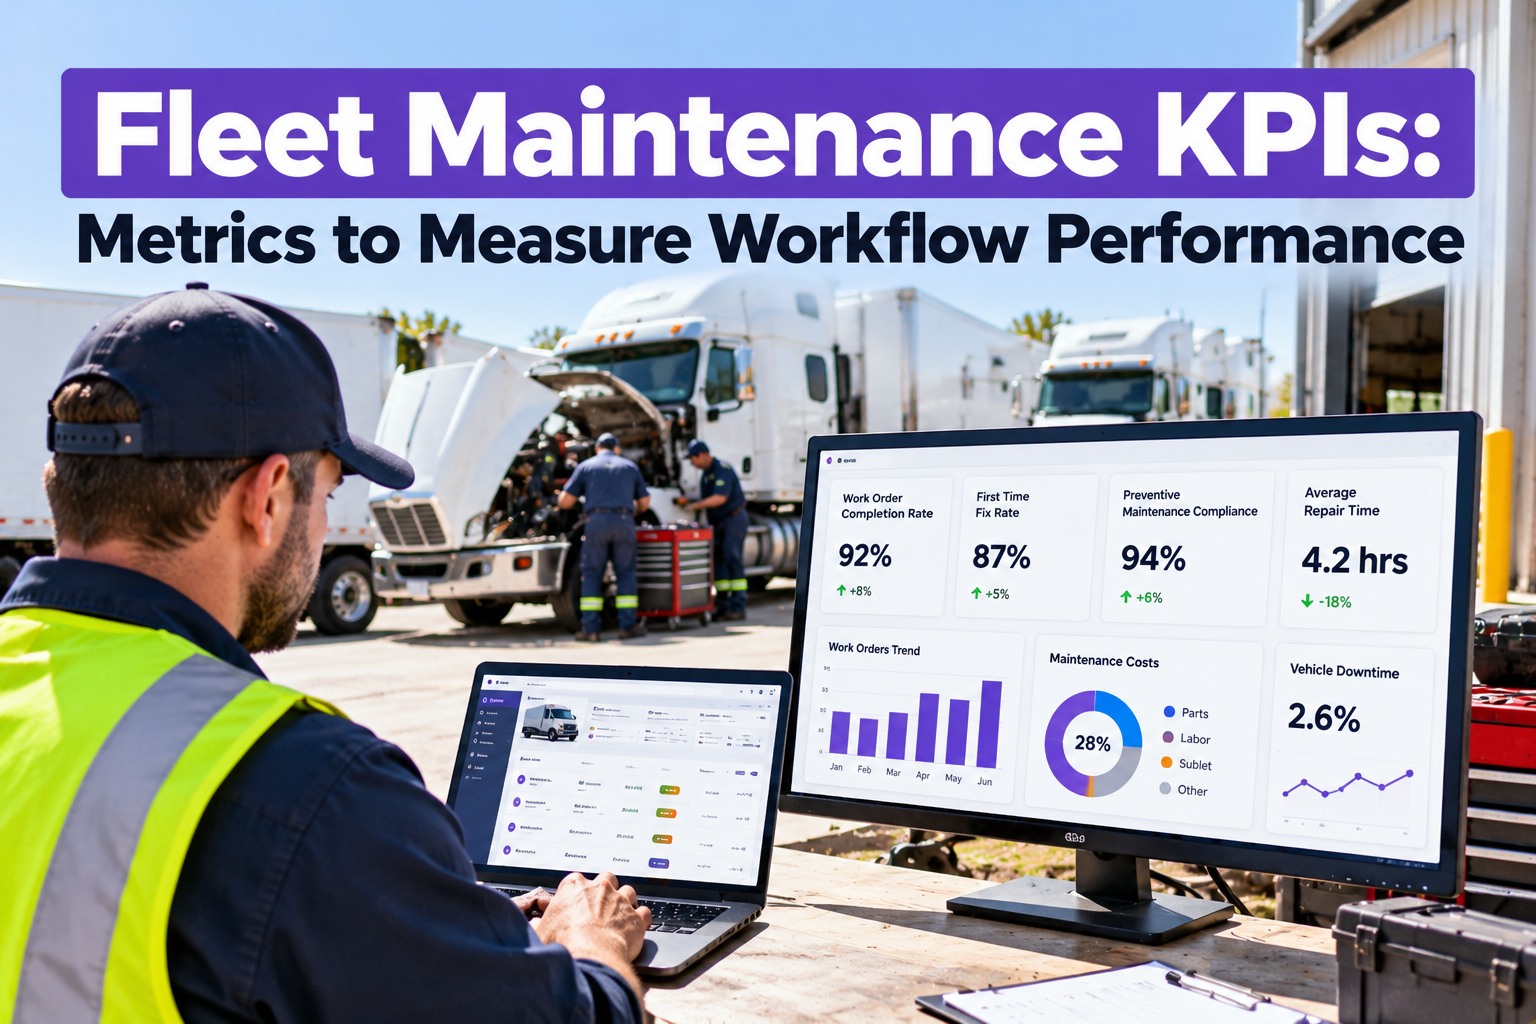
"We're busy" is not a number. A maintenance team can run flat out all week and still be losing — defects taking days to reach a work order, the same faults coming back, trucks sitting on a backlog nobody sized. You can't fix a workflow you can't see, and you can't see it without a handful of the right numbers. This guide walks the KPIs that actually measure a fleet maintenance workflow — from DVIR-to-work-order time to first-time fix rate, repeat defects, PM compliance, and backlog — what each one means, what good looks like, and which gap it exposes. Start free and see these numbers live on TIM.
TIM · Fleet Maintenance Workflow KPIs
Fleet Maintenance KPIs: Metrics to Measure Workflow Performance
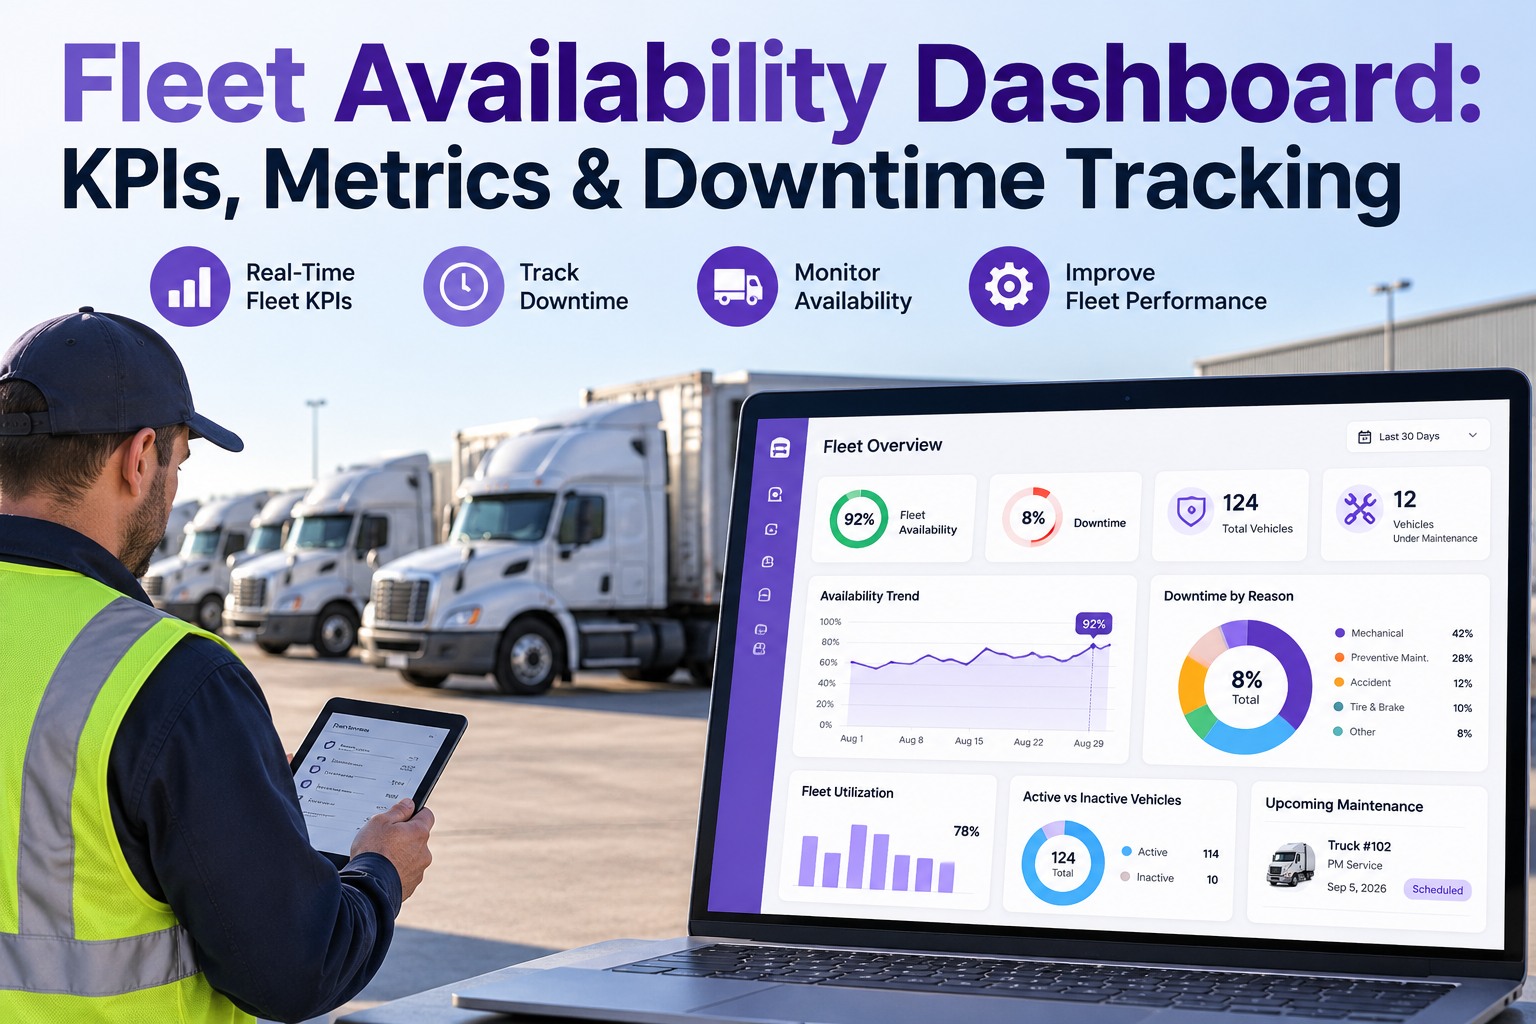
Gut feel hides the gaps. A defect that takes three days to become a work order, a comeback rate creeping up, a PM program quietly slipping below compliance — none of it shows until you put a number on it. What you want is a short list of KPIs that track the workflow end to end and tell you where it leaks. That's what Truck Inspection & Maintenance Management Software (TIM) measures as it runs the loop: inspection to defect to work order to verified repair to PM, with the metrics that matter surfaced on one dashboard.
Measured, not guessedEvery defect, repair, and PM tracked on one record — so DVIR-to-work-order time, fix rate, and compliance are numbers you can see, not feelings.
Measure the Workflow, Stage by Stage
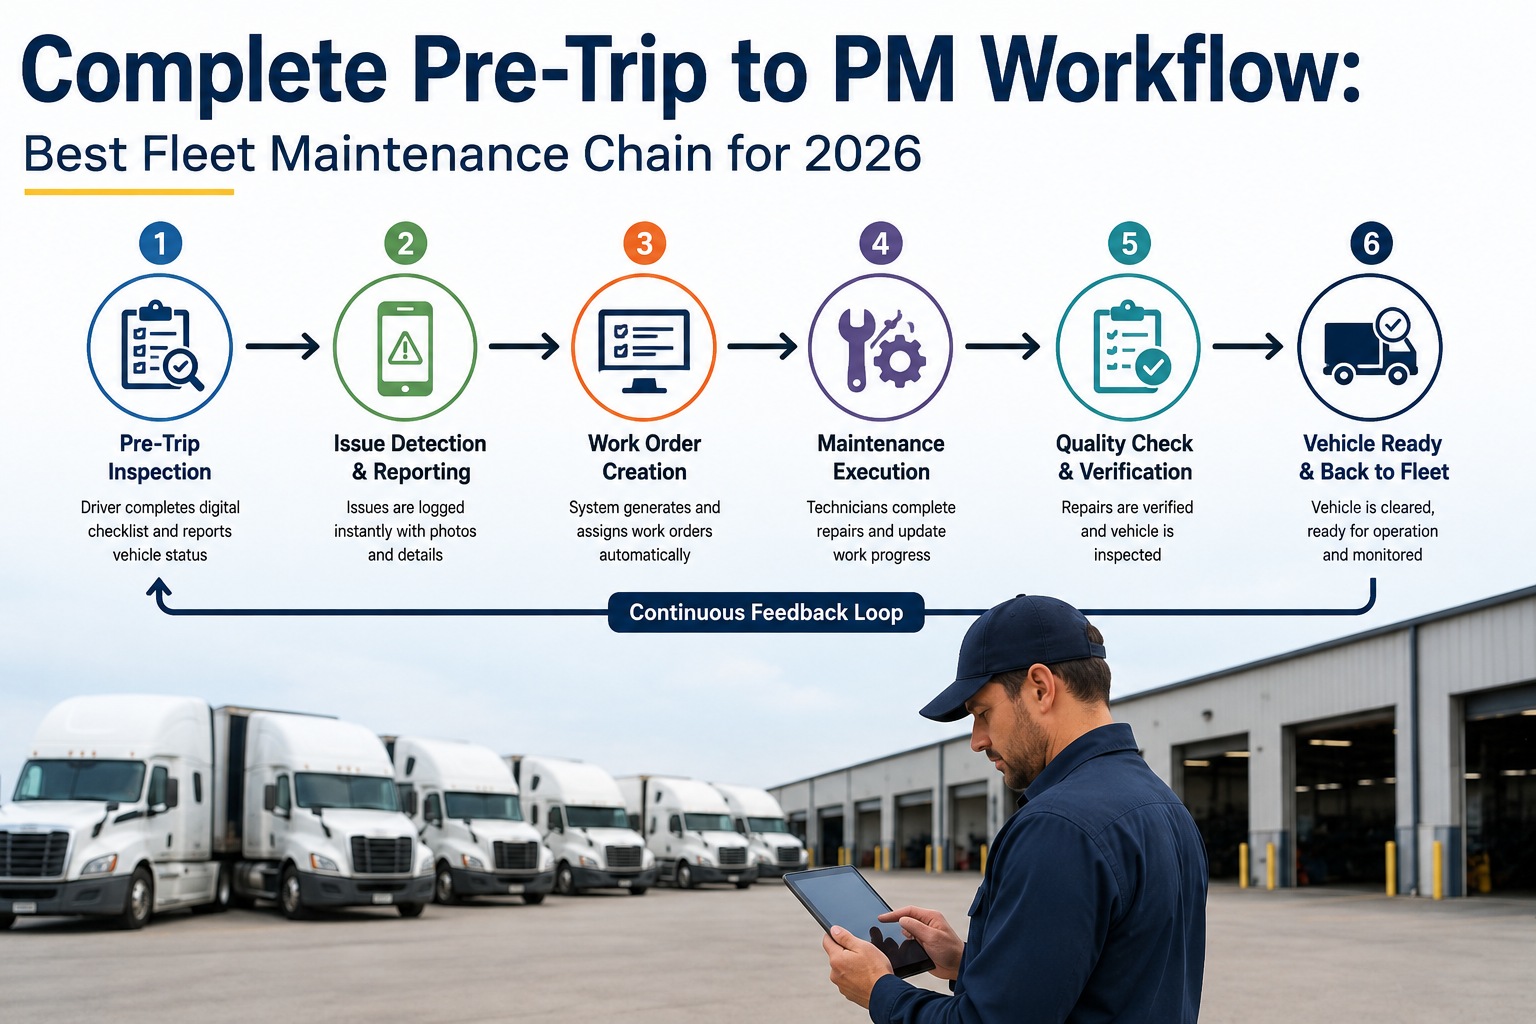
A maintenance workflow is a chain — detect, repair, prevent — and each stage has its own health metric. Put the KPIs where the work happens and you can see which link is slipping.
DETECT & ACT
How fast a defect becomes a job
DVIR-to-work-order time · repeat defect rate
→
REPAIR
How well the fix sticks
First-time fix rate · work-order completion · MTTR
→
PREVENT
How much is planned
PM compliance · planned-vs-reactive · backlog
→
OUTCOME
What it all adds up to
Vehicle uptime · cost per mile
No single number tells the story — but five or six, read together, show exactly where the workflow is losing time and money. Contact our team to pick the right KPIs for your fleet.
The KPIs That Measure a Maintenance Workflow
Each card below is one metric: how to calculate it, what good looks like, and what a bad reading is really telling you. Start with the ones that map to your biggest pain.
DVIR-to-Work-Order TimeDetect
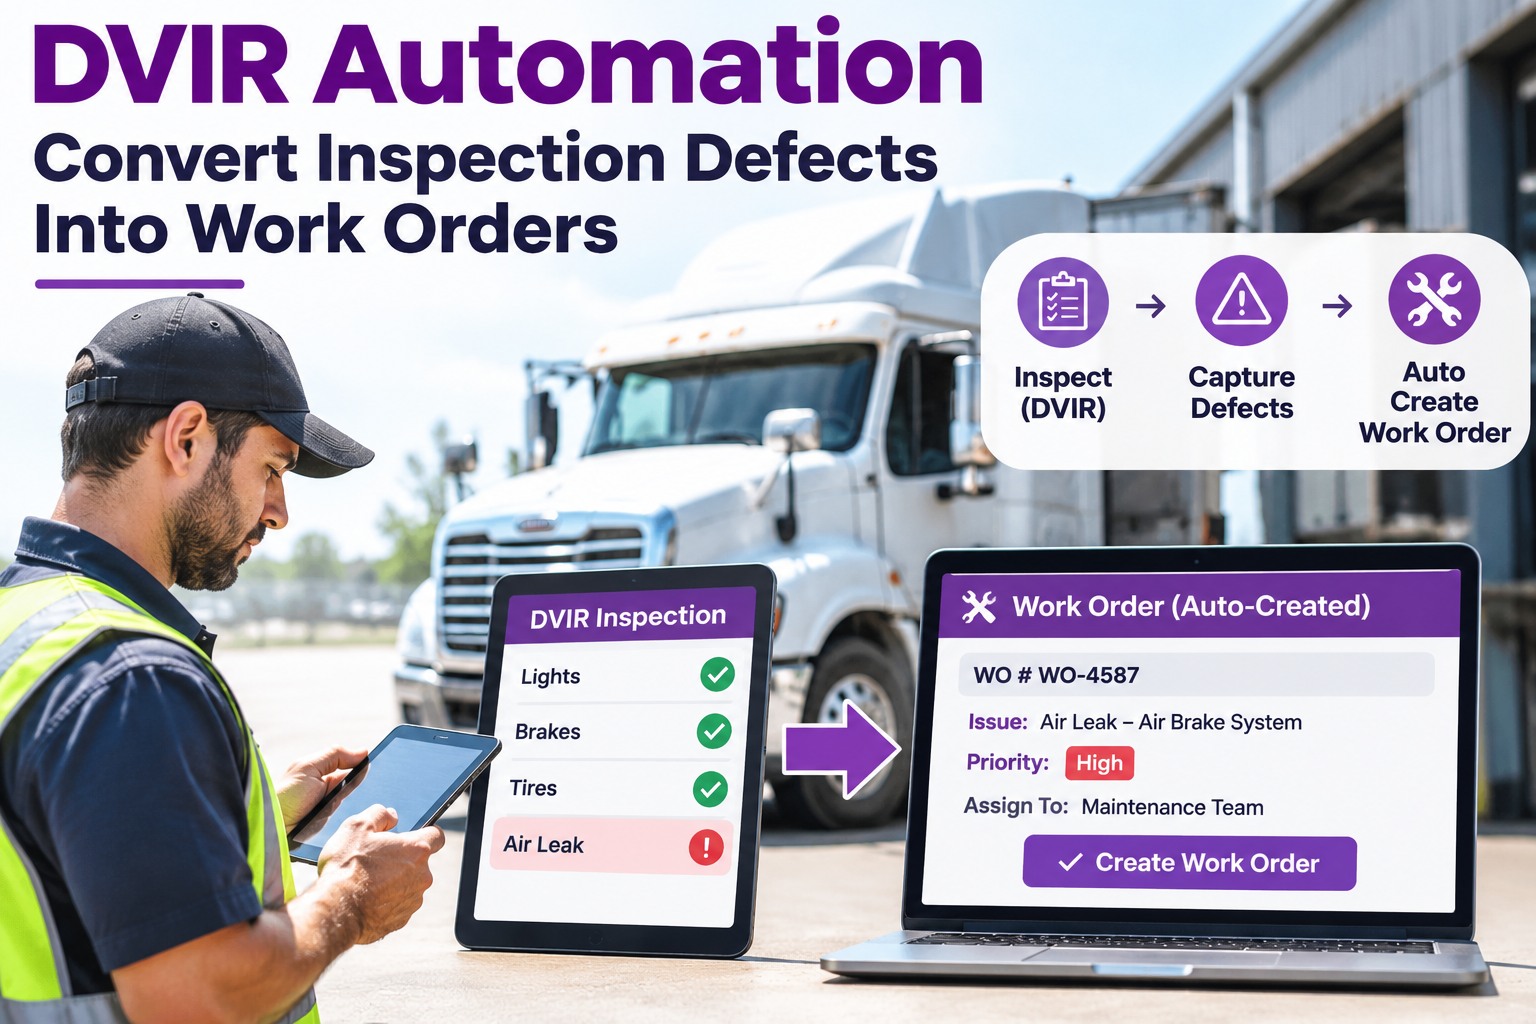
Avg. time from a defect reported on a DVIR to a work order raised
HoursA dayDays+
Reveals the handoff gap between the driver and the shop. Long times mean defects sit while the truck keeps running.
Repeat Defect RateDetect
Repeat repairs ÷ total repairs, counting the same fault back within 30–90 days
Under 5%5–10%Over 10%
Reveals incomplete diagnosis, part quality, or training gaps — the fix didn't hold.
First-Time Fix RateRepair
Jobs fixed right on the first visit ÷ total jobs, no comeback or second trip
90%+75–90%Under 75%
Reveals whether the shop has the right parts, info, and skill on hand. Low rates burn bays twice.
Work-Order Completion RateRepair
Work orders completed on time ÷ total work orders in the period
Rising trendFlatFalling
Reveals whether the shop is keeping pace with what comes in, or quietly falling behind.
Mean Time to Repair (MTTR)Repair
Total repair time ÷ number of repairs
Trending downSteadyClimbing
Reveals parts availability and process friction. A long MTTR usually means parts weren't on the shelf.
PM Compliance RatePrevent
PMs completed on time ÷ total PMs scheduled, × 100
90%+80–90%Under 80%
Reveals whether prevention is real or on paper. Below 80% means the schedule is unrealistic or deprioritized.
Planned vs. ReactivePrevent
Planned maintenance hours ÷ total maintenance hours, × 100
80%+ planned50–80%Mostly reactive
Reveals who's running the shop — the schedule or the breakdowns. Over half reactive is firefighting.
Maintenance BacklogPrevent
Open, ready-to-schedule work expressed in weeks of crew capacity
2–4 weeks4–6 weeksOver 6 / near 0
Reveals capacity balance. Too big and work waits; near zero often means deferred work is going unlogged.
Two outcome numbers sit on top of these: vehicle uptime (95%+ is the target; below 90% signals real trouble) and cost per mile, which has no universal benchmark — you set a baseline and watch the trend. Start free and track every one of these on TIM.
The Numbers Only Work If the Workflow Feeds Them
You can't measure DVIR-to-work-order time if the DVIR is on paper, or first-time fix rate if comebacks aren't linked to the original job. TIM produces these KPIs as a by-product of running the loop — every inspection, defect, work order, and PM on one record — so the dashboard reflects what actually happened, not what someone typed into a spreadsheet at month end.
Which Number Exposes Which Gap
A KPI is only useful if you know what to do when it moves. This is the quick read — the symptom, the metric that catches it, and the process gap it usually points to.
What you're seeing
The KPI that catches it
The gap it points to
Trucks failing roadside on known issues
DVIR-to-WO time
Defects stall between driver and shop
The same fault keeps coming back
Repeat defect rate
Diagnosis, parts, or training
Jobs need a second trip to the bay
First-time fix rate
Parts or info not ready at the job
Repairs drag on longer than they should
MTTR
Parts off the shelf; process friction
Breakdowns keep interrupting the plan
PM compliance / planned-vs-reactive
Prevention slipping; shop is reactive
Work never seems to get caught up
Backlog / completion rate
Capacity mismatch or hidden deferral
Read this way, a KPI isn't a scoreboard — it's a pointer to the exact part of the workflow to fix next. Contact our team to map your numbers to their gaps.
Start With Five, Not Twenty-Five
The fastest way to kill a KPI program is to track everything. Pick the few that match your pain, set a baseline, and review on a rhythm.
1
Pick 3–5 KPIsChoose the ones tied to your worst symptom — usually DVIR-to-WO time, first-time fix, and PM compliance to start.
2
Baseline themMeasure where you are today before setting a target. You improve against your own starting line.
3
Set a review cadenceLook weekly at the fast-moving ones, monthly at the trends — the same numbers, every time.
4
Act on one gapMove one metric at a time; fixing the slowest handoff usually lifts several others with it.
Five numbers you review every week beat twenty-five you glance at once a quarter. Start free and baseline your first five on TIM.
How TIM Delivers It
KPIs as a By-Product of the Workflow
The hard part of KPIs isn't the math — it's capturing clean data without extra admin. TIM produces the numbers automatically because every inspection, defect, and repair already lives on one record.
One connected recordInspection, DVIR, work order, and PM linked per truck, so the metrics are real, not retyped.
Cycle times trackedDVIR-to-work-order and time-to-repair measured automatically from the timeline.
Comebacks linkedA repeat fault ties to the original job, so repeat-defect and first-time-fix rates are accurate.
PM compliance liveScheduled vs completed PMs tracked as they happen, not reconstructed at month end.
Backlog visibleOpen, ready work sized against capacity so the backlog is a number, not a guess.
One dashboardThe handful that matter on a single view for the weekly and monthly review.
Frequently Asked Questions
What are the most important fleet maintenance KPIs?
Start with the ones that measure the workflow end to end: DVIR-to-work-order time (how fast a defect becomes a job), first-time fix rate and repeat defect rate (whether repairs stick), PM compliance (whether prevention is real), work-order completion and backlog (whether the shop keeps pace), and the outcome pair — vehicle uptime and cost per mile. You don't need all of them at once. Pick three to five that match your biggest pain, baseline them, and add more only once those are driving action.
What is a good PM compliance rate?
90% or better is the general target — meaning nine of every ten scheduled preventive-maintenance tasks are completed on time. Dropping below 80% is a warning sign: it usually means the schedule is unrealistic for the crew you have, or PM is being pushed aside for reactive work. Compliance is one of the most telling workflow KPIs because it shows whether prevention is actually happening or just living on a plan. When it falls, breakdowns and unscheduled work tend to rise right behind it.
What's the difference between first-time fix rate and repeat defect rate?
They look at the same problem from two ends. First-time fix rate measures how often a job is done right on the first visit, with no second trip — a shop-side view of readiness, parts, and skill, with 90%+ considered strong. Repeat defect rate measures how often the same fault comes back within a month or so, usually kept under 5%. A low first-time fix rate and a high repeat rate often travel together and point to the same causes: incomplete diagnosis, missing parts, or a training gap. Watching both tells you whether your repairs are actually holding.
Why track DVIR-to-work-order time?
Because it measures the single most common place a maintenance workflow leaks — the handoff between the driver who finds a defect and the shop that fixes it. If a reported defect takes days to become a work order, the truck is running on a known problem the whole time, and that's exactly how a yard-catchable issue becomes a roadside breakdown. A workflow built on connected software pulls this time down to hours, because the defect becomes a graded work order the moment it's filed rather than waiting for someone to re-key a paper slip.
Do I need software to track these KPIs?
You can track a few by hand, but the cycle-time and comeback metrics are hard to get right on paper. Measuring DVIR-to-work-order time means timestamping both ends; measuring repeat-defect and first-time-fix rates means linking a comeback to the original job. Spreadsheets reconstructed at month end tend to be late and lossy. Software that runs the workflow produces these numbers as a by-product — every inspection, defect, repair, and PM is already captured on one record, so the dashboard reflects what happened rather than what someone remembered to enter.
Start free and let TIM track your KPIs automatically.
DVIR-to-WO · Fix Rate · Repeat Defects · PM Compliance · Backlog
Put a Number on the Workflow, Then Fix the Gap It Shows
You can't improve what you can't see. Pick the five KPIs that match your pain, baseline them, and read them every week — DVIR-to-work-order time, first-time fix, repeat defects, PM compliance, backlog. TIM produces them automatically from the workflow it runs, on one dashboard. It's free to start on your first three trucks.
No credit card required · Free for up to 3 trucks · Cycle times, fix rates, PM compliance, and backlog on one dashboard