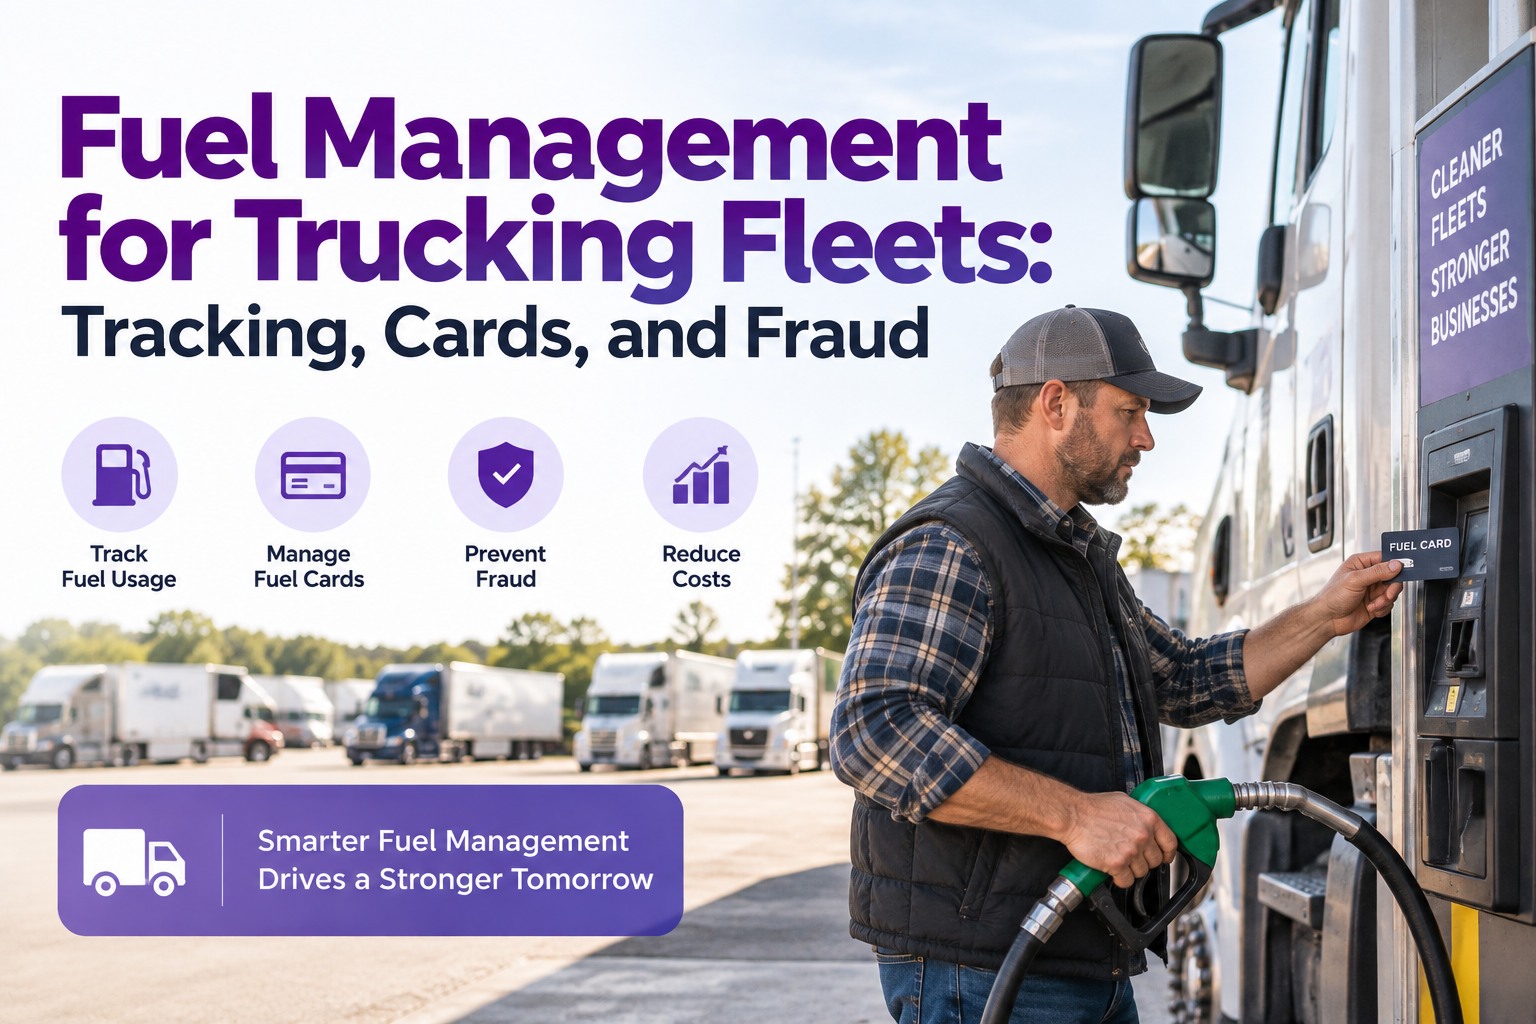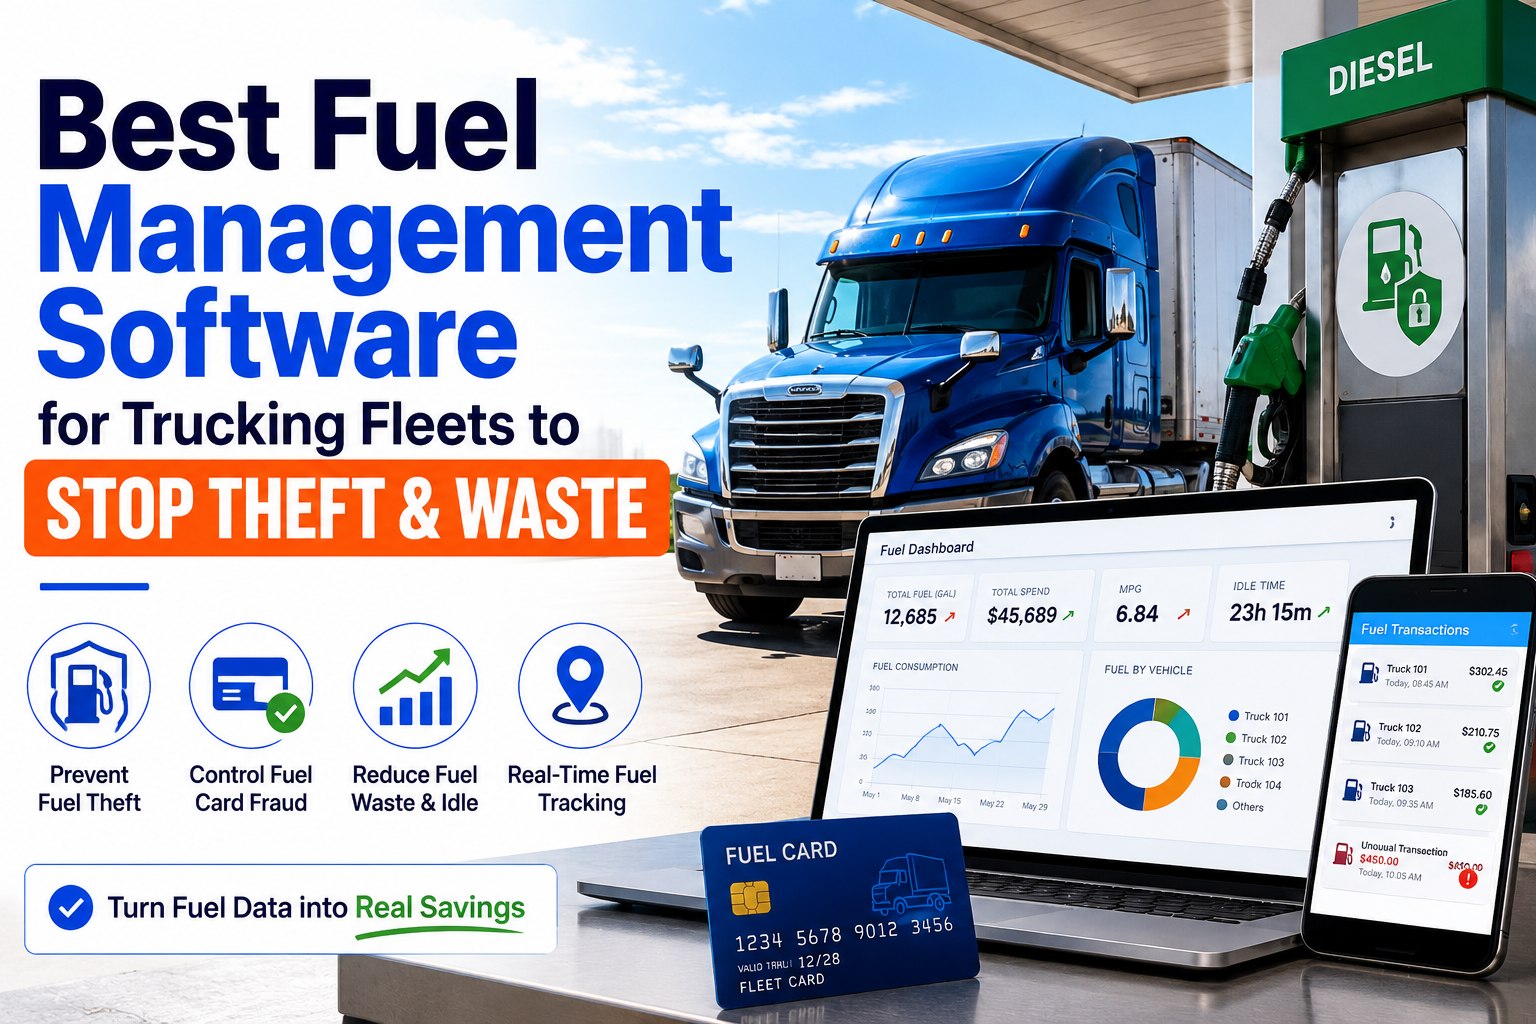
Fuel is the single largest variable cost in commercial fleet operations — typically running 30-40% of total operating expense for over-the-road trucking and growing as a percentage in fleets running heavy idle hours. And it's the cost category where the most money disappears invisibly. Industry studies place fuel theft losses at 2-5% of total fuel spend in fleets without structured monitoring — meaning a 100-vehicle fleet hemorrhages $50,000+ per year in theft alone before counting card fraud, buddy fueling, or simple efficiency degradation from poor maintenance. The good news: every one of these losses is detectable, measurable, and recoverable with the right management framework. Fleets deploying structured fuel management programs in 2026 consistently report 10-25% total fuel cost reduction in the first 90 days — savings that compound year over year as systems mature.
The transformation is operational, not technological. The fuel management discipline rests on five pillars: real-time visibility into every gallon (tank sensors, fuel card integration, GPS verification), per-vehicle reconciliation comparing fuel purchased against fuel consumed (the gap is where theft hides), driver behavior coaching (idle time, speed, acceleration patterns drive 8-12% of MPG variance), maintenance correlation (a declining MPG is often the first sign of a mechanical problem, not theft), and IFTA automation that removes manual data entry from compliance. A real-world example: a Texas construction company implemented fuel management software and within 90 days discovered $35,000 in annual fuel theft (two employees siphoning, plus a fuel card used 200 miles from any vehicle), driving total fuel costs down 12%. Their first detected fraud alert paid for the platform multiple times over.
This guide is the complete fleet fuel management checklist for 2026: the 6-stage cost-reduction framework, the KPIs that prove your program is working, the 5 fuel theft modes and detection methods, the driver behavior coaching framework, and the integration with maintenance workflow that catches mechanical efficiency losses. Start your free trial of our truck inspection and maintenance software to connect fuel data with PM and inspection workflow — live in 10 minutes, free for up to 3 trucks.
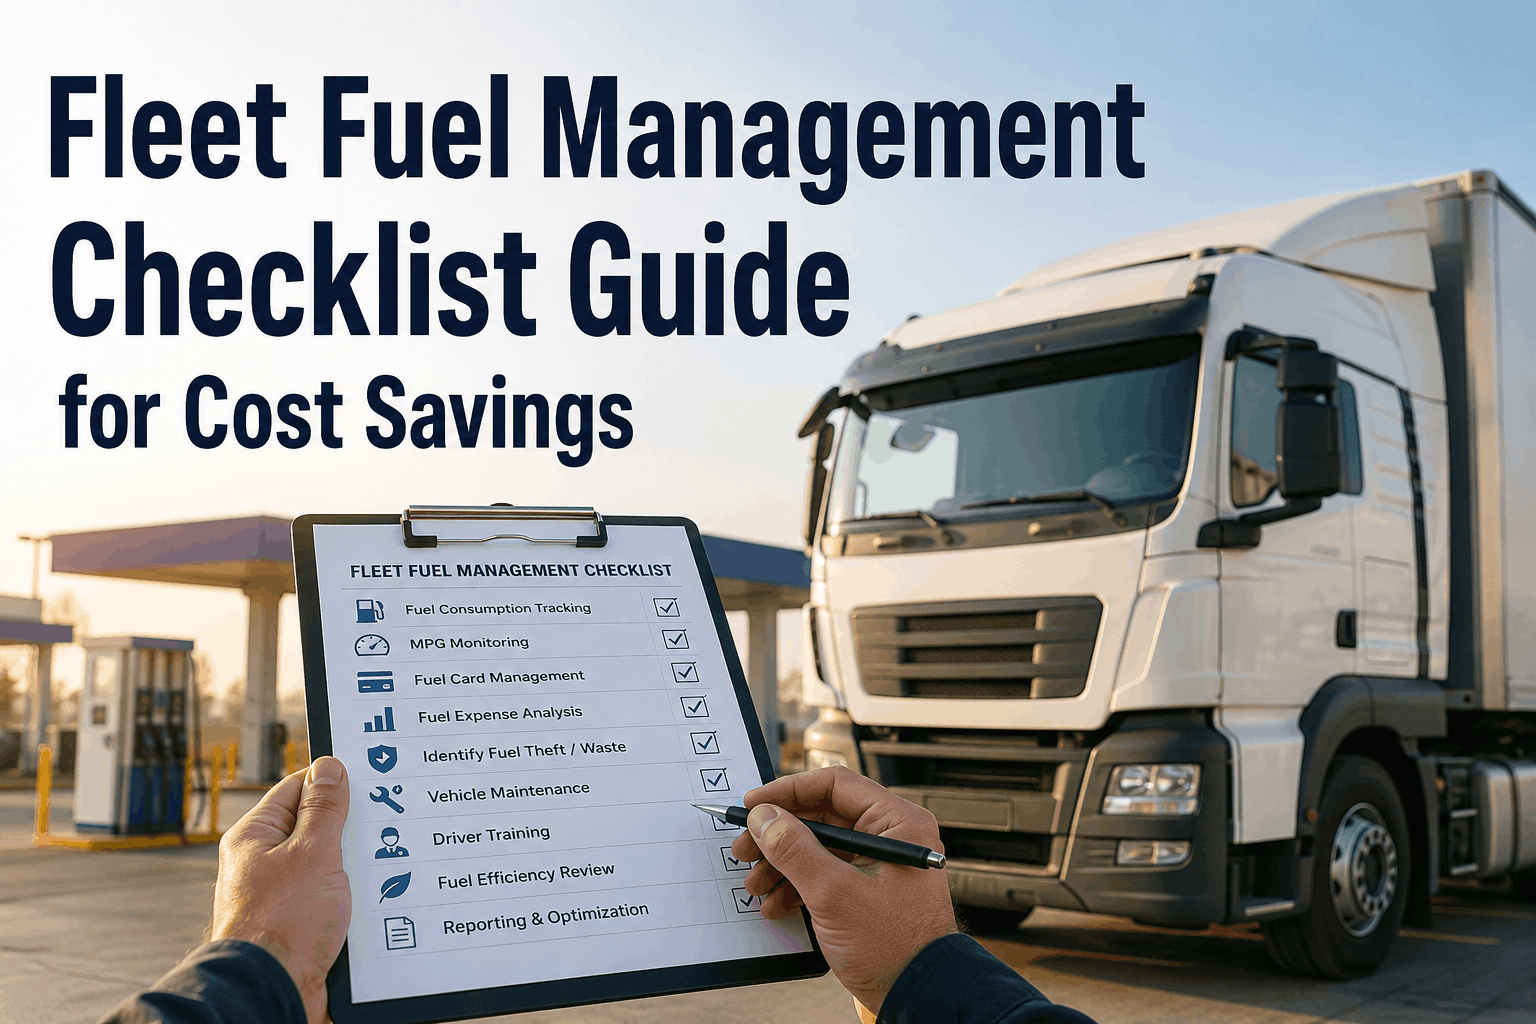
Fleet Fuel Management Checklist for Cost Savings
The complete 2026 framework — 6-stage cost reduction system, fuel theft detection, driver coaching, fuel card integration, and the maintenance correlation that turns invisible losses into recovered margin. 10-25% total fuel cost reduction in 90 days.
The 6-Stage Fuel Management Framework
Every effective fleet fuel program rests on these 6 stages. Skip any one and the program leaks money in that exact category. Contact our sales team for help deploying all 6 stages on your fleet.
The 5 Fuel Theft Modes — How Fleets Lose Money Invisibly
Fuel theft isn't always someone with a siphon hose. Five distinct theft modes hit fleets in 2026 — each with its own detection signature.
The KPIs That Prove Your Program Works
Six metrics reveal whether your fuel management program is delivering results. Track these monthly to verify performance and identify problem vehicles or drivers before losses compound.
The Fuel Card Setup — What Your Card Program Should Do
Fleet fuel cards capture transaction-level data that ordinary credit cards cannot. A correctly configured card program is the foundation of every other fuel management capability.
Frequently Asked Questions
Industry data shows fleets deploying structured fuel management programs achieve 10-15% total fuel cost reduction on average, with comprehensive programs reaching 15-25% in the first 90 days. For a fleet spending $400,000 annually on fuel, that's $40,000-$100,000 in recovered margin. The savings break down across categories: 2-5% from theft prevention alone (industry baseline drops to under 0.5% with structured detection), 8-12% MPG improvement from driver behavior coaching, 3-8% from idle reduction, and additional savings from mechanical efficiency improvements caught by MPG variance alerts. Most fleets see positive ROI within 90 days — the first prevented fraud incident typically covers the annual platform cost. Start your free trial to model your fleet's specific savings potential.
Fleet fuel cards capture transaction-level data that credit cards do not: driver ID, vehicle ID, gallons, odometer reading, GPS coordinates, timestamp, fuel grade, and price per gallon at every fill. They enforce purchase controls (fuel-only, daily limits, geographic boundaries, time restrictions) that prevent unauthorized spending. They generate IFTA-ready jurisdiction reports automatically — eliminating the manual data entry that drives audits. And they integrate with fleet management platforms for unified cost-per-mile analytics, fraud detection, and driver scorecards. Credit cards provide none of this. The single most common fraud mode in fleets is using a personal credit card for company fuel "for convenience" — eliminating exactly the audit trail that catches everything.
Five detection methods covering the five theft modes: (1) Direct siphoning — tank-level sensor detects drops without engine running; (2) Card fraud — GPS verification flags transactions where card location doesn't match vehicle location; (3) Buddy fueling — transaction volume exceeds the truck's tank capacity; (4) Ghost mileage — odometer increases without corresponding GPS-tracked work miles; (5) Vendor fraud — comparing pump-reported fill to actual tank-level rise catches dispenser discrepancies. AI-driven platforms cross-reference all five signals automatically, alerting in seconds when patterns match. Industry baseline is 2-5% fuel loss unmanaged; best-practice fleets hit under 0.5% with structured detection. Real-world example: a Texas construction company implemented fuel management software and discovered $35,000 annual fuel theft within 90 days. Contact our sales team for help deploying theft detection.
Significantly. Poor maintenance can degrade fleet fuel economy by 5-15% through multiple mechanisms: dirty air filter (engine works harder, burns more fuel); clogged fuel filter (poor injection, incomplete combustion); leaking injectors (raw fuel wasted, runs rich); under-inflated tires (rolling resistance increases 3-5%); worn/contaminated oil (more internal friction); DPF backpressure (engine fights aftertreatment); poor wheel alignment (drag). The diagnostic value goes both ways: a sudden MPG decline is often the earliest sign of one of these mechanical problems — weeks before it triggers a fault code or breakdown. The 2026 best practice is correlating fuel data with PM and inspection history: declining MPG + overdue air filter = maintenance issue, not theft. Sign up free to connect fuel data with maintenance records.
Driver behavior coaching delivers the fastest measurable savings — typically 8-12% MPG improvement within 30-60 days of deploying scorecards. The mechanism: drivers seeing their individual idle time, speed, harsh events, and MPG ranked against peers respond faster than they respond to abstract policy mandates. Coaching the bottom quartile to fleet average alone typically delivers 4-8% fleet fuel savings. Idle reduction is the second-fastest — every idle hour burns approximately 0.8 gallons of diesel, and structured anti-idle policies typically achieve 22-35% reductions within 90 days. The bottom-quartile driver receiving their first weekly scorecard often produces immediate behavior change — the cost transparency drives the change without any additional intervention required. Talk to our sales team for help deploying driver scorecard workflow.
Integrated platforms win the operational argument. Standalone fuel management tools create new disconnected systems that don't talk to PM scheduling, work orders, inspection records, or vendor tracking — meaning when MPG drops, you have no way to immediately answer "is this theft or maintenance?" The 2026 standard is one platform handling fuel + PM + inspections + work orders on a unified data model. Declining MPG cross-references against maintenance history automatically: overdue air filter = mechanical, no recent service correlation = investigation needed. Standalone platforms produce false alarms (calling maintenance issues "theft") and missed alerts (calling theft "fluctuation"). Evaluate platforms on workflow depth, not just fuel features. Sign up free to evaluate integrated fuel + maintenance workflow.
Recover Tens of Thousands in Invisible Fuel Losses
500+ fleets deploy unified fuel + maintenance workflow on our truck inspection and maintenance software: real-time visibility, per-vehicle reconciliation, MPG trend tracking, driver scorecards, theft detection, IFTA automation, and maintenance correlation. The 2026 standard for fleet fuel cost control — 10-25% reduction in 90 days.