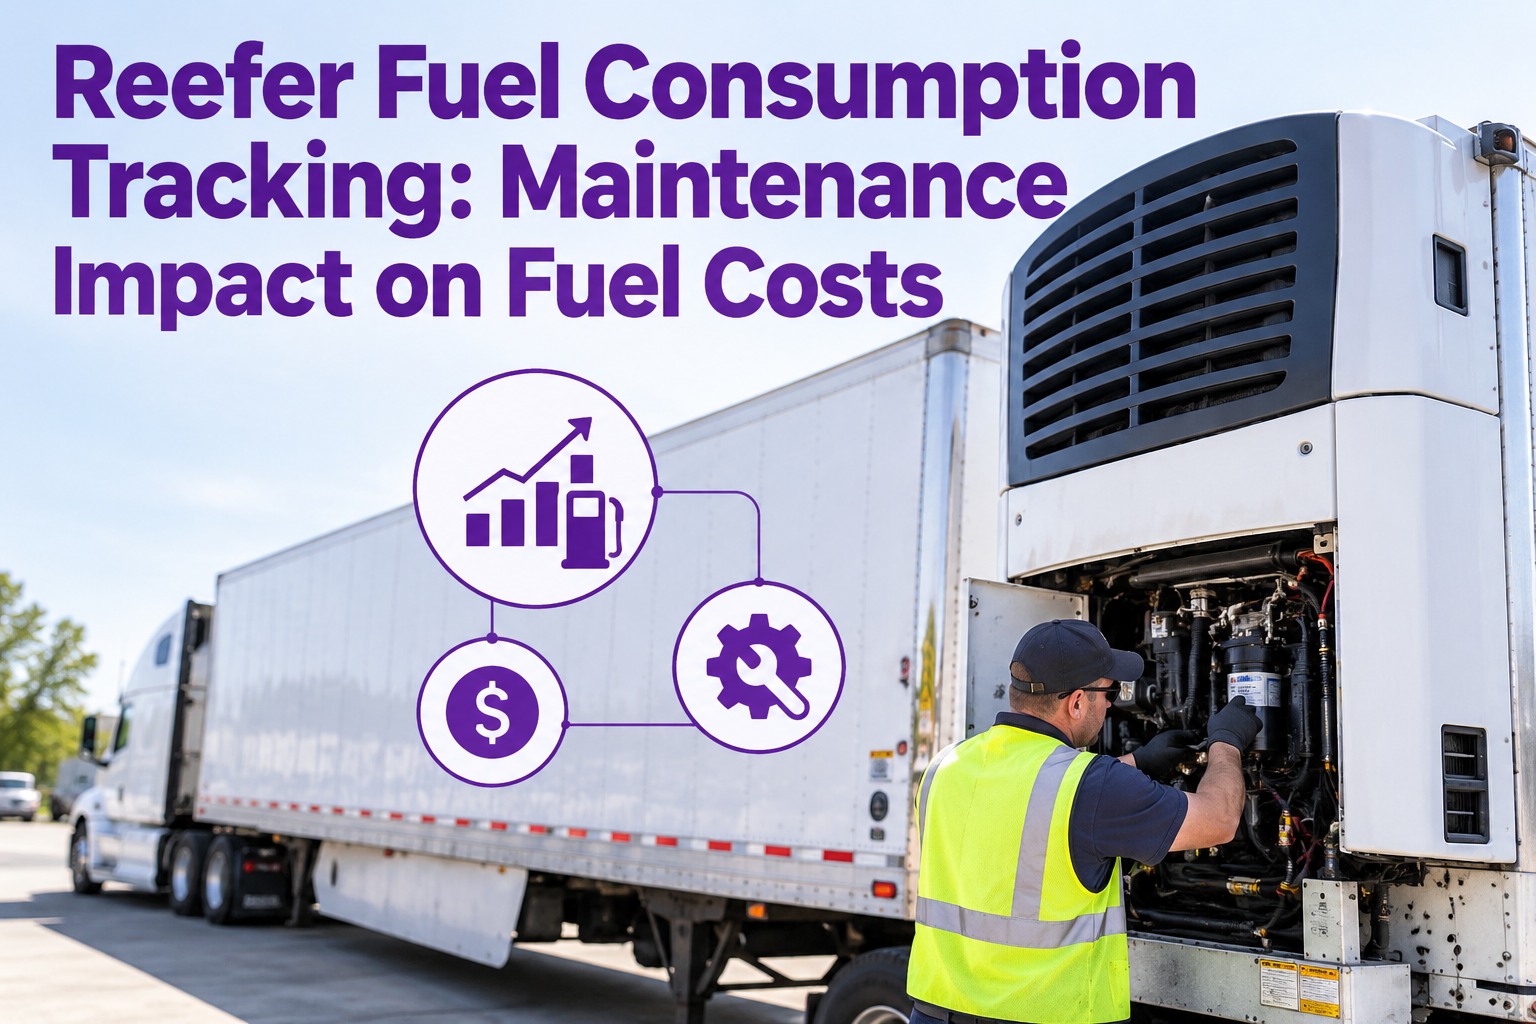
A reefer trailer is a second diesel engine. It burns 0.4–1.5 gallons an hour, 18–24 hours a day, whether the tractor is moving or parked. On a 40-unit reefer fleet that's $150K–$300K a year in diesel most CFOs never see broken out — and the biggest lever on the burn rate is maintenance. A worn belt, a torn door seal, a low refrigerant charge, or a fouled coil each push burn 15% or more. Truck Inspection & Maintenance Management Software tracks reefer engine hours as a separate meter, sequences hour-based TRU PMs, correlates fuel burn against maintenance state per unit, and flags the trailers quietly draining the budget. Start free and track reefer fuel + maintenance in TIM.
Every Reefer Is a Second Diesel Engine — TIM Tracks What It's Burning and Why
Reefer fuel burn is not a fixed number. It moves with setpoint temperature, ambient conditions, load type, door-open frequency, and — most controllable — the maintenance state of the unit. Fleets that break reefer fuel out as its own P&L line and correlate it to TRU maintenance cut consumption 15–25% within a quarter. Truck Inspection & Maintenance Management Software runs the full cadence: hour-based PMs on the TRU, fuel-burn tracking per trailer, wear-item alerts before the burn rate climbs, work-order routing when it does.
The Burn-Rate Matrix — What Every Reefer Costs Per Hour
Understanding the matrix is what separates fleets that predict fuel spend from fleets that get surprised by it every month. Below is the working reference TIM applies against each TRU based on its assigned load type and route conditions.
| Setpoint | Load type | 60°F ambient | 85°F ambient | 100°F ambient | 24 hr total |
|---|---|---|---|---|---|
| +34°F | Fresh produce · continuous | 0.5 gph | 0.7 gph | 0.9 gph | 12–22 gal |
| +34°F | Chilled · cycle-sentry | 0.35 gph | 0.5 gph | 0.7 gph | 8–17 gal |
| 0°F | Frozen · continuous | 0.7 gph | 0.9 gph | 1.1 gph | 17–26 gal |
| -10°F | Deep frozen · continuous | 0.9 gph | 1.1 gph | 1.3 gph | 22–31 gal |
| Any | Older unit (>5 yr) continuous | 1.2 gph | 1.6 gph | 2.0–3.0 gph | 29–72 gal |
The Maintenance-to-Fuel Penalty Table — What Neglected Wear Costs
Every skipped service on a TRU has a fuel-burn cost. The table below quantifies the 5 wear items with the biggest burn-penalty impact — the checklist TIM sequences into the hour-based PM template.
Continuous Run vs Cycle-Sentry — The Mode Decision That Doubles Burn
Every Thermo King and Carrier TRU offers two operating modes. Choosing wrong per load is one of the highest-cost operational errors in reefer operations. TIM captures the mode per load and flags the wrong choice.
Reefer Hours · Burn Rate · Maintenance State · Mode Compliance — All in TIM
Truck Inspection & Maintenance Management Software tracks each TRU as a separate asset with its own hour meter, its own PM schedule, its own fuel line. Burn rate correlates back to the maintenance state and load mode. The trailers quietly draining the budget stop being invisible.
The 4-Input Burn Forecast — What TIM Predicts Per Trailer
Reefer fuel spend for the coming month isn't a fleet-average estimate. It's a calculation TIM runs per trailer using four inputs — and it's how the ops manager knows which units to service before they cost the fleet.
Fresh produce +34°F, frozen 0°F, deep frozen -10°F. Sets the baseline gph from the matrix.
Weather-service temperature along the lane. A frozen load through Phoenix in July burns 60% more than the same load through Portland in October.
Recent PM done, seals inspected, refrigerant charged, belts inspected. Apply penalty multiplier for any open wear item.
Predicted gallons per shift. Rolls up to weekly and monthly per-trailer + per-fleet totals for the ops review.
Frequently Asked Questions
Every Reefer Trailer Broken Out on Its Own Fuel Line — With the Maintenance State That Explains It
TIM tracks TRU hours, forecasts burn per trailer, correlates against wear-item state, and files the off-road diesel for the tax credit. The second diesel engine on every reefer stops being the fleet's biggest hidden line.