The 2026 math on truck breakdowns is brutal. Operating costs sit at $2.25 per mile. For-hire margins run at -2.3%. The average truck loses 8.7 days annually to unplanned downtime — and 78% of those breakdowns trace back to preventable failures with defects that could have been caught weeks earlier. A single roadside breakdown event compounds across tow fees, emergency labor at premium rates, expedited parts, missed delivery penalties, driver pay during downtime, and customer relationship damage that doesn't show up on the invoice but absolutely shows up in next quarter's renewals. Most fleets quietly absorb $5,100–$18,600 per truck per year in breakdown-related costs they never separately track.
The good news: breakdowns follow predictable patterns. Tires cause 53.5% of roadside breakdowns according to TMC data. Brakes account for 29% of truck accidents. Electrical and fuel systems round out the top five failure categories — and every one of them generates warning signs days or weeks before the actual failure. Modern fleets that combine structured PM scheduling with telematics-driven early warning detection cut breakdowns by 75% and unplanned downtime by up to 50%. The 2026 best-in-class operators run 95–99% uptime versus the industry average of 88-92%, simply by treating breakdown prevention as an engineered discipline rather than a hope-and-pray exercise.
This guide is the prevention playbook fleet managers actually need: the top 5 breakdown causes with prevention checklists for each, the early warning signs that predict failure, the 7-strategy prevention framework, and the 2026 metrics that prove the program works. Start your free trial to deploy breakdown prevention across every truck in your fleet — free for up to 3 trucks, live in 10 minutes.
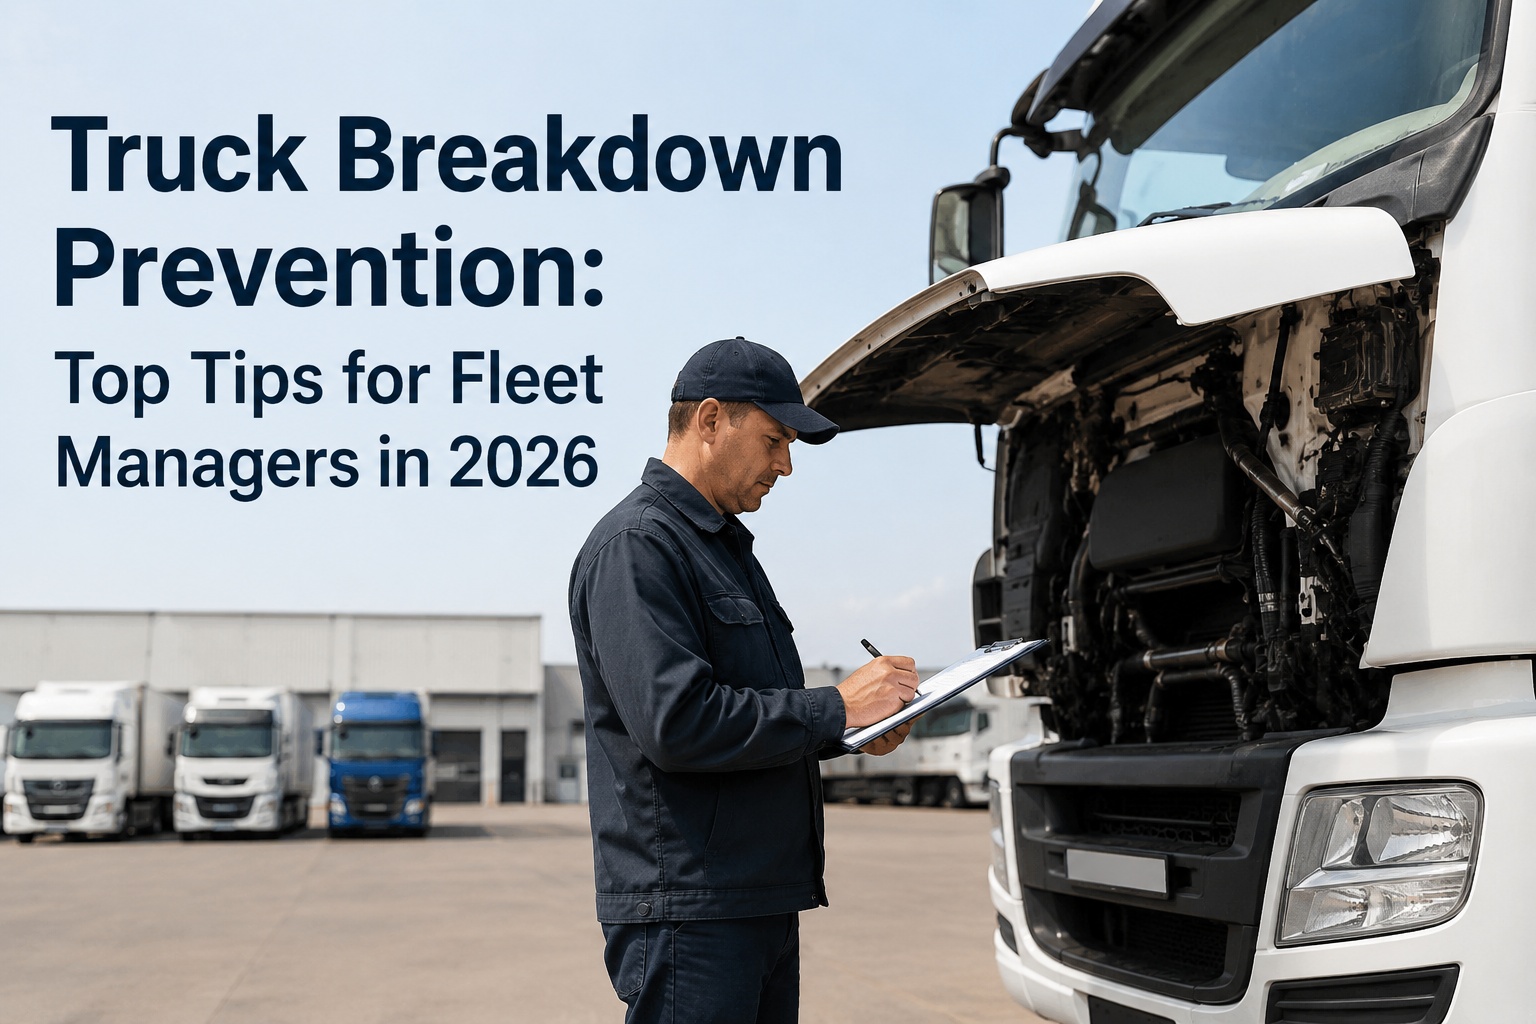
Truck Breakdown Prevention: Top Tips for Fleet Managers in 2026
78% of breakdowns are preventable. The 2026 playbook to cut breakdowns by 75%, reduce downtime by up to 50%, and reach 95–99% uptime — with the early warning signs, top failure categories, and prevention framework that actually works.
Quick Answer: How to Prevent Truck Breakdowns
Truck breakdown prevention combines six integrated practices to engineer roadside failures out of fleet operations: (1) structured PM scheduling with multi-trigger logic (mileage/hours/calendar), (2) daily DVIRs per §396.11 to catch driver-visible defects, (3) telematics-driven early warning detection via embedded sensors monitoring temperature, pressure, voltage, and vibration patterns, (4) predictive analytics identifying pre-failure trends weeks before failure, (5) defect-to-work-order automation closing the loop from inspection to repair, and (6) KPI tracking measuring PM compliance, downtime, and breakdown frequency. Fleets implementing all six practices achieve 75% breakdown reduction, up to 50% downtime cut, and reach 95–99% uptime versus the industry average of 88-92%.
The Top 5 Breakdown Causes (And What % They Represent)
Breakdowns aren't random — they cluster around the same five failure categories across virtually every fleet. Knowing the percentages tells you where to focus prevention spending first. Contact our sales team for a fleet-specific breakdown analysis based on your historical data.
The 7 Early Warning Signs That Predict Breakdowns
Every breakdown is a failure that started weeks earlier with a warning sign someone missed. Train drivers and shop staff to recognize these seven patterns and intervene before the truck strands on the side of the road.
The 7-Strategy Prevention Playbook
Effective breakdown prevention isn't one tactic — it's seven interlocking strategies running simultaneously. Top-performing fleets in 2026 execute all seven; reactive fleets execute none. Sign up free to deploy all 7 strategies through one platform.
The Hidden Cost of a Single Breakdown
The repair invoice is just the tip of the iceberg. The full cost of a breakdown event compounds across multiple categories most fleets never separately track. Here's the real anatomy of one breakdown day.
A fleet averaging 3 moderate breakdowns per truck per year pays $5,100–$18,600 per vehicle beyond routine maintenance — the breakdown tax that compounds annually. Talk to our sales team to model the breakdown tax for your specific fleet.
Industry Benchmarks: Where Does Your Fleet Stand?
Use these 2026 benchmarks to assess your current breakdown prevention performance. Each metric shows what reactive vs proactive vs best-in-class fleets actually achieve.
| Metric | Reactive Fleet | Average Fleet | Best-in-Class |
|---|---|---|---|
| Unplanned Downtime | 12-15% | 5-8% | <3% |
| Annual Days Lost / Truck | 20-30 days | 8.7 days | <5 days |
| Breakdowns / Truck / Year | 4-6 | 2-3 | <1 |
| PM Compliance | <75% | 80-90% | 95-99% |
| Cost Per Mile | $1.20+ | $0.65-$0.85 | $0.42-$0.55 |
| Reactive vs Planned | 40%+ reactive | 15-25% reactive | <5% reactive |
| Fleet Uptime | 85-88% | 92-95% | 97-99% |
Frequently Asked Questions
Industry data shows 78% of fleet breakdowns are preventable through structured PM scheduling and early defect detection. Deferred PM is the single biggest trigger — components that should have been replaced at the previous service interval fail before the next one. Of the remaining 22%, roughly half are addressable through telematics-driven predictive maintenance that catches pre-failure patterns weeks early. Only ~10% of breakdowns are genuinely unforeseeable (impact damage, lightning strikes, contamination events). Start your free trial to attack the 90% that ARE preventable.
Tires — the Technology & Maintenance Council (TMC) reports tires cause 53.5% of roadside breakdowns. The breakdown of tire failures: underinflation accelerating wear, uneven wear from misalignment, age-related sidewall failure (tires aging out even with good tread), and impact damage from curbs and road debris. Prevention is straightforward: daily pressure checks, monthly tread depth measurement, rotation per OEM pattern, retread limit enforcement, and age-based retirement policies (typically 6 years for trailer tires, 4 years for steer tires).
Telematics devices and OEM-embedded sensors continuously monitor hundreds of parameters: engine temperature, oil pressure, battery voltage, tire pressure, vibration patterns. AI models learn each truck's baseline and flag pre-failure drift — engine running 5°F hotter than baseline for two weeks, battery voltage trending down across cycles, abnormal vibration emerging in a specific frequency band. These patterns emerge weeks before mechanical failure. The 90%+ of 2026 vehicles shipping with embedded telematics make this prevention nearly automatic. Contact our sales team for telematics integration setup.
A moderate breakdown event averages $2,648-$8,060+ per occurrence when fully accounted. The repair invoice is just the start — add tow fees ($500-$1,200), emergency labor at premium rates ($800-$2,400), expedited parts versus stocked alternatives ($400-$1,500), driver pay during downtime ($300-$700), lost revenue ($448-$760/day idle), and missed delivery penalties ($200-$1,500). A fleet averaging 3 moderate breakdowns per truck annually pays $5,100-$18,600 per vehicle in breakdown tax beyond routine maintenance. Sign up free to track real breakdown costs across your fleet.
Yes — and the data backs it up across multiple industry studies. Fleets implementing the full predictive maintenance stack (structured PM + telematics + AI analytics + defect automation) report 75% breakdown reduction and up to 50% unplanned downtime cut within 12-18 months of full deployment. The mechanism: catching pre-failure patterns weeks before mechanical failure converts what would have been a roadside breakdown into a scheduled shop visit. ROI typically hits within 6-12 months for fleets with 10+ vehicles. Smaller fleets see proportional gains starting with strong PM compliance plus telematics.
The threshold is 95%. Fleets below 75% PM compliance experience dramatically more breakdowns — deferred services create cascading failures. Between 75-90% compliance, you're catching most issues but missing enough to drive 2-3 preventable breakdowns per truck annually. At 95%+ compliance, breakdown frequency drops below 1 per truck per year. The compliance number matters more than which specific tasks you complete — consistency beats heroic effort. Talk to our sales team for a PM compliance audit against the 95% benchmark.
Deploy the Complete Breakdown Prevention Playbook
500+ fleets execute all 7 prevention strategies on one platform: structured PM scheduling, mobile DVIRs, telematics-driven early warning, AI predictive analytics, defect-to-work-order automation, driver behavior coaching, and KPI dashboards. Stop paying the breakdown tax — engineer roadside failures out of your operations.