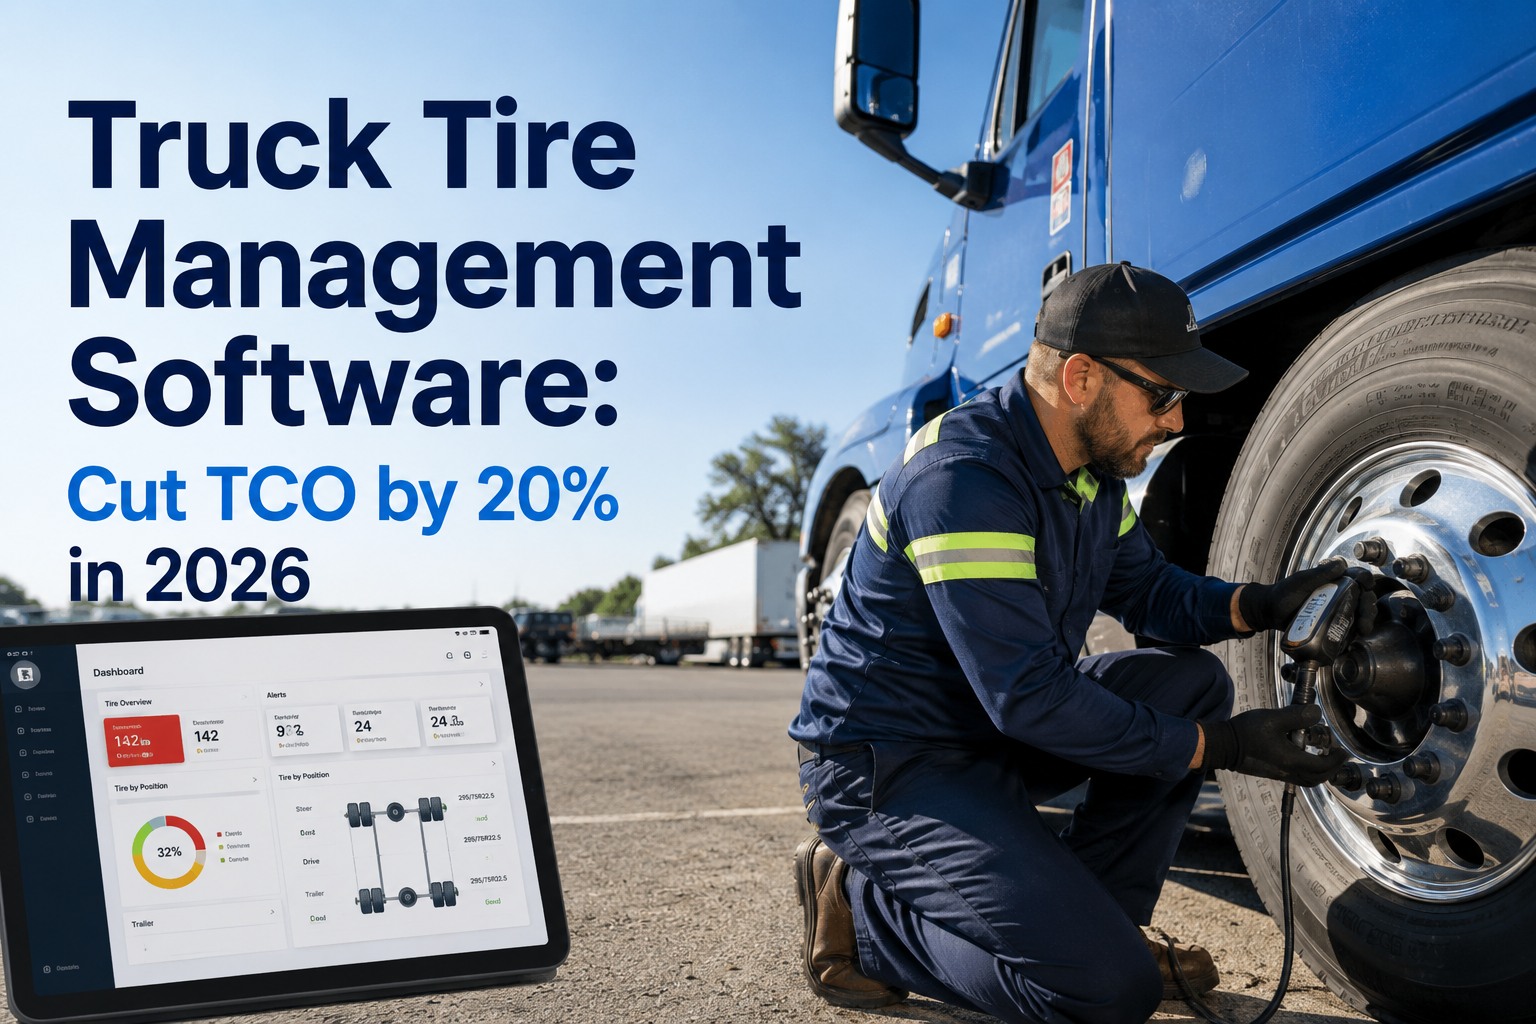
Tires are the single largest variable cost in most fleet budgets — and one of the most mismanaged. A tire running 8 PSI low wears its shoulders 25% faster and burns 3% more fuel on every mile. A casing scrapped at 4/32" that could have been retreaded at 2/32" throws away $180. Multiply those across a fleet and the average truck quietly wastes $2,500 to $4,000 a year in avoidable tire spend. The fix is not a different supplier — it is per-tire data. Fleets that manage tires systematically cut total cost of ownership 15–25% without changing a single brand. This guide shows the four leaks draining your tire budget and how tire management software seals each one. Start cutting tire TCO free.
Truck Tire Management Software: Cut TCO by 20% in 2026
Pressure monitoring, retread tracking, and cost-per-mile by position — turning tires from a runaway expense into a managed asset. Same suppliers, far lower spend.
The Four Leaks Draining Your Tire Budget
Every dollar wasted on tires traces back to one of four leaks — and all four share a single trait: they are invisible without per-tire records. A paper pre-trip cannot trend a slow leak. A whiteboard cannot tell you a casing is one rotation away from disqualifying for retread. Here is where the money goes.
Accounts for roughly 40% of premature replacements. An 8-PSI deficit wears shoulders 25% faster and costs 3% in fuel — silently, every mile.
Uneven wear from skipped rotations shortens tire life 20–35% and can disqualify good casings from retread even with tread left.
A casing scrapped at 4/32" that qualified for retread is $180 thrown away per tire — a $130 retread replaced by a $550 new tire.
A roadside blowout runs about $850 in service call, labor, and lost time — before the truck even reaches a shop. Nearly all are preventable.
How Each Leak Gets Sealed
Tire management software does not replace your tires or your supplier — it replaces guesswork with per-tire records and timely alerts. Truck Inspection & Maintenance attacks all four leaks at once.
Seal All Four Leaks From One Dashboard
Truck Inspection & Maintenance tracks pressure, rotation, retread eligibility, and cost per tire — so the savings show up on every position, every mile.
The Metric That Changes Everything: Cost Per Mile
Lowest sticker price is the most expensive way to buy tires. Cost per mile — total tire cost divided by miles delivered — is the number that exposes real value. The example below shows why a premium tire that retreads twice beats a cheap tire that can't.
The premium tire costs 50% more up front but delivers roughly 46% lower cost per mile. You only see that with per-tire cost tracking — and it is exactly the data that turns purchasing from habit into strategy. Track CPM by brand and position.
What the Software Tracks
Each tire gets a digital record from mount to retirement. Every event logs against it, building the history that powers alerts, predictions, and purchasing decisions.
TPMS and pre-trip readings trended per tire to catch slow leaks early.
Logged at every PM, with wear rate calculated in 32nds per 10K miles.
Triggered by real mileage and tracked to keep every position even.
Casing eligibility scored continuously so no qualifying tire is scrapped.
All costs divided by miles, compared by brand, model, and position.
Every move between vehicles and positions follows the tire's record.
The Payoff by Fleet Size
The savings are not theoretical. Structured tire management consistently returns a measurable share of operating cost — and tire savings alone typically cover the platform cost within the first operating quarter.
Frequently Asked Questions
It seals the four budget leaks: under-inflation, missed rotations, retread misses, and reactive blowouts. By trending pressure, triggering rotations on real mileage, tracking casing eligibility, and predicting failures, fleets extend tire life and shift to retreads they'd otherwise miss — typically cutting tire TCO 15–25% without changing suppliers.
Cost per mile is total tire cost — purchase, retreads, service, road calls — divided by actual miles delivered. It reveals real value better than sticker price. A premium tire at $450 that retreads twice can deliver roughly 46% lower cost per mile than a $300 budget tire that can't be retreaded, even though it costs 50% more up front.
Yes. Most of a tire's cost is in the casing, so a retread runs 30–50% less than a new tire. Nearly half of replacement truck tires in North America are retreads, and the industry saves over $3 billion a year using them. The catch is timing — a casing scrapped too early is gone, which is why continuous eligibility tracking matters.
Typically within 12 months. With a large share of commercial vehicles running underinflated, the fuel, wear, and blowout costs add up fast — often tens of thousands per year for a mid-size fleet. Combining TPMS alerts with documented pre-trip PSI entry also strengthens compliance under the 2026 CSA changes.
Tire savings alone typically cover the platform cost within the first operating quarter. Pressure and rotation gains show up almost immediately in reduced wear and fuel, while retread and cost-per-mile benefits build as per-tire history accumulates over the first few months.
Turn Your Biggest Variable Cost Into a Managed Asset
Truck Inspection & Maintenance tracks every tire from mount to retirement — pressure, rotation, retread eligibility, and cost per mile — sealing the four leaks that drain your budget and cutting tire TCO by up to 20% with the suppliers you already use.