Most carriers find out their CSA scores are in trouble the same two ways: a warning letter arrives, or the insurance renewal comes back 30% higher. By then the damage has been accumulating for months, because CSA doesn't work the way people assume. It isn't a running tally of violations. It's a percentile — you're scored against comparable carriers, higher is worse, and a violation's impact depends on how serious it was, how recently it happened, and how many inspections you have to spread it across. That's why a small fleet can get wrecked by one brake violation while a larger one absorbs it, and why the same violation that's crushing your score today will hurt far less a year from now. Understanding the math is what turns CSA from a mystery into something you can actively manage. Protect your CSA scores free. This guide breaks down the seven BASICs and their thresholds, how the score is actually calculated, and the levers that move it.
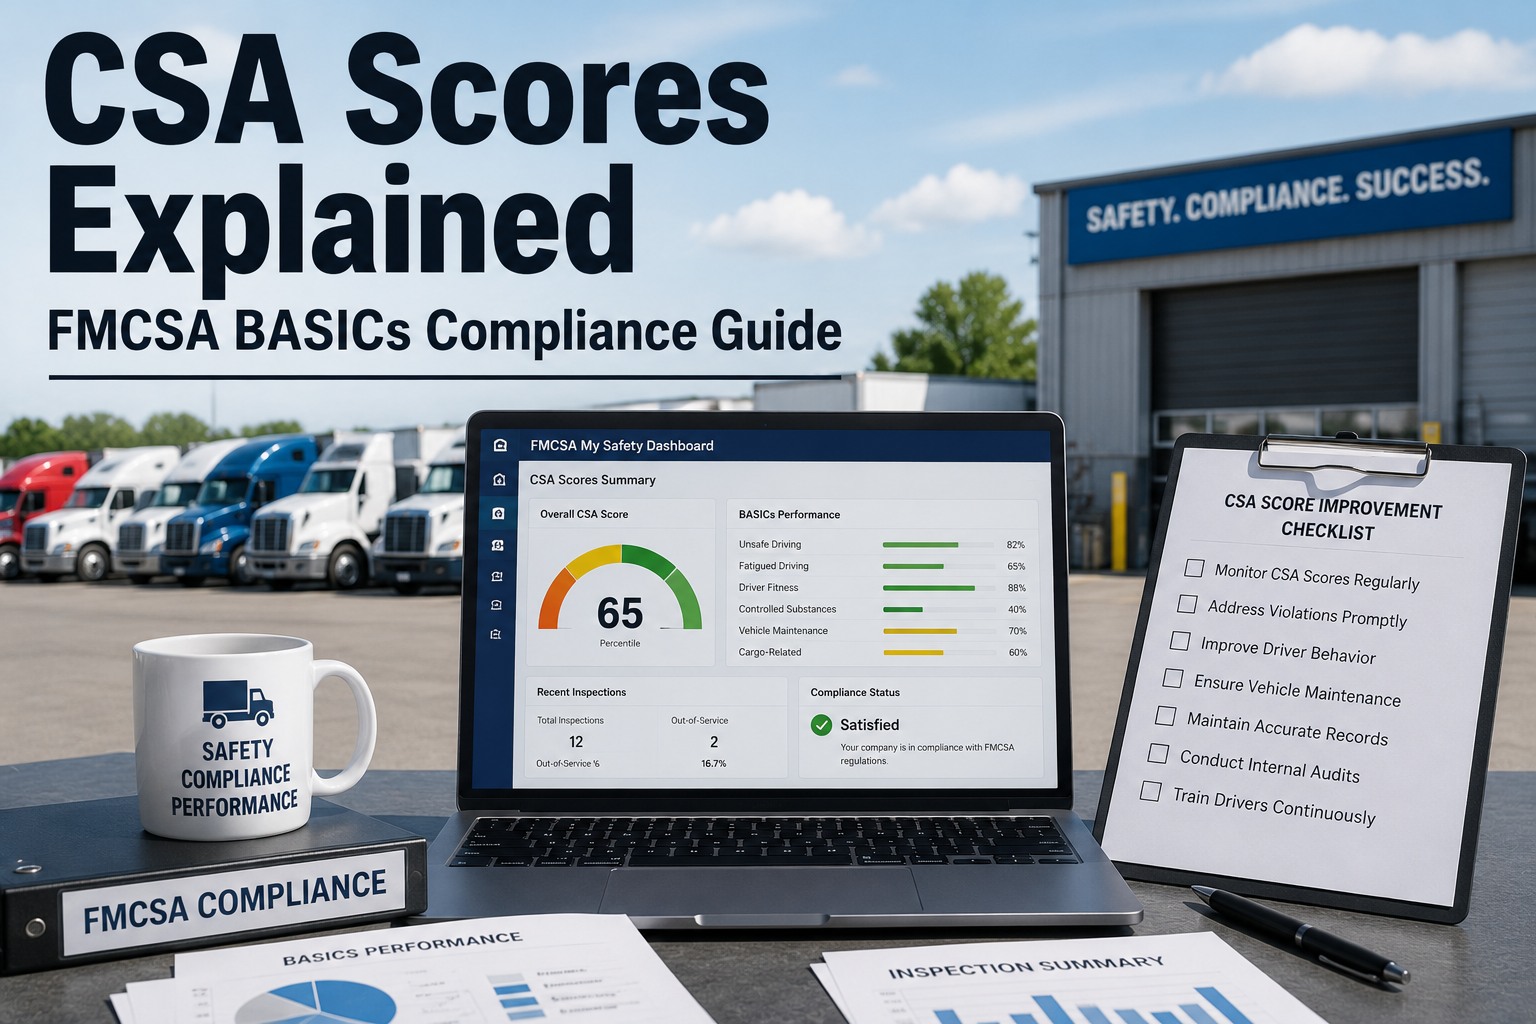
CSA Scores Explained: The FMCSA BASICs Compliance Guide
CSA isn't a violation count — it's a percentile ranking you against your peers, where higher is worse. Learn the seven BASICs, their different thresholds, the severity-and-recency math behind every score, and how to move it.
Higher Is Worse — and Everyone Is Looking
CSA scores run 0 to 100 as percentile rankings, meaning a score of 85 says you're performing worse than 85% of comparable carriers. And the audience for that number goes well beyond FMCSA.
The Seven BASICs
FMCSA evaluates every carrier across seven Behavior Analysis and Safety Improvement Categories, each scored separately. Critically, the thresholds differ — categories with the strongest crash correlation are enforced most strictly.
Speeding, reckless driving, improper lane changes, texting. Strongest crash correlation, so it carries the lowest threshold.
Hours-of-service and ELD violations, driving fatigued. A direct safety risk held to the same strict threshold.
Crash history and severity over 24 months. Crashes count toward frequency regardless of fault.
Brakes, tires, lights, and defects found at roadside. The category most fleets exceed — and the most controllable.
Expired medical certificates, missing endorsements, invalid documentation. Almost entirely preventable with good DQ files.
Drug and alcohol violations, including out-of-service findings. Severe consequences for insurance in particular.
Placarding, packaging, and handling violations for carriers hauling hazardous materials.
Scores update monthly. Log in at csa.fmcsa.dot.gov with your DOT number and PIN to catch movement toward a threshold early.
Start free →How the Score Is Actually Calculated
Here's what most carriers get wrong: FMCSA doesn't just count violations. Every violation is multiplied by how serious it is and how recent it is, then the total is normalized against carriers like you. Three inputs, one percentile.
The Time-Weight Decay Ladder
This is the single most useful thing to understand about CSA, because it cuts both ways: a fresh violation hits hardest, but a clean stretch also repairs your score faster than most managers expect.
Maximum impact. A recent violation carries triple weight in the calculation.
Impact begins to fade as the violation ages past the half-year mark.
Base weight only — still counted, but a fraction of its original sting.
Drops out of the SMS calculation entirely and no longer affects your score.
Vehicle Maintenance Is Your Biggest Controllable Lever
Of the seven BASICs, Vehicle Maintenance is where fleets most often cross the threshold — and it's the one you control most directly. Brakes, tires, and lights make up the majority of out-of-service violations, and nearly all of them are findable before a roadside inspector finds them. Truck Inspection & Maintenance turns pre-trip DVIRs into enforced digital checks, routes every reported defect straight to a work order, and tracks annual inspections and repairs — so the defect that would have become a violation gets caught in your yard instead.
Three Things That Surprise Carriers
The percentile mechanics produce a few counterintuitive effects. Knowing them explains scores that otherwise look unfair or inexplicable.
Your violations are normalized against your inspection volume. With a small denominator, a single violation moves your percentile far more than it would for a large carrier — the same event, a very different score.
Because it's relative to peers, if the industry as a whole gets safer while your violation rate holds steady, your percentile can rise. You're graded on a curve.
Every clean roadside inspection adds to your denominator without adding violations, which pulls your percentile down. Passing inspections isn't neutral — it's a scoring opportunity.
What Happens When You Cross a Threshold
Exceeding an intervention threshold isn't a single event — it starts an escalation. Catching it at the first step is dramatically cheaper than catching it at the last.
How to Actually Improve Your Scores
CSA responds to sustained operational change, not wishful thinking. These are the levers that produce measurable percentile movement.
A disciplined pre-trip program catches the brake, tire, and light defects that drive most out-of-service violations — before an inspector does.
Use the DataQs process to dispute violations recorded in error. An incorrect violation on your record is worth contesting, not absorbing.
Pull Pre-Employment Screening Program records so you're not inheriting a driver's violation history into your own scores.
Driver Fitness violations are almost all preventable — expired medical certificates and missing endorsements are calendar problems, not safety problems.
Focus coaching on the violations that carry the heaviest severity weights, like brake defects and load securement, where each event costs the most.
Scores refresh monthly. Reviewing them on a schedule catches upward movement while it's still a trend and not yet a warning letter.
Frequently Asked Questions
Bad — and this trips up a lot of people, because in most scoring systems higher is better. CSA scores are percentile rankings from 0 to 100 where the number represents how you compare to similar carriers, so a score of 85 in a BASIC means your safety performance in that category is worse than 85% of your peers. Zero is the best possible result. Each of the seven BASICs is scored independently, so you can be excellent in one category and above the intervention threshold in another, and it's the individual category scores that trigger consequences — not an average. That's why fleets track each BASIC separately rather than looking for a single overall number, and why one problem area, like Vehicle Maintenance, can create real trouble even when the rest of your operation is clean. Start a free trial to track each BASIC.
Violations remain in the SMS calculation for 24 months from the violation date, then drop off completely. But they don't count equally the whole time — they're time-weighted, so a violation in the most recent six months carries roughly triple the weight of one that's 12 to 24 months old, with an intermediate weighting in between. This decay is genuinely good news for carriers trying to recover: because recent events dominate the calculation, a sustained clean stretch improves your percentile faster than the damage accumulated. One important caveat is that dropping off your SMS score is not the same as disappearing. Violations persist much longer in the MCMIS and PSP databases, which insurers and prospective employers can access, so a violation can still affect your premiums or a driver's hiring prospects after it's stopped affecting your CSA percentile. Ask about violation trend tracking.
Because CSA is relative, not absolute. Your percentile compares you to carriers with a similar profile, so if the industry as a whole improves while your violation rate stays flat, your ranking can worsen even though nothing about your operation changed — you're graded on a curve that moves. The other common cause is your inspection denominator. Scores are normalized against exposure, meaning your violations are measured against how many inspections you've had, so if your inspection volume drops while old violations are still inside the 24-month window, the same violations get divided by a smaller number and your percentile rises. This is also why smaller fleets are hit harder by any single violation. The practical response to both is the same: accumulate clean inspections, which add to the denominator without adding violations and pull the percentile down. Start free and build a clean record.
For most fleets, Vehicle Maintenance — because it's simultaneously the category carriers most often exceed and the one they control most directly. Brake, tire, and light defects account for the majority of out-of-service violations, and virtually all of them are discoverable during a proper pre-trip inspection before a roadside inspector ever sees the truck. Driver Fitness deserves close second billing for the same reason: violations like expired medical certificates and missing endorsements are calendar-management failures rather than genuine safety problems, and they're entirely preventable with disciplined driver qualification file tracking. Both categories reward exactly the same thing — systematic processes that catch problems on your schedule instead of enforcement's. Categories like Unsafe Driving and HOS matter enormously too, but they require changing driver behavior, which is slower work than fixing a maintenance and documentation process. Start free and fix maintenance first.
It escalates in stages. First, FMCSA sends a warning letter notifying you that a BASIC exceeds its threshold — the cheapest warning you'll ever get, and the right moment to act. Second, enforcement increases roadside inspection targeting on your vehicles, meaning your trucks get pulled over more often, which mathematically creates more opportunities to find violations and compound the problem. Third, continued high scores can trigger an investigation, and in 2025 and 2026 that's often a focused audit aimed specifically at the failing category. Fourth, severe or repeated violations can result in out-of-service orders or restrictions on your operating authority. Running parallel to all of this is the commercial damage: insurers pull SMS data at renewal, and above-threshold scores commonly bring premium surcharges in the 15 to 40% range or outright non-renewal, while brokers and shippers use the same data when awarding freight. Start free and stay below threshold.
Fix the Violations Before They're Violations
CSA rewards carriers who catch defects in the yard instead of at the scale house. Truck Inspection & Maintenance enforces real digital pre-trip inspections, routes every reported defect to a work order and proves the repair, tracks the medical-card and inspection expirations behind Driver Fitness violations, and keeps the maintenance record that a focused audit will ask for — so your most controllable BASIC stops being your worst one.