Every shop scheduler has lived through this exact moment. Monday morning, whiteboard is clean, PMs are booked out for the week, technicians have their assignments. 10:47 AM, a driver calls dispatch — Truck #23, cooling system alarm, coasting to a shoulder on I-40. And in the next 20 minutes, one of two things happens. Either the shop absorbs the emergency into an existing workflow — triaged, scheduled, parts pre-staged, tech assigned, other work minimally disrupted — or the emergency becomes the shop's Monday. PMs slip to next week. Two techs pull off scheduled brake jobs to chase a coolant leak. Parts go on emergency air-freight at 3× cost. The Friday KPI report shows PM compliance dropping from 92% to 78%. And that single emergency event costs the fleet $448-$760 per day in direct downtime alone, plus a 40-60% labor rate premium on the emergency work, plus the cascading disruption to every other truck the two pulled-off techs would have serviced this week. Emergency repairs cost 3-5× their direct repair invoice when the downstream disruption is counted honestly — and 55% of that total cost is administrative and logistical delay, not mechanical work. The difference between the two Monday outcomes isn't shop skill or luck. It's whether the first 20 minutes after the call follow a repeatable triage framework or an improvised scramble. A structured 20-minute triage — severity assessment in 5 minutes, resource decision in 10, scheduling and notification in 5 — absorbs the emergency into an operating system instead of letting it destroy the week. Top-performing fleets running structured triage frameworks achieve 95-99% uptime while cutting emergency repair costs 25-30%. Ready to build a triage framework that absorbs emergencies instead of letting them derail your shop? Sign up free for Truck Inspection & Maintenance today — no credit card required and start running structured emergency repair triage with automatic technician assignment and parts pre-staging, or contact our support team for a personalized walkthrough tailored to your fleet size, shop capacity, and current unplanned-repair volume.
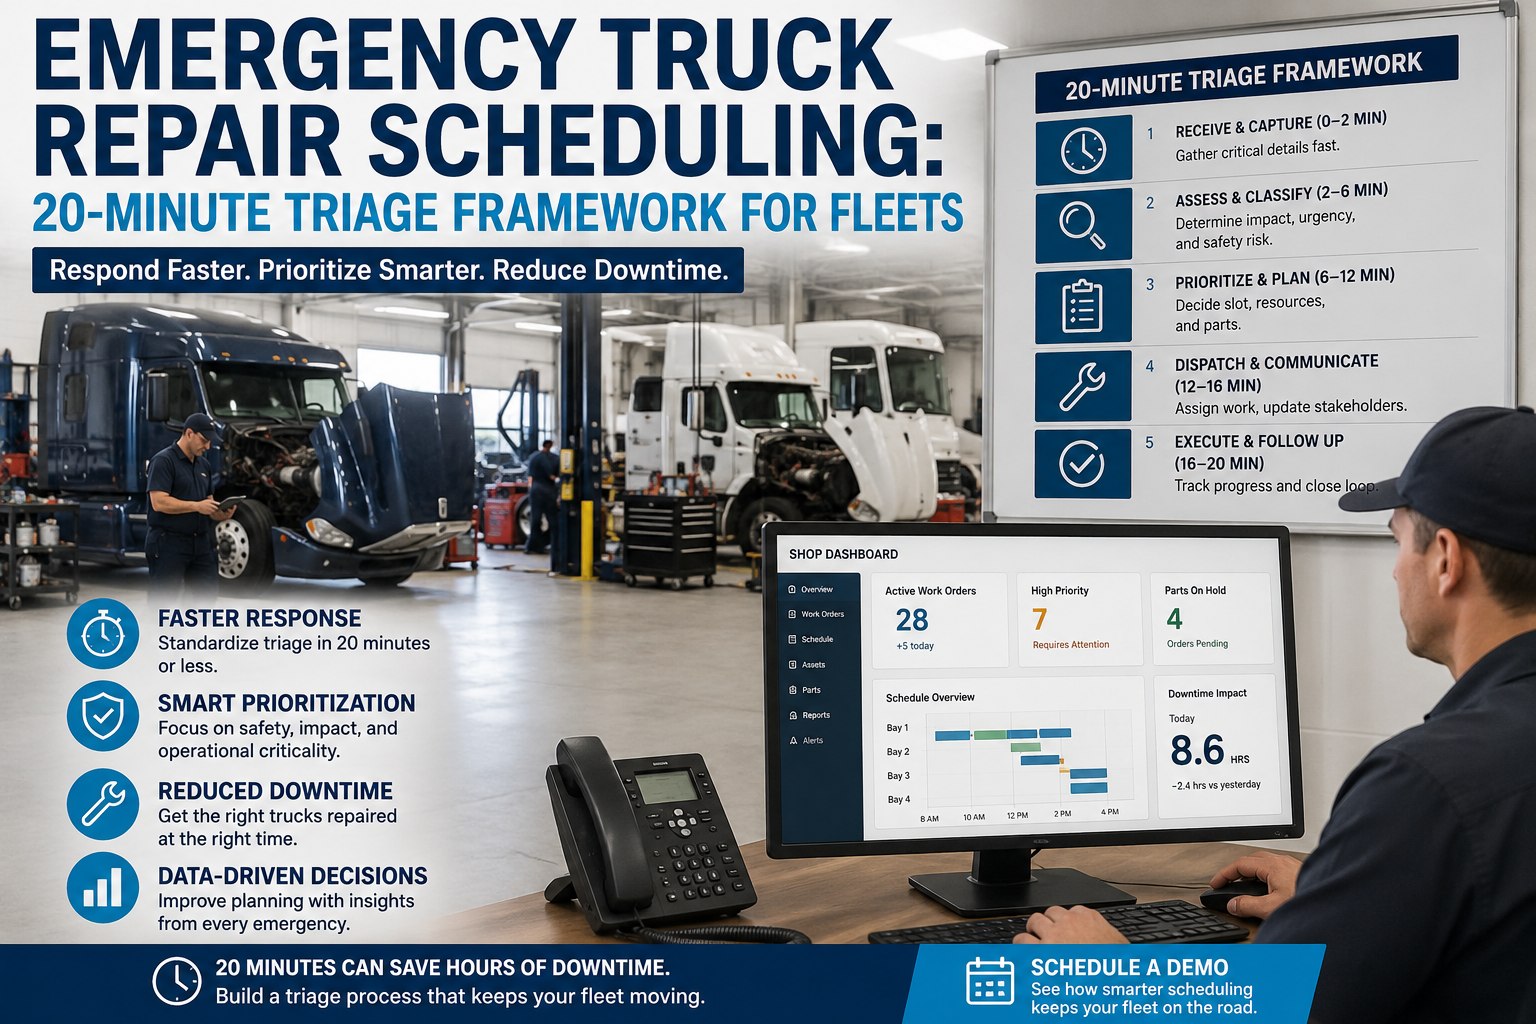
Emergency Truck Repair Scheduling: 20-Minute Triage Framework for Fleets
The first 20 minutes after the call decide whether the emergency stays contained — or takes down the whole week. Here's the framework top fleets use to absorb emergencies without derailing the shop.
The 20-Minute Triage Timeline — Minute-by-Minute
The framework is designed around a fixed 20-minute window with three distinct phases. Each phase has a specific owner, specific inputs, and a specific decision output that hands off cleanly to the next phase.
Severity Classification Matrix — The 4 Levels
Phase 1 of triage assigns one of four severity levels. Each level triggers a specific resource decision path in Phase 2. Getting the level right is what makes the whole framework work.
Resource Decision Tree — Phase 2 in Detail
Once severity is assigned, the resource decision selects the lowest-cost, fastest-recovery option that matches the severity level. Here are the four resource paths with cost multiplier for each.
Absorb every emergency into your operating system — not your Monday
4-level severity classification triggered from mobile app. Resource decision tree with cost multipliers per option. Automatic technician assignment based on capacity and skills. Parts availability check across shop inventory and network vendors. PM schedule protected — emergency work orders auto-slotted into technician calendars without displacing planned work. Truck Inspection & Maintenance software makes structured 20-minute triage the operational default instead of the exception.
What Emergency Repairs Actually Cost — 6 Cost Categories
The repair invoice is only the part of the bill that gets a line item. Six distinct cost categories combine into the actual emergency cost — and only two of them are traditional repair spend.
Building the Framework in Your Shop — 5 Prerequisites
The 20-minute framework isn't just a checklist. It requires 5 operational prerequisites to actually work. Miss any prerequisite and the framework degrades back into an improvised scramble.
Frequently Asked Questions
The 20-minute triage framework is a structured, three-phase process for handling unplanned truck breakdowns without derailing the shop's planned workflow. Phase 1 (minutes 0-5) — Severity Assessment: dispatcher and driver work through inputs (truck ID, location, symptom, driver ability to move truck, load status, time-critical delivery flag) to assign one of four severity levels. Phase 2 (minutes 5-15) — Resource Decision: shop foreman and fleet manager select the lowest-cost, fastest-recovery resource option matching the severity level (in-house shop, mobile mechanic, tow-to-external, or emergency dealer). Phase 3 (minutes 15-20) — Scheduling & Notification: dispatch and shop scheduler create the work order, reserve parts, notify technician, communicate driver ETA, notify customer if load-critical, and protect the PM schedule from disruption. The framework's core discipline: never pull two technicians off scheduled work for one emergency — that's what turns emergencies into week-destroyers. Top-performing fleets running structured triage achieve 95-99% uptime while cutting emergency repair costs 25-30%. Truck Inspection & Maintenance software makes structured triage the operational default.
The repair invoice is only the part of the bill that gets a line item. Six cost categories combine into the actual emergency cost, and only two are traditional repair spend. Direct repair invoice: $3,000-$9,000 (40-60% higher than the same job scheduled). Towing/roadside service: $500-$2,000 (first invoice, often before driver reaches shop). Vehicle downtime: $448-$760 per day per FleetNet America and TMC-ATA benchmarks, with average unplanned events running 2.3-2.4 days. Driver detention pay: $18-$32/hour on the clock waiting. Load recovery/transfer: $800-$3,500 to dispatch a second truck. Customer impact: contract penalties for missed delivery windows plus long-term account erosion. Total emergency cost typically runs 3-5× the direct repair invoice when downstream disruption is counted honestly. For a 50-truck fleet averaging just five unplanned downtime days per vehicle per year, annual exposure lands between $1.1 million and $1.9 million before touching indirect costs. Structured triage cuts this significantly by keeping severity assessment accurate, avoiding unnecessary tow/emergency escalation, and protecting shop capacity for planned work.
The four severity levels drive the resource decision path in Phase 2 of the triage framework. Level 1 — Immediate Danger: truck cannot move safely (brake failure, steering failure, wheel-off event, cargo shift on grade). Response: NOW. Roadside vendor dispatched immediately, driver removal considered, load recovery separate track. Level 2 — Cannot Continue: truck moved to safe location but cannot resume operation (cooling system failure, transmission failure, DEF/aftertreatment shutdown, tire blowout). Response: 1-2 hours. Mobile mechanic or tow to nearest shop, parts staged before tech arrives. Level 3 — Compromised Operation: truck operational but showing fault (check engine light with acceptable DTC, minor air leak, non-critical warning lamp, deferred defect from post-trip). Response: end of route. Complete current run, schedule shop visit for return, parts pre-order. Level 4 — Advisory Fault: fault detected but non-service-affecting (sensor anomaly, minor fluid weep, gradually worsening component identified in DVIR trending). Response: next PM. Add to scheduled work order, track in defect history. Getting the level right is what makes the whole framework work — ambiguous severity triggers automatic Level 2 escalation to avoid guessing low.
The 3-5× cost multiplier comes from four compounding sources. Labor rate premium: emergency labor triggers overtime, night shifts, weekend premiums — 40-60% above standard shop labor rate. Dealer/vendor markup: emergency dealer service runs $225+/hour vs $125 at vetted partner shops. Parts sourcing premium: emergency air-freight parts, expedited shipping, and paying premium for stocked-in-region parts vs standard delivery adds 20-40% to parts cost. Downstream disruption: 55-62% of emergency repair cost is administrative and logistical delay — dispatch reshuffling, driver coordination, parts sourcing, customer notification, alternate truck routing, and load recovery. Only 38-45% of the emergency cost is the actual mechanical work. This is why structured triage matters more than shop speed — accurate severity assessment prevents unnecessary escalation to expensive vendor tiers, protects the 55% that never shows up on the repair invoice. A Level 3 fault mis-classified as Level 1 costs 5-7× what it should have. Contact our team to see Truck Inspection & Maintenance cost-multiplier tracking per work order.
The one rule that separates fleets running 92% PM compliance from those stuck at 78% is: never pull two technicians off scheduled work for one emergency. Structured triage frameworks enforce this rule through a written PM Schedule Protection policy — only one tech can be pulled from planned work per emergency without fleet manager sign-off. Additional protections: (1) route Level 1-2 emergencies to mobile mechanics or tow-to-external when in-house capacity is committed to scheduled work; (2) reserve one flex technician per shift specifically for absorbing emergency work; (3) use severity classification to defer Level 3-4 into planned schedule slots rather than treating every fault as immediate; (4) track PM compliance weekly with named accountability for slippage caused by emergency work encroachment. The alternative — pulling techs off planned work whenever the phone rings — creates the reactive death spiral: PM compliance drops — future breakdowns increase — more emergencies — more PM disruption — compliance drops further. Structured triage breaks the spiral by treating shop capacity as a protected resource, not an infinite one.
Modern fleet maintenance platforms provide 6 core features that make structured triage the operational default. (1) Mobile severity classification: drivers submit fault reports from the truck with severity classification prompts, GPS location, and photo verification — Phase 1 assessment happens in the app rather than on a scratch pad. (2) Resource decision automation: system suggests optimal resource (in-house/mobile/tow/dealer) based on truck location, severity, and cost multiplier, with fleet manager approval workflow for high-cost paths. (3) Live parts inventory: shop stock visibility plus vendor network availability across common failure modes, no scrambling to check parts availability mid-triage. (4) Technician capacity view: shop foreman sees who's committed to planned work vs who has capacity for emergency assignment — protects PM schedule automatically. (5) Cost multiplier tracking: every work order tagged planned vs emergency with automatic cost attribution to enable trend analysis. (6) PM schedule protection: hard rule enforcement preventing multiple tech reassignment without approval. Try free: sign up here.
Truck Inspection & Maintenance software makes the 20-minute triage framework operational default
Mobile severity classification from the truck with GPS and photo verification. Resource decision automation with cost multipliers per option. Live parts inventory and vendor network visibility. Technician capacity view protecting PM schedule from disruption. Cost multiplier tracking (planned vs emergency) per work order. Written PM Schedule Protection rules enforced by the system. Every element of emergency triage automated in one platform — because top-performing fleets running structured triage achieve 95-99% uptime while cutting emergency repair costs 25-30%.