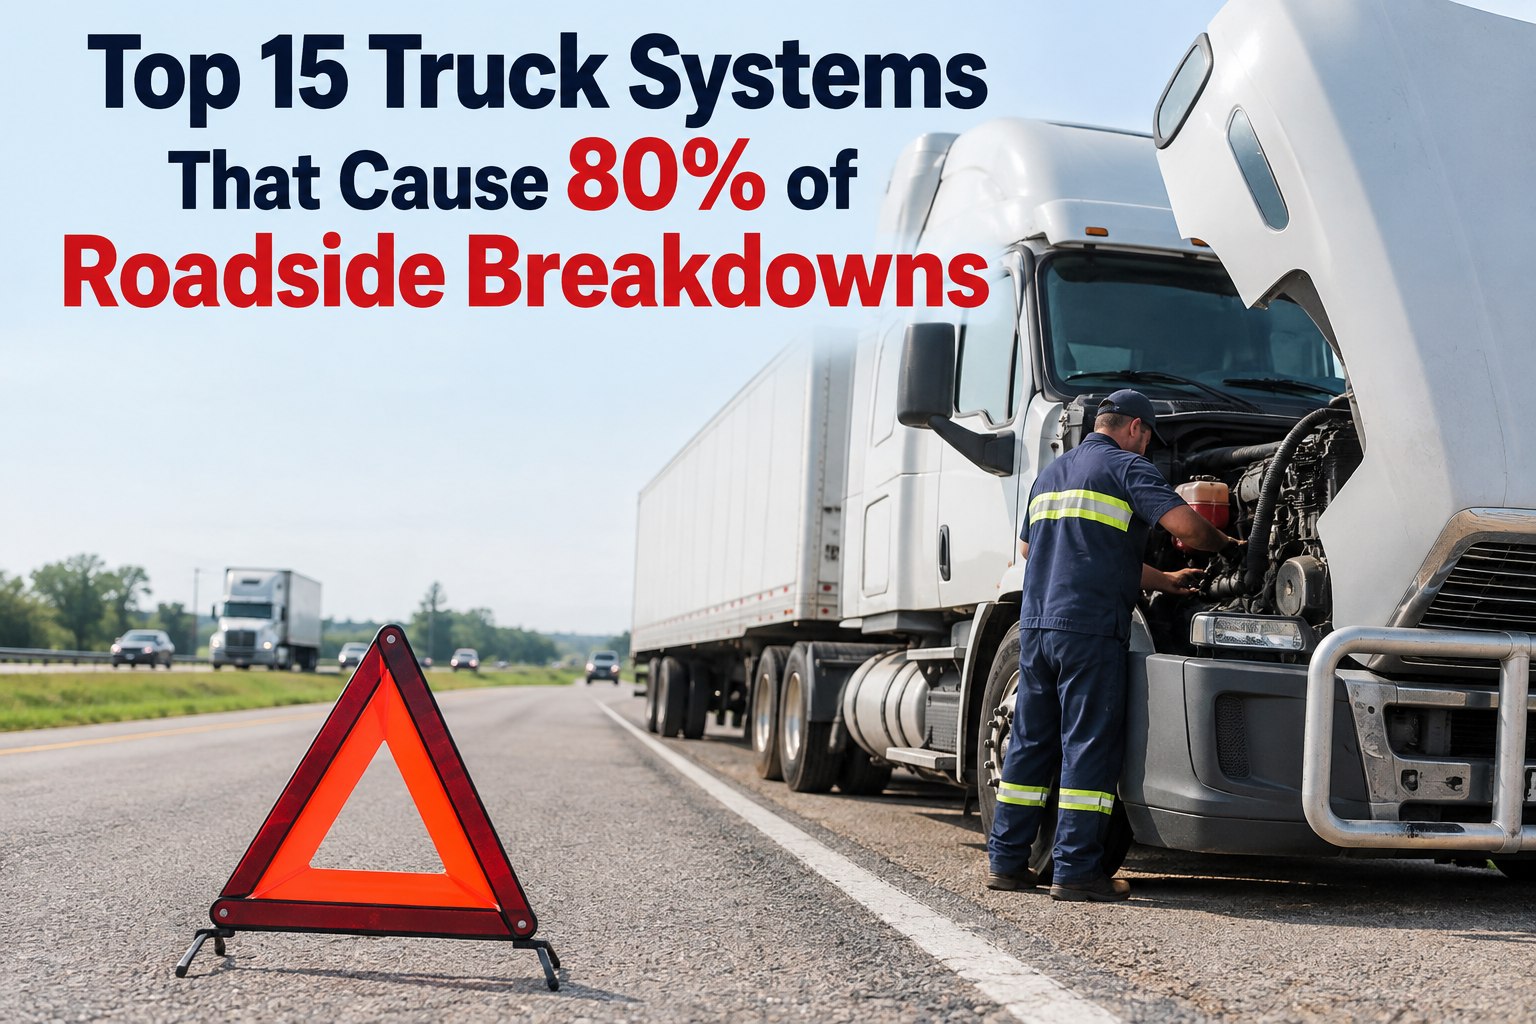
Every roadside breakdown is a fleet manager's nightmare on rolling timer. A $150 service call turns into a $400 mechanic dispatch, then a $1,200 heavy-duty tow, then a missed load, then a customer call nobody wants to make. Industry data is brutal: the Technology & Maintenance Council reports tires cause 53.5% of roadside breakdowns, brakes drive 29% of truck accidents, and the average fleet pays $5,100-$18,600 per vehicle per year in breakdown tax beyond routine maintenance. A $6,000 repair becomes a $12,000-$15,000 financial event once downtime, missed revenue, and customer impact are added. The good news: fleets using predictive diagnostics, structured PM, and digital pre-trip inspections reduce breakdowns by 75% and cut unplanned downtime by 50%. Truck Inspection & Maintenance puts every layer in one platform — driver DVIRs, PM scheduling, fault-code monitoring, and predictive trend analysis — so the next breakdown gets caught in the yard, not on the shoulder of I-80. Start your free trial and stop paying the breakdown tax.
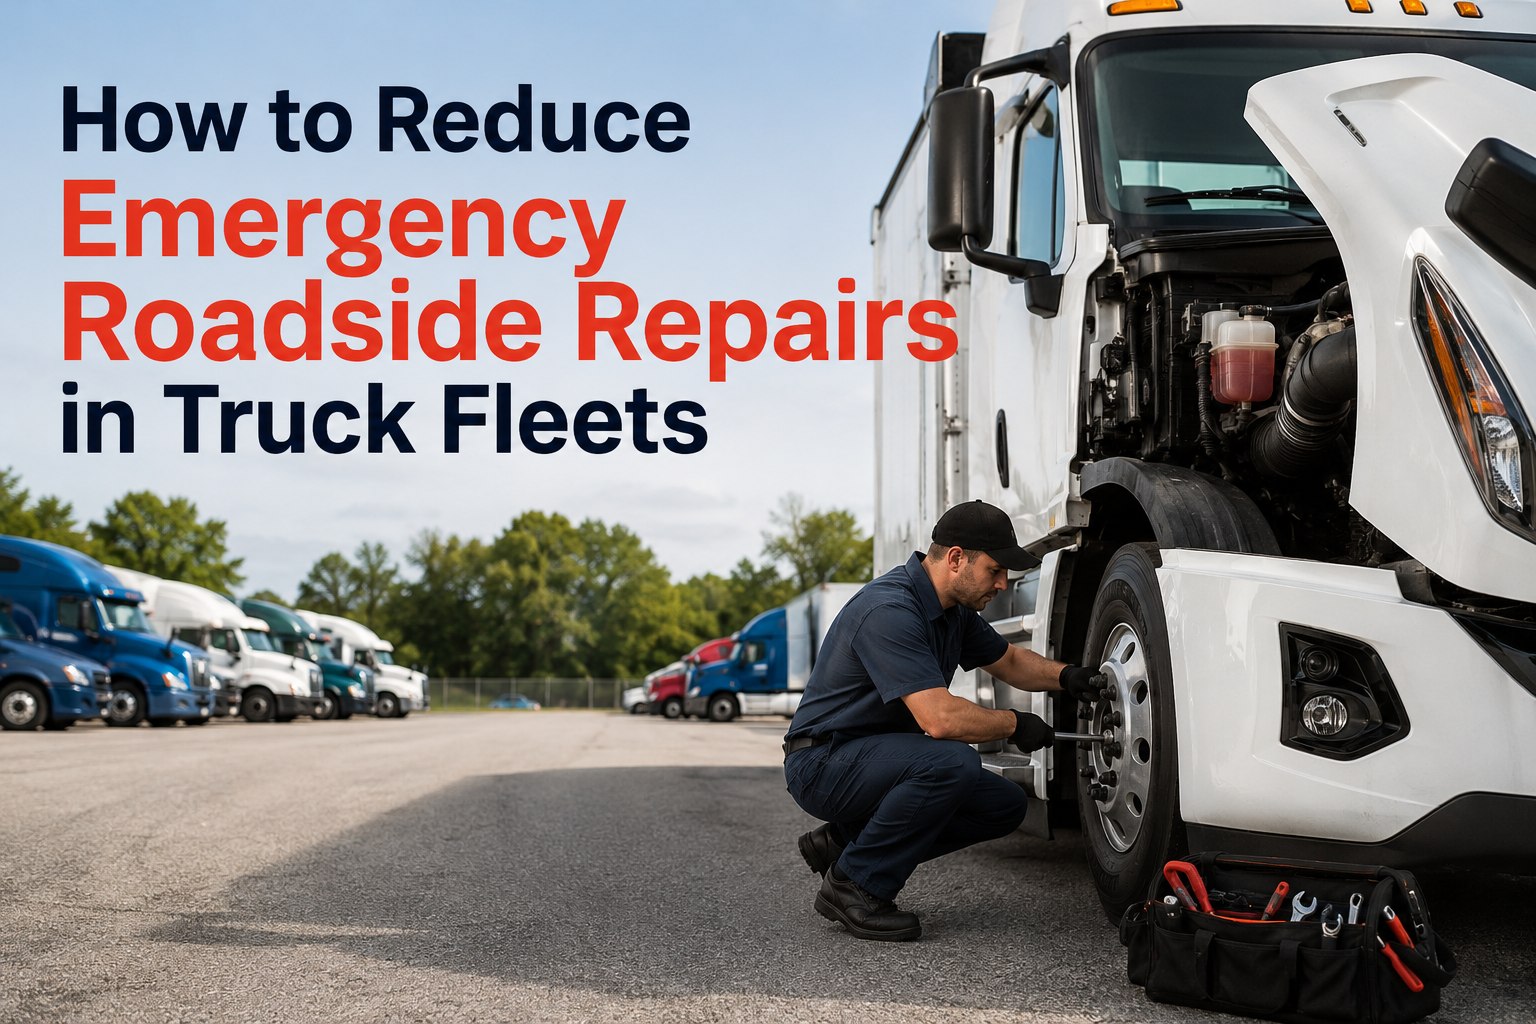
How to Reduce Emergency Roadside Repairs
The five-layer prevention stack that turns breakdowns into routine maintenance — not panic calls.
The True Cost of One Roadside Breakdown — Stacked
The repair bill is the smallest line. The real cost is the cascade — towing, downtime, missed loads, customer impact — that piles on once a truck is sitting on the shoulder. Truck Inspection & Maintenance prevents the cascade by catching what would cause it weeks earlier:
Service Call
Mobile mechanic dispatch, on-site diagnostic. The headline number — and the one most fleets see first.
Heavy-Duty Tow
When repair can't happen on-site. Distance to shop drives the bill; remote breakdowns scale sharply.
Actual Repair
Parts and labor at a non-preferred shop. Outside the normal fleet rate, often with markup.
Downtime & Lost Revenue
Driver pay continues. Load doesn't deliver. Truck doesn't earn. Days off road compound the bill.
Customer Impact
Late delivery penalties, customer call, missed shipping window, potential contract risk on the lane.
Per Breakdown Event
Average fleet pays this 2-4 times per truck per year. Breakdown tax stacks fast at the fleet level.
The 6 Top Causes of Roadside Breakdowns
Roadside failures are not random. They follow predictable patterns the TMC and FMCSA track year after year. Knowing the distribution tells you where prevention investment pays back fastest:
Tires
Underinflation, overloading, uneven wear, age, road hazards. By far the #1 cause — and the most preventable with TPMS plus pressure checks.
Brakes
Worn pads, air leaks, ABS faults. Drives 29% of truck accidents per FMCSA. Catchable on every PM B inspection.
Electrical / Battery
Dead batteries, failed alternators, bad starters. Often strand trucks at 5am with no warning to the driver.
Cooling System
Hose failures, water pump leaks, low coolant. Often heat-of-summer breakdowns on grades.
DEF / DPF / Emissions
Aftertreatment faults trigger derates that strand trucks at low speed. #1 unplanned downtime cause on modern engines.
Fuel / Other
Fuel contamination, injector failures, miscellaneous mechanical. Catchable with fault-code monitoring.
The Warning Signs Catch Rate — Paper vs Digital Inspection
Most roadside failures leave evidence before they happen — a warm brake drum, a tire losing pressure faster than yesterday, an audible air leak at idle. The question is whether the inspection catches it. Truck Inspection & Maintenance changes the catch rate dramatically:
Paper Pre-Trip
Digital Pre-Trip
Catch the next breakdown in the yard, not on I-80.
Truck Inspection & Maintenance combines digital DVIRs, PM scheduling, fault-code monitoring, and predictive trend analysis on every asset — so warning signs become work orders, not roadside calls. Free for up to 3 vehicles. Contact support to plan your rollout.
The 5-Layer Prevention Stack — How Top Fleets Cut Breakdowns 75%
No single strategy prevents roadside repairs alone. The 75% reduction shows up when fleets stack five layers — each catching different failure modes at different times. Truck Inspection & Maintenance runs every layer from one dashboard:
Structured Preventive Maintenance
PM A/B/C intervals scheduled by mileage and engine hours. Tires rotated, brakes adjusted, fluids changed, air filters replaced on cycle — not when something fails.
Driver Pre-Trip & Post-Trip DVIRs
Guided digital checklists catch warning signs early — soft hose, weeping water pump, low tire, brake noise. Photo evidence routes to maintenance same shift.
Telematics & Fault Code Monitoring
OEM-embedded sensors stream engine temp, oil pressure, battery voltage, tire pressure, brake wear continuously. Fault codes trigger work orders before driver notices.
Predictive Trend Analysis
Platform tracks PM completion, defect history, fault patterns, and MPG drift per asset over months — flags trucks heading toward failure before they fail.
Driver Behavior & Training
Hard braking, lugging the engine, ignoring warning lights — driver patterns predict failure modes. Scorecards convert behavior into measurable reduction.
The Reduction Stack — What 75% Actually Looks Like
Visualizing the cumulative reduction shows why the 5-layer approach works — each layer catches what the previous one missed. A 25-truck fleet running all five sees the breakdown rate fall in stages:
Frequently Asked Questions
What causes the most roadside breakdowns in trucking?
Tires drive 53.5% of all roadside breakdowns according to TMC data — underinflation, overloading, uneven wear, and age. Brakes are second at roughly 14% of breakdowns (and 29% of truck accidents per FMCSA). Electrical, cooling, and emissions/DPF round out the top six. Each is catchable with the right combination of PM, digital inspections, and fault-code monitoring.
How much does a roadside breakdown cost on average?
$2,950-$12,600 per event when all costs are stacked: service call ($150-$400), tow ($300-$1,200), repair ($500-$2,500), downtime/lost revenue ($1,500-$5,000), and customer impact ($500-$3,500). Average fleets pay this 2-4 times per truck per year — $5,100-$18,600 in annual breakdown tax beyond routine maintenance. Sign up free to start tracking breakdown trends.
How does Truck Inspection & Maintenance prevent breakdowns?
The platform runs the 5-layer prevention stack from one dashboard: structured PM scheduling by mileage/hours, digital DVIRs with photo evidence and auto-routing, fault-code monitoring from OEM telematics, predictive trend analysis per asset, and driver behavior scorecards. Fleets running the full stack typically see 75% breakdown reduction within 6-12 months.
Is digital pre-trip inspection more effective than paper?
Significantly — roughly 85% catch rate vs 35% for paper. Guided checklists force every step, photo capture documents defects, GPS tags location, and defects auto-route to maintenance same shift. Paper inspections lose to time pressure, illegible writing, missing forms, and days of lag between defect identification and repair.
What's the single biggest ROI move for breakdown reduction?
Structured preventive maintenance, almost always. Moving from reactive maintenance to scheduled PM A/B/C cycles by mileage and engine hours cuts breakdowns roughly 40% on its own. Add digital DVIRs and you're at 60% reduction. The remaining layers add incremental gains but PM is the foundation.
Will this work for a small fleet?
Yes — the ROI math is actually better at smaller fleet sizes because every avoided breakdown represents a higher percentage of fixed costs. The free tier covers up to 3 vehicles, so small fleets can pilot the entire workflow at zero cost. Talk to our team for a fleet-sized ROI walkthrough.
Catch the failure in the yard, not on the shoulder.
Truck Inspection & Maintenance combines structured PM, digital DVIRs, fault-code monitoring, and predictive trend analysis on every asset — so warning signs become work orders instead of midnight tow bills. Free for up to 3 vehicles. No hardware. No contracts.