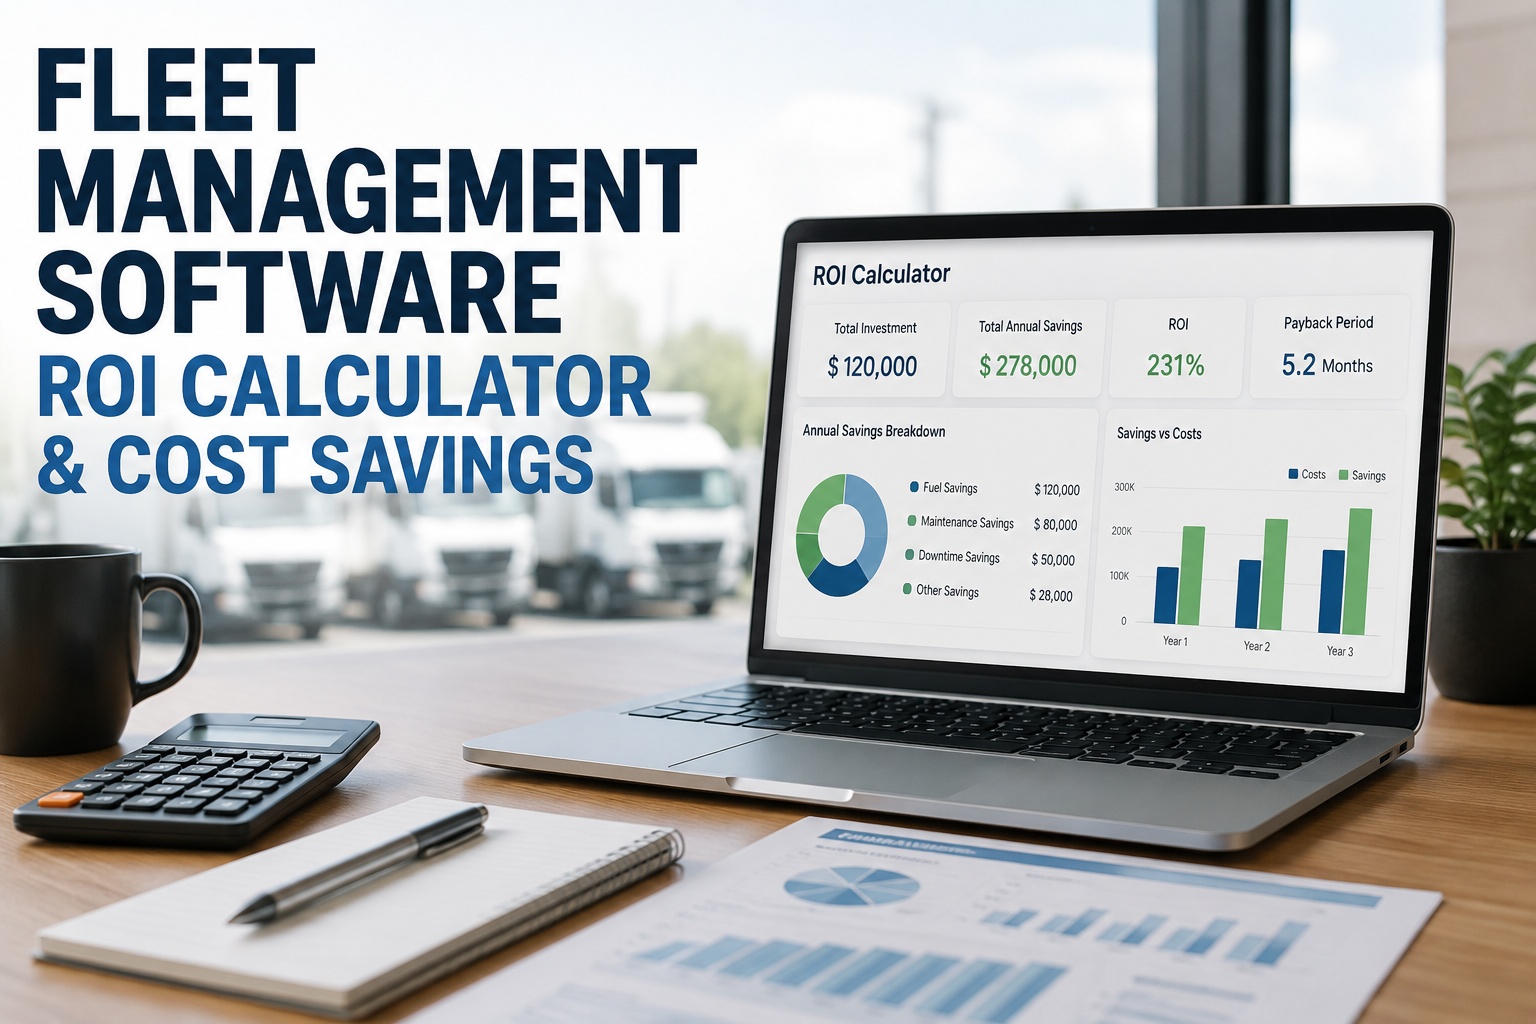
The single question every fleet manager gets asked before software gets approved is: "What's this actually going to save us?" Most vendor pages answer with a demo request. This one answers with a calculator. Below, you'll find a live ROI tool that takes your fleet size, fuel spend, maintenance budget, and downtime cost — and returns your projected annual savings, monthly savings, and payback period in weeks. Behind the calculator, we've broken down exactly where those savings come from, category by category, using benchmark data from the 2026 fleet-technology surveys. Prefer to see it live on your operation? Start your free trial and see the numbers on your actual assets, or reach out to our support team for a walkthrough on your specific fleet.
Fleet Management Software ROI Calculator: See Your Real Annual Savings
Enter your fleet's actual numbers. Get an instant projection of annual savings, monthly cost impact, and payback period — grounded in benchmark data from surveys of 500+ fleet managers.
Calculate Your Fleet's ROI
Plug in what you know. Numbers update the moment you type. Assumptions used follow industry benchmarks — see the "how savings stack" section below for the full breakdown.
Your Fleet Today
Your Projected ROI
Where the Savings Actually Come From
Every dollar fleet software saves traces back to one of three core buckets. Understanding what's inside each bucket tells you which parts of the platform matter most for your specific fleet.
The Hidden 4th Bucket: Admin & Compliance
The three headline buckets get the credit, but there's a fourth bucket that quietly compounds — administrative efficiency and compliance risk reduction. It doesn't show up in the calculator above because it's harder to quantify per-vehicle, but it's often the difference between "good ROI" and "great ROI".
Realistic ROI by Fleet Size
Every fleet delivers positive ROI, but the shape of that return changes with scale. Here's what the industry benchmarks show across fleet sizes.
First prevented breakdown often covers months of software. Percentage ROI is highest at this scale.
Sweet spot for software ROI. Enough scale for compounding savings, small enough for fast rollout.
Fastest payback in absolute terms. Per-vehicle savings compound massively at scale.
Stop calculating hypotheticals
Start a free trial and see the numbers on your actual fleet. First prevented breakdown usually covers the first few months of software cost.
The 6-Step ROI Calculation Method
Want to build the business case yourself before signing anything? This is the exact process fleet managers use when presenting to finance and leadership.
What to Watch for in the Business Case
Not every "ROI projection" from a vendor holds up under scrutiny. Here's how to pressure-test any savings claim — including ours.
Frequently Asked Questions
Industry surveys show 47% of fleets hit positive ROI in under 12 months, with mid-range software typically paying back in 5–7 weeks. Many fleets see the first prevented breakdown cover 2–3 months of subscription cost — but the sustained ROI is what matters for the business case.
3–5x returns in the first year are typical across small and mid-size fleets. Large fleets (100+ vehicles) commonly see 400–700% ROI over 24 months as savings compound. Element Fleet Management data pegs downtime alone at $448–$760 per vehicle per day — one prevented multi-day breakdown can equal months of software cost.
Basic platforms run $15–$25 per vehicle per month. Mid-range with telematics and PM scheduling runs $25–$45. Enterprise with AI analytics, video telematics, and predictive maintenance runs $45–$80+. Add $100–$300 per vehicle one-time for hardware, plus 10–15% of first-year subscription for onboarding.
Yes — often higher in percentage terms. Small fleets typically see $25K–$75K in annual savings, with payback in 3–6 months. The absolute dollar savings are smaller, but the percentage return is often the highest because a single prevented major failure has bigger relative impact on a small fleet.
Fuel and maintenance together typically deliver 60–70% of total fleet software ROI. Fuel savings show up first (route optimization and idle reduction are near-instant); maintenance savings compound over 3–6 months as PM discipline improves. Downtime reduction stacks on top of both.
Well-managed fleets still see 8–15% total operating cost reduction — mostly through better data visibility, admin automation, and compliance risk reduction. If your PM is already tight, the ROI shifts toward utilization improvement and admin efficiency rather than the emergency-repair reduction that drives ROI for less mature operations.
Stop projecting savings — start capturing them
Log every inspection, work order, cost record, and downtime event on one platform. Auto-flag PM gaps before they become breakdowns. Track cost-per-mile per vehicle. Export DOT audit records in one click. The ROI in the calculator above starts working the day you turn it on.