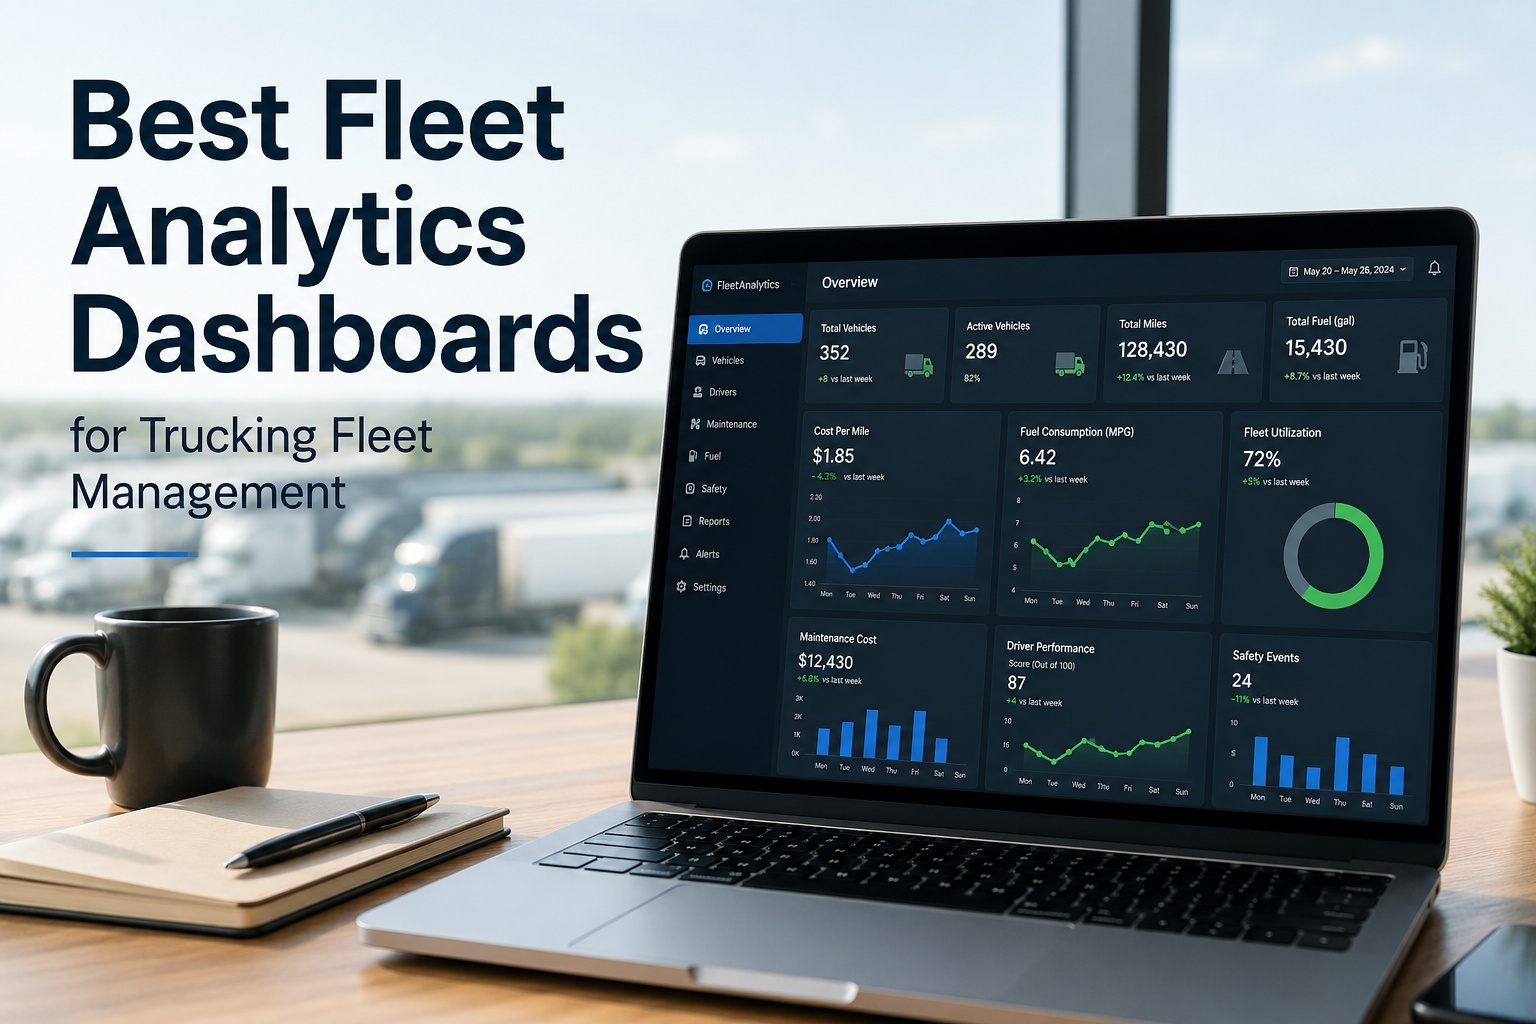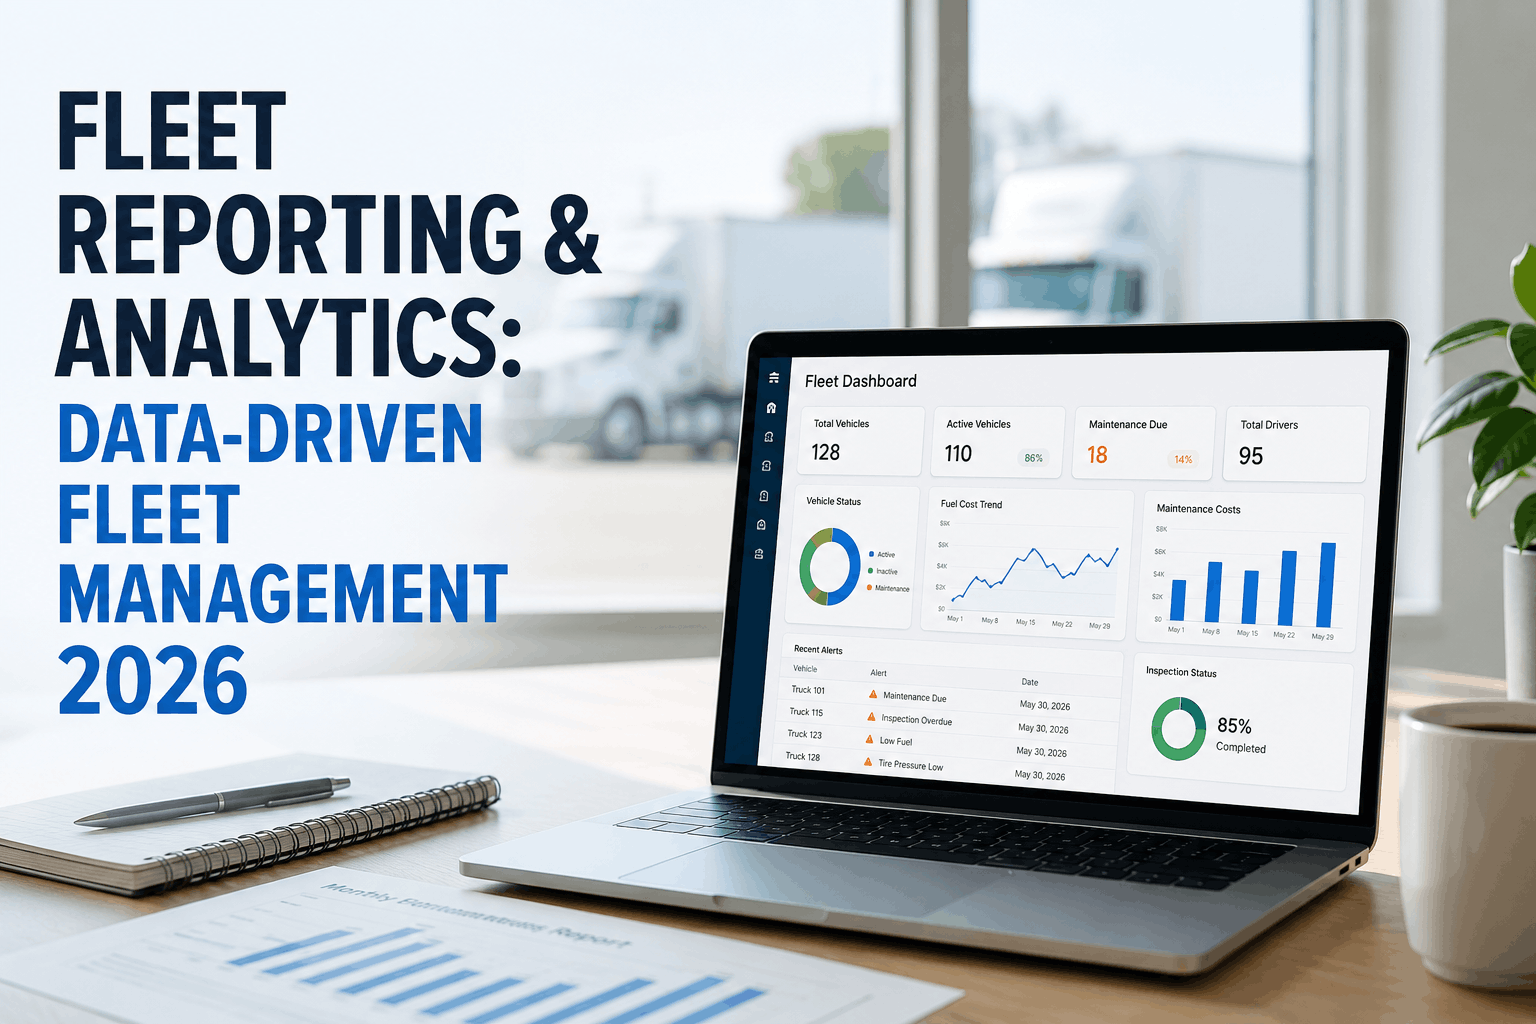
Most fleet managers in 2026 are drowning in data and starving for insight. GPS pings, fuel receipts, maintenance invoices, driver logs, and compliance records scattered across six different systems — making sense of it all requires a weekly Excel export that's already outdated by the time it's built. The fleets that consistently outperform their peers aren't working harder; they're seeing faster. They've built real-time dashboards around the right KPIs, not all KPIs. Industry data from Fleetio's 2026 benchmark across 1.2 million vehicles shows the average fleet wastes 5-10% of its annual budget through underutilized assets and poor PM compliance alone — gaps that proper reporting catches in days rather than quarters. Truck Inspection & Maintenance is built around the "layered dashboard" architecture: 4 North Star KPIs (Cost Per Mile, Utilization, Unplanned Downtime, PM Compliance) at the top, 4-6 diagnostic metrics in the secondary band, drill-down to everything else on click. No more dashboard fatigue. No more last-month spreadsheets. No more flying blind. Talk to our team for a dashboard walkthrough on your fleet.
Fleet Reporting & Analytics: Data-Driven Fleet Management
4 North Star KPIs. Layered dashboards. Real-time decisions. Powered by Truck Inspection & Maintenance.
The Reporting Problem Most Fleets Have
Before showing what good fleet reporting looks like, here's exactly why most fleet reporting fails. These are the patterns Truck Inspection & Maintenance was built to eliminate:
The 4 North Star KPIs Every Dashboard Needs
Industry best practice in 2026: 4 "North Star" KPIs shown large at the top of the dashboard, 4-6 diagnostic metrics in a secondary band, drill-down for everything else. Truck Inspection & Maintenance ships with this architecture pre-built:
Cost Per Mile (CPM)
The single most important fleet metric. Total operating costs divided by total miles. Target: $0.12-$0.18 top quartile, $0.20-$0.25 industry average, $0.30+ requires immediate intervention.
Vehicle Utilization Rate
Percentage of available hours an asset is actively in revenue service. Target: 75-85% for over-the-road; 60-70% for service vehicles. Below 50% = consider replacement or rental.
Unplanned Downtime %
Total hours unavailable due to breakdowns vs total available hours. Target: under 3%. Above 5% signals reactive maintenance dominance. Best-in-class fleets stay under 1.5%.
PM Compliance Rate
PMs completed within 10% of scheduled interval. Target: 95%+. Improving from 70% to 95% typically cuts breakdowns 50%. Truck Inspection & Maintenance auto-tracks this in real time.
The 6 Diagnostic Metrics (Secondary Band)
Below the North Stars, six diagnostic KPIs explain why your North Stars are moving. Truck Inspection & Maintenance surfaces all six on the standard dashboard:
Mean Time Between Failures. Operating hours divided by failure count. Declining 15% quarter-over-quarter signals a breakdown is coming.
Mean Time To Repair. Average hours from defect identification to repair completion. Target: under 4 hours for safety-critical, under 48 hours for moderate.
First-Time Fix Rate. Percentage of repairs completed without rework. Target: 85%+. Below 75% signals training gaps or parts inventory issues.
Daily Inspection Completion Rate. Target: 95%+. Below 80% = compliance risk. Our digital DVIRs hit 99% completion vs 61% paper baseline.
Work Order Backlog Age. Average age of open work orders. Target: under 7 days. Older = vehicles operating with deferred repairs.
CSA BASIC Scores. Vehicle Maintenance, Unsafe Driving, HOS Compliance. Target: under 50%. Above 80% = market decline from insurance.
The 4 Report Categories Every Fleet Should Run
KPIs feed reports. Reports drive decisions. Truck Inspection & Maintenance generates four standard report categories — each tied to specific operational decisions:
Financial Reports
Cost per mile by vehicle, fuel spend per route, maintenance cost vs budget, emergency parts ratio, per-vehicle P&L. Triggers replacement decisions, budget reallocations, vendor renegotiations.
Operational Reports
Vehicle utilization, on-time performance, route efficiency, idle time percentage. Triggers asset redeployment, route optimization, idle-time coaching for drivers.
Maintenance Reports
PM compliance, MTBF, MTTR, work order backlog, defect cycle times. Triggers PM interval refinements, technician coaching, parts inventory adjustments.
Safety & Compliance Reports
Driver safety scores, accident rate, DVIR completion, CSA BASIC scores, near-miss frequency. Triggers driver coaching, insurance renewal documentation, audit preparation.
The Reporting Cadence That Actually Works
Different metrics need different review frequencies. Daily review of monthly metrics = noise. Monthly review of daily metrics = catastrophe. Truck Inspection & Maintenance auto-distributes reports on the right schedule:
Stop drowning in data. Start making decisions.
Truck Inspection & Maintenance ships with the layered dashboard architecture — 4 North Star KPIs, 6 diagnostic metrics, drill-down on click. Auto-distributed reports on the right cadence. Sign up free on your first 3 vehicles in 10 minutes.
2026 Industry Benchmarks — Where Do You Stand?
A KPI without a benchmark is trivia. Here are the 2026 industry benchmarks aggregated from fleet analytics studies across 1.2 million vehicles. Truck Inspection & Maintenance shows your fleet against these baselines automatically:
The visibility advantage: Most fleets don't know where they sit because they've never had the analytics to measure. Truck Inspection & Maintenance benchmarks your fleet against these targets automatically — and surfaces the gaps worth closing first.
The Dashboard Architecture — Layered, Not Cluttered
Showing 40 metrics with equal visual weight creates "dashboard fatigue" — managers stop looking entirely. The right architecture is layered. Here's how Truck Inspection & Maintenance builds it:
4 North Star KPIs (Hero Position)
Cost Per Mile, Utilization, Unplanned Downtime, PM Compliance — shown LARGE at the top. Each with a trend arrow and benchmark comparison. Manager sees fleet health in 3 seconds.
6 Supporting Metrics (Secondary Band)
MTBF, MTTR, First-Time Fix, DVIR Compliance, WO Backlog, CSA Score. Smaller cards. Click any to drill down into details. Tells you WHY North Stars are moving.
Drill-Down on Click
Click any KPI to see the underlying data — by vehicle, driver, route, location, time period. 20+ supplementary metrics available but invisible until requested.
Exception Alerts & Recommendations
When a metric crosses a threshold, Truck Inspection & Maintenance auto-flags it with the suggested action. "Vehicle #14 brake events up 40% — schedule inspection." Decisions, not just data.
From Reporting to Predictive Analytics
2026's shift: from reporting (what happened) to predictive analytics (what's about to happen). Truck Inspection & Maintenance applies pattern recognition to surface risks 20-45 days before traditional diagnostics catch them:
How Truck Inspection & Maintenance Delivers Analytics
Our platform isn't a generic BI tool. It's purpose-built fleet analytics with the right architecture out-of-the-box:
Frequently Asked Questions
Industry best practice: 4 North Star KPIs — Cost Per Mile, Vehicle Utilization, Unplanned Downtime, and PM Compliance — shown prominently at the top of the dashboard. Plus 4-6 diagnostic metrics (MTBF, MTTR, First-Time Fix, DVIR Compliance, WO Backlog, CSA Score) in a secondary band. Truck Inspection & Maintenance ships with this architecture pre-built. Contact our specialists to walk through dashboard configuration.
Dashboard fatigue happens when 30+ metrics are shown with equal visual weight. Managers stop looking entirely. The fix: layered architecture. Truck Inspection & Maintenance shows 4 North Star KPIs LARGE at the top, 6 diagnostic metrics in a secondary band, and everything else accessible via drill-down on click. Three seconds to fleet health overview, not three minutes.
Reporting tells you what happened (historical data). Analytics tells you what's about to happen (predictive). Modern fleet analytics like Truck Inspection & Maintenance surfaces failure risks 20-45 days before traditional diagnostics catch them — through pattern recognition on brake events, MPG trends, MTBF curves, and defect clustering. The 2026 shift is from reporting to real-time decisioning.
Different metrics need different cadences. Daily: vehicle availability, safety alerts, active work order MTTR. Weekly: PM compliance, first-time fix, DVIR trends. Monthly: cost per mile, utilization, budget. Quarterly: TCO, replacement candidates, CSA trends. Annually: lifecycle analysis, ROI. Sign up free to auto-distribute reports on the right cadence.
Industry average is $0.20-$0.25 per mile. Top-quartile fleets achieve $0.12-$0.18. Below $0.30 is "needs urgent intervention" territory. The gap between top and bottom is mostly maintenance discipline — top fleets stay under 20% reactive maintenance while industry average sits at 45%. Truck Inspection & Maintenance benchmarks your CPM against industry data automatically.
No — and you shouldn't have one. Generic BI tools require manual data integration, custom dashboard building, and ongoing maintenance. Truck Inspection & Maintenance is purpose-built fleet analytics with the right architecture out-of-the-box: 4 North Stars, 6 diagnostics, industry benchmarks built-in, predictive risk surfacing, and auto-distributed reports. Talk to our team for a feature comparison vs your current setup.
The fleets winning in 2026 see their data in real time, organized by priority.
Truck Inspection & Maintenance delivers the layered dashboard architecture — 4 North Star KPIs, 6 diagnostic metrics, drill-down on click, predictive risk surfacing, auto-distributed reports. Free for up to 3 vehicles. Stop flying blind.