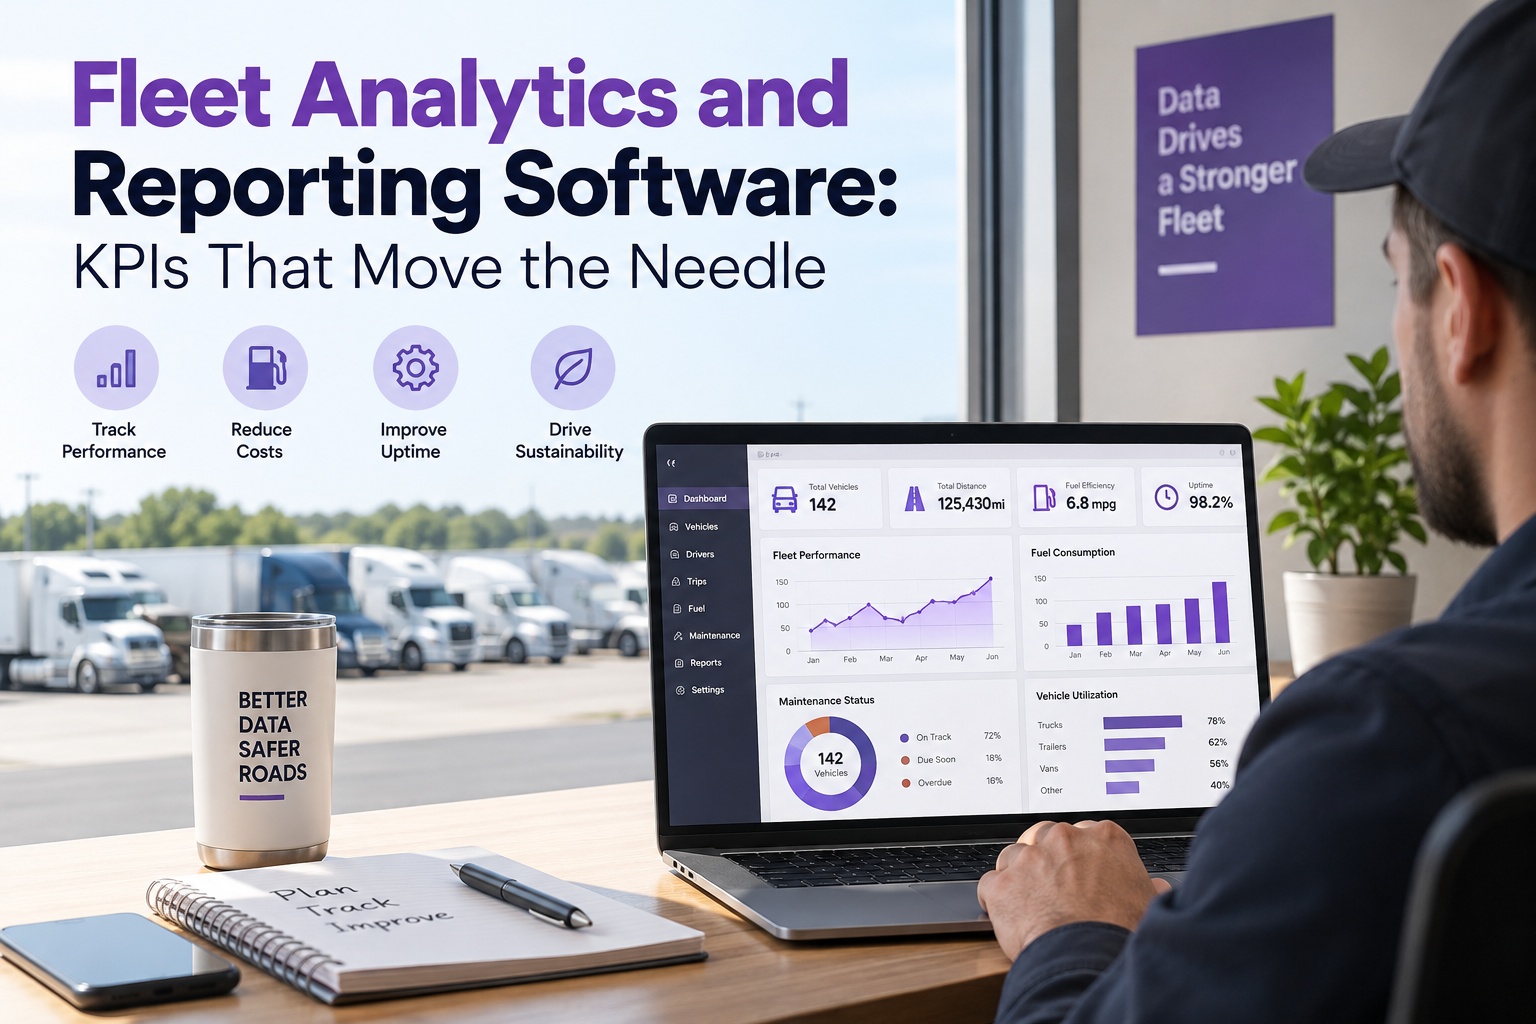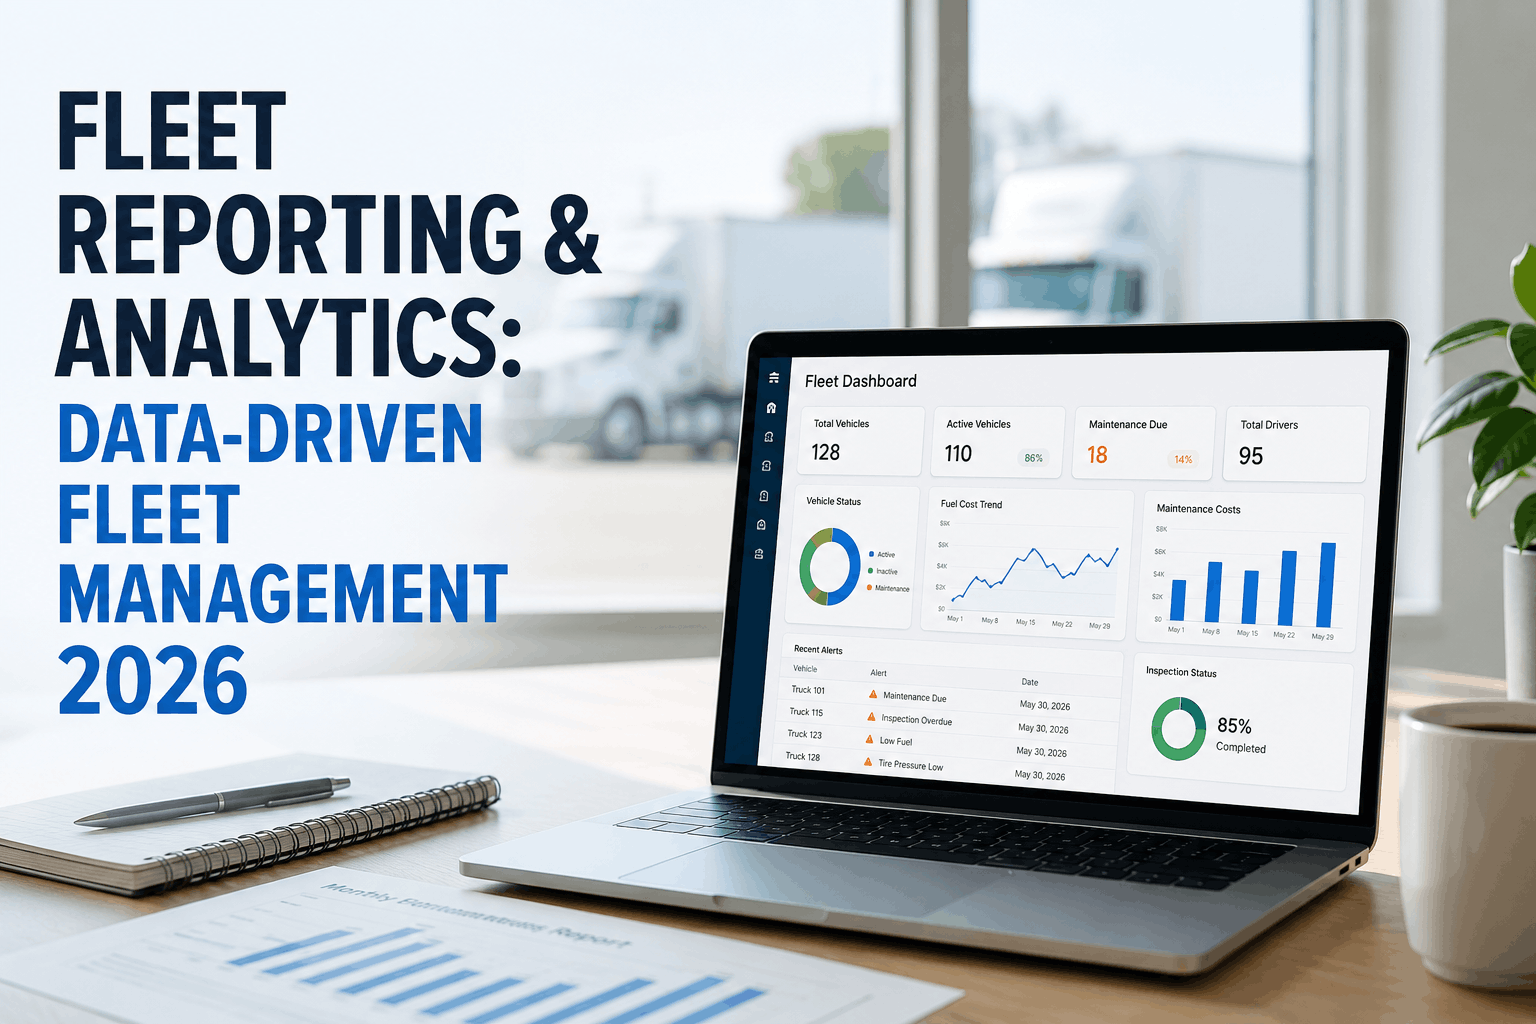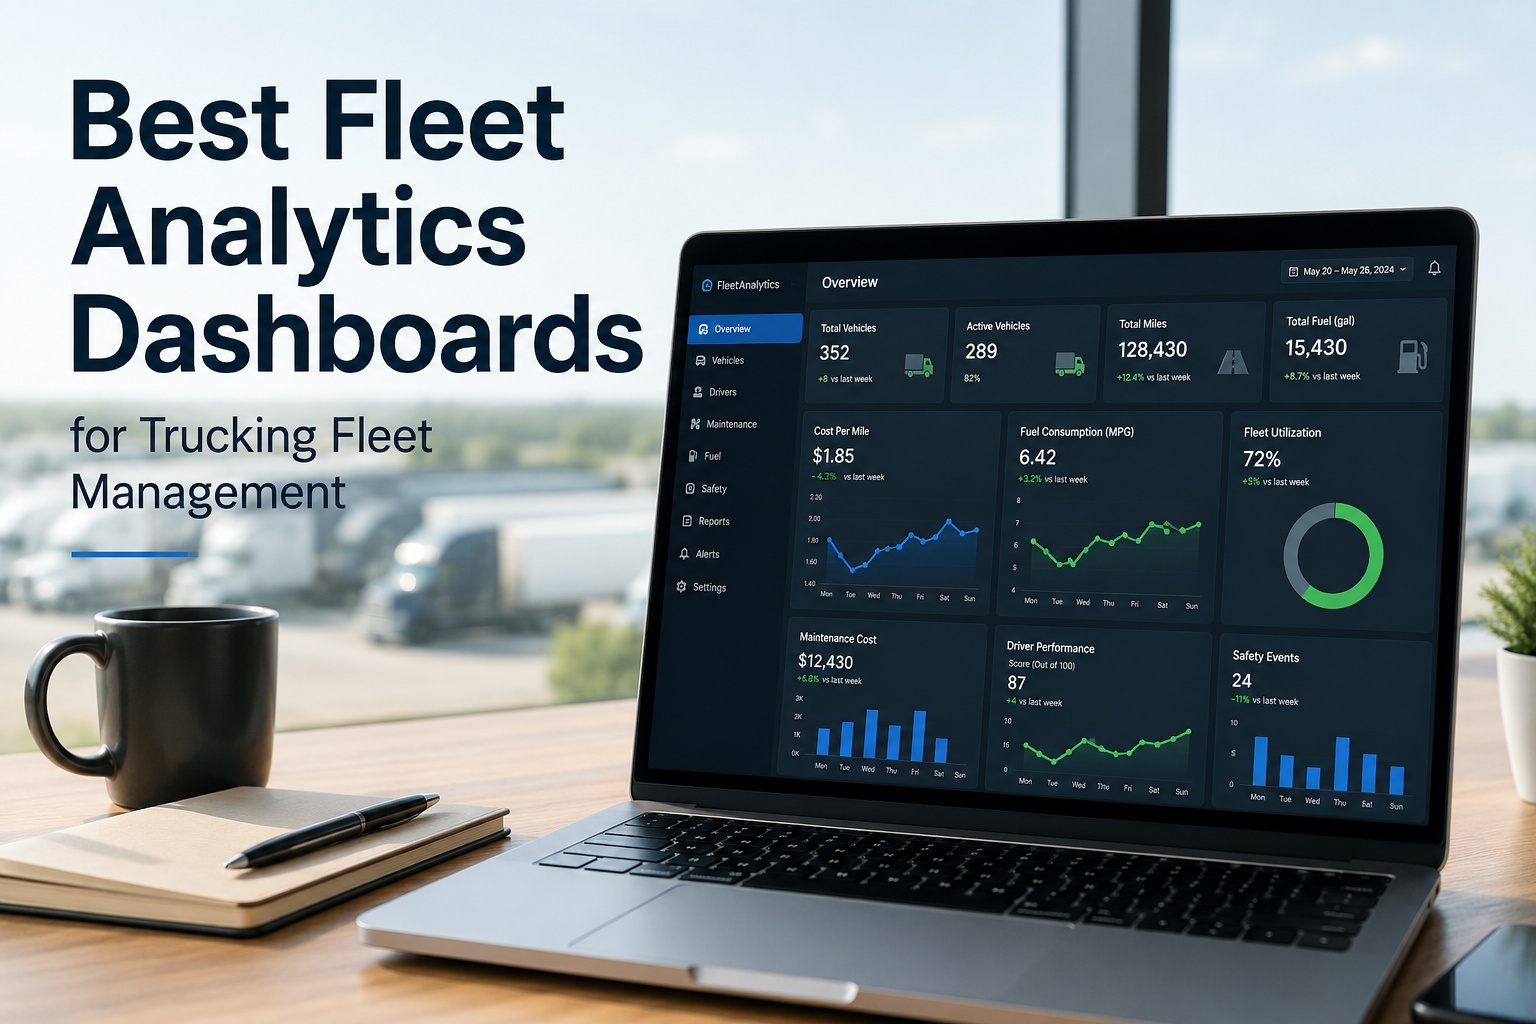
Most fleet managers are drowning in data and starving for insight. GPS pings, fuel receipts, maintenance invoices, driver logs, inspection records, compliance docs — scattered across six disconnected systems, merged weekly into a spreadsheet that's already outdated the moment it's built. In 2026, that approach is actively costing money. ATRI puts the industry fleet cost-per-mile at $2.26 (up $0.62 since 2020). Unplanned downtime runs $448-$760 per vehicle per day, with 78% of it preventable. The average fleet wastes 5-10% of its annual budget on underutilized assets and poor PM compliance alone. A single one-cent improvement in cost per mile on a 50-truck fleet running 80,000 miles per year saves $40,000 annually. Industry best practice in 2026: lead with 4 "North Star" KPIs — Cost Per Mile, Vehicle Utilization, Unplanned Downtime, PM Compliance — backed by tiered diagnostic metrics and one-click drill-down. Truck Inspection & Maintenance delivers exactly that architecture: real-time KPIs, role-based views, automated alerts, and one-click exports. Start your free trial and replace the Friday spreadsheet with a live dashboard.
Best Fleet Analytics Dashboards
The KPIs, architecture, and benchmarks that separate dashboards that drive decisions from dashboards that get ignored.
The Dashboard Fatigue Problem — Why Most Dashboards Get Ignored
A dashboard showing 40 KPIs with equal visual weight is functionally useless. It forces the manager to do the cognitive work of prioritizing — and the result is "dashboard fatigue," where people stop looking entirely. Truck Inspection & Maintenance is built around a tiered information hierarchy that solves this directly:
40 KPIs · Equal Weight
4 + 6 + Drill-Down
The 4 North Star KPIs — What Every Dashboard Must Show Big
These four KPIs aren't just popular — they correlate with fleet profitability more strongly than any other metrics tracked across the industry. They belong at the top of the dashboard, in large type, visible without scrolling. Truck Inspection & Maintenance shows all four as the primary "glance layer":
Cost Per Mile
The master metric. Aggregates fuel, maintenance, insurance, depreciation, and driver costs into one actionable number. Top quartile fleets run $0.38-$0.48; bottom quartile exceeds $0.55.
Vehicle Utilization
The capacity metric. Tells you whether you're paying carrying costs on assets that aren't earning revenue. Top performers hit 90%+; most fleets average 60-70%.
Unplanned Downtime %
The reliability metric. Costs $448-$760 per vehicle per day. 78% is preventable with right PM cadence. Tracking it surfaces the trucks that need replacement vs the trucks that need attention.
PM Compliance Rate
The discipline metric. Only 5% of fleets achieve 95-100%. Every missed PM raises breakdown risk 4-5x. Highest-leverage metric for cutting future cost.
The 4 KPI Pillars — A Balanced Dashboard Covers All of Them
Fleets that obsess over cost but ignore safety, or track utilization but neglect maintenance, inevitably pay for the gap. A modern dashboard balances four strategic pillars — each with its own diagnostic KPIs. Truck Inspection & Maintenance organizes the secondary metric band exactly this way:
Financial
Cost per mile, total cost of ownership, maintenance spend per vehicle, emergency parts ratio, fuel cost per route.
Operational
Vehicle utilization, on-time performance, route efficiency, idle time %, miles per gallon, stops per truck per day.
Reliability
PM compliance, MTBF, MTTR, unplanned downtime, work order backlog age, first-time fix rate, scheduled vs reactive ratio.
Safety
Driver safety score, accident rate per million miles, DVIR compliance %, CSA BASIC scores, near-miss events, hard-braking events.
Replace the Friday spreadsheet with a live KPI dashboard.
Truck Inspection & Maintenance shows the 4 North Stars at the top, 4-6 diagnostic KPIs in the secondary band, and drills down to every supporting metric on one click — all from live fleet data, no exports required. Free for up to 3 vehicles. Contact support to plan your rollout.
The Tiered Dashboard Architecture — How It's Actually Structured
Modern fleet dashboards follow a three-tier information architecture: glance layer, diagnostic layer, drill-down layer. Each tier answers a different question at a different speed. Truck Inspection & Maintenance is built on this principle out of the box:
Glance Layer — 10-Second Read
The 4 North Stars in large type with traffic-light status. Visible without scrolling, no clicks. Answers one question: "Is my fleet healthy right now?"
Diagnostic Layer — One-Scroll Read
4-6 supporting KPIs in a secondary band. Surfaces the "why" behind the glance layer. Answers: "Where is the problem coming from?"
Drill-Down Layer — One-Click Read
Per-vehicle, per-driver, per-route detail. Activated on click from any glance or diagnostic metric. Answers: "Exactly which asset/driver/route do I need to act on?"
2026 Benchmarks — Where Top Fleets vs Average Fleets Actually Land
Knowing your number doesn't help unless you know what "good" looks like. Here's where top-quartile, industry-average, and bottom-quartile fleets land on the metrics that matter most in 2026. The gap from average to top quartile is where the ROI lives:
The One-Cent CPM Impact — Why Dashboards Pay for Themselves
Cost per mile is the highest-leverage metric on any fleet dashboard. Every cent of improvement compounds across miles driven, trucks owned, and years operated. Most fleets implementing focused KPI dashboards achieve 2-5 cent improvements within 12 months — the math below shows why that matters:
Frequently Asked Questions
What KPIs should a fleet dashboard show on its main screen?
Industry best practice in 2026 is 4 North Star KPIs — Cost Per Mile, Vehicle Utilization, Unplanned Downtime, PM Compliance — shown large at the top, with 4-6 supporting metrics in a secondary band. Everything else lives one click deep via drill-down. Dashboards showing 40+ KPIs with equal weight cause "dashboard fatigue" and stop getting opened.
What's the difference between fleet tracking and a fleet dashboard?
Fleet tracking shows where vehicles are in real time — a GPS map with vehicle pins. A fleet dashboard includes analytics, KPIs, maintenance status, compliance indicators, and cost trends. Tracking answers "where is the truck?" A dashboard answers "how is my fleet operating and what needs attention today?" Modern platforms integrate both, but they're functionally different. Sign up free to see both in one platform.
How often should we review fleet KPI dashboards?
Tiered cadence works best. Daily 10-minute checks for alerts and critical events. Weekly deep-dives into driver and vehicle performance. Monthly fleet-wide reporting for leadership. Quarterly strategic reviews against industry benchmarks and annual target adjustments. The platform automates the data — managers just review and act.
What's the ROI on implementing a fleet analytics dashboard?
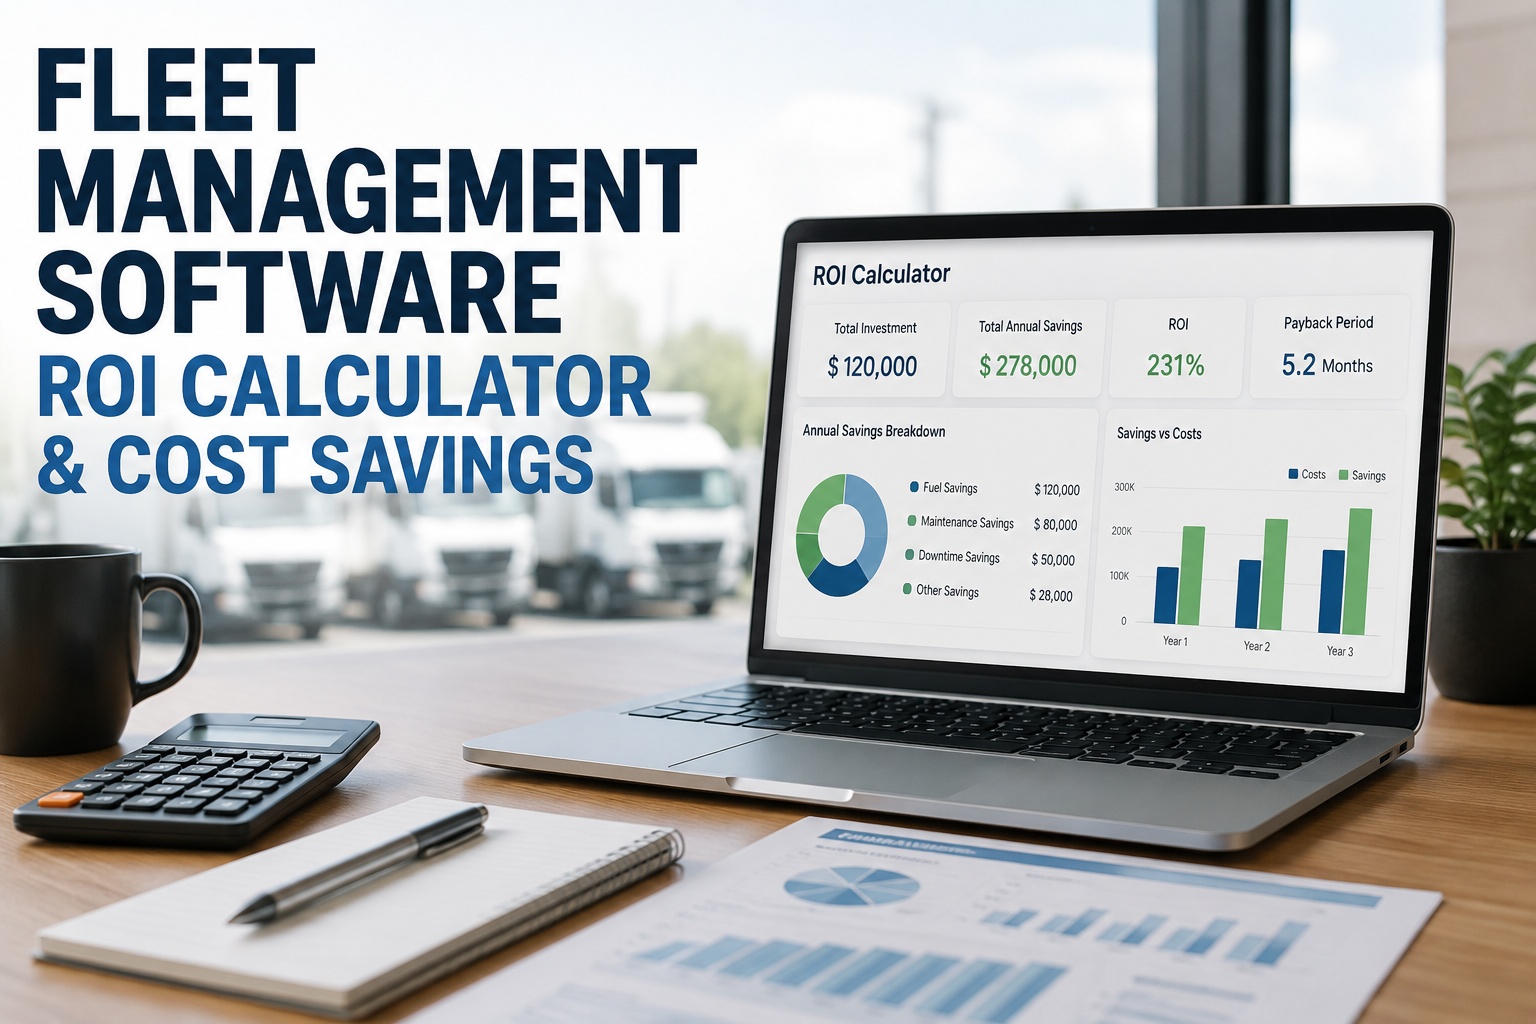
A single one-cent improvement in CPM on a 50-truck fleet running 80K mi/year saves $40,000 annually. Most fleets implementing focused KPI dashboards achieve 2-5 cent improvements within 12 months — $80K to $200K in Year 1. Add in maintenance savings, unplanned downtime reduction, and safety improvements and the ROI math compounds.
Can the dashboard support role-based views?
Yes. Executives need top-line financials and trend summaries. Dispatchers need real-time vehicle status and utilization. Technicians need work order queues and PM schedules. Safety managers need driver scorecards and CSA scores. Truck Inspection & Maintenance provides role-based views from the same unified data source — no duplicate entry, no conflicting numbers.
How long does it take to get the dashboard running?
Most fleets are live with the first KPI dashboard within an hour of starting the free trial. Cost per mile, utilization, and idle time come online with the first telematics sync. Full insights including PM compliance, MTBF, and safety scoring build to maturity within 30-60 days of operational data accumulation. Talk to our team for a fleet-specific walkthrough.
See the 4 KPIs that drive fleet profitability — live.
Truck Inspection & Maintenance delivers the 4 North Stars, 4-6 diagnostic KPIs, and full drill-down — built on a tiered architecture that fleet managers actually use. Free for up to 3 vehicles. No hardware. No contracts.