Fleet vehicles don't fail catastrophically — they slowly become unprofitable. A truck that cost $0.18 per mile in year three quietly drifts to $0.27 by year seven, $0.35 by year ten. By the time the financial pain registers in monthly reports, you've already lost two years of margin. That's the problem lifecycle management solves: managing every vehicle as an asset with a defined economic window, not as a piece of iron you replace when it breaks. According to the 2025 Fleet Benchmark Report, cost per mile increases 35% for vehicles over 10 years old. Fleets running formal lifecycle programs achieve 18-25% lower maintenance costs and 30% fewer roadside breakdowns vs fleets that replace only after catastrophic failure. Truck Inspection & Maintenance is built around the full lifecycle — acquisition specs, in-service PM, real-time TCO calculation per unit, replacement-timing analytics, and disposal documentation. One platform from procurement paperwork to auction block. This guide walks through the 5 lifecycle phases, the TCO math, and the replacement decision framework that turns your fleet from a cost center into a strategic asset. Talk to our team for a lifecycle analysis on your fleet.
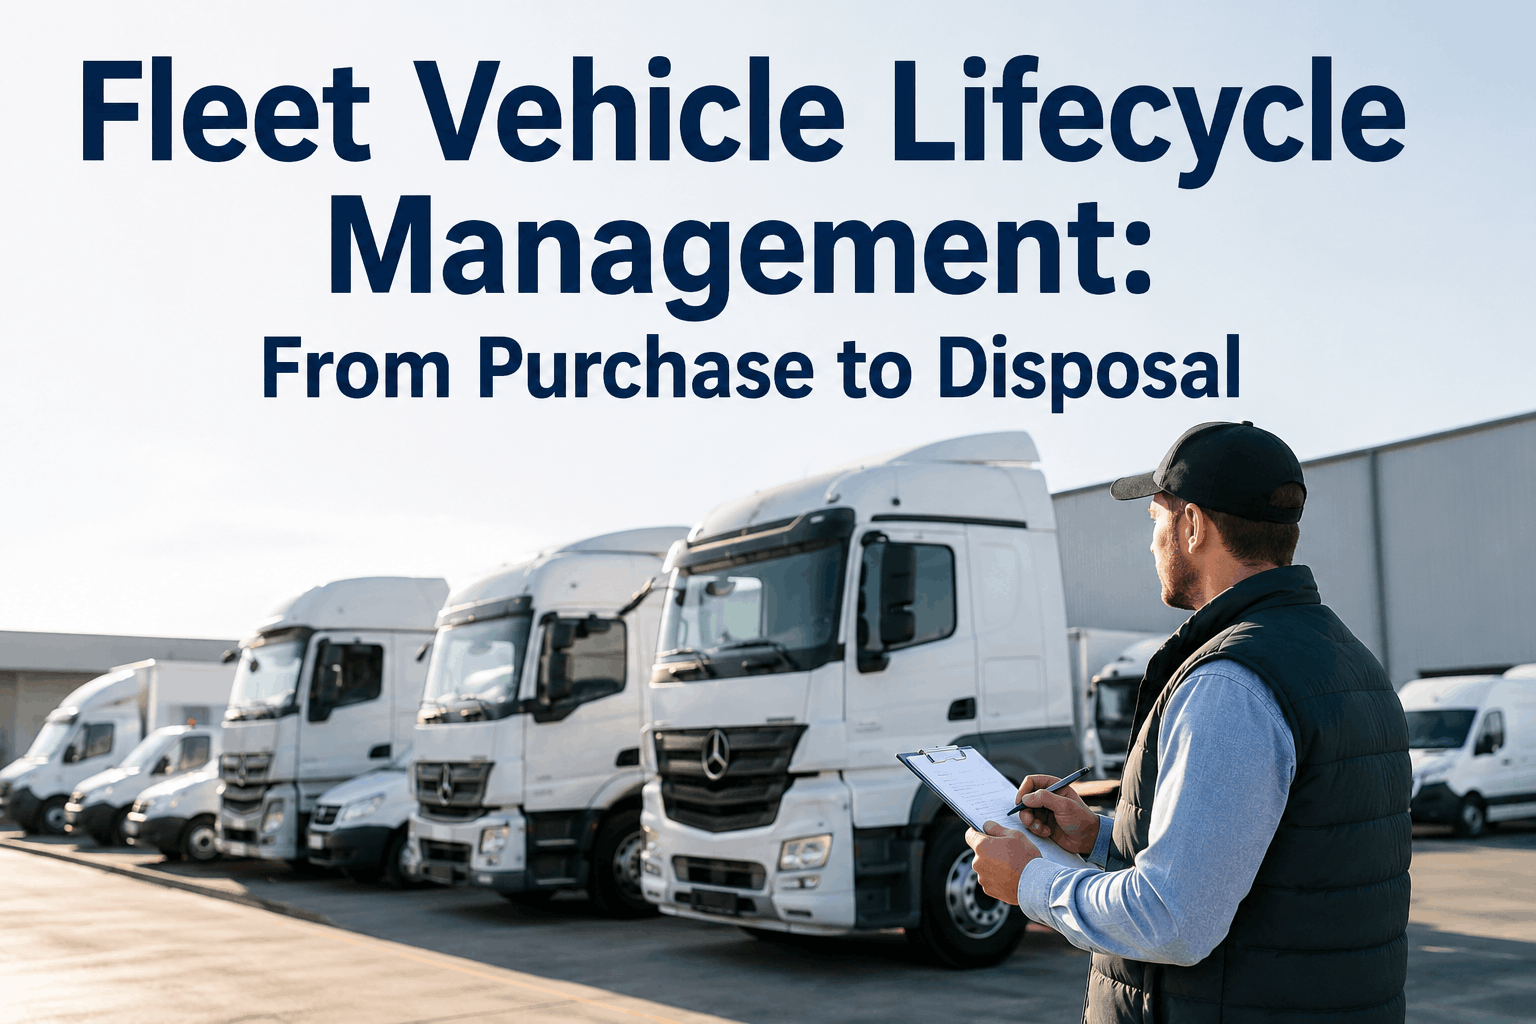
Fleet Vehicle Lifecycle Management: Purchase to Disposal
5 phases. One platform. Truck Inspection & Maintenance manages every stage.
The 5 Lifecycle Phases — How Truck Inspection & Maintenance Handles Each
Vehicle lifecycle isn't a single decision — it's five distinct phases, each with different cost profiles and management requirements. Our platform tracks all five in one unified vehicle record:
Acquisition & Procurement
Months -12 to 0. Vehicle class, spec, upfitting, financing structure (lease vs buy). Truck Inspection & Maintenance stores VIN, OEM specs, warranty details, financing terms, and baseline acquisition cost. Sets the depreciation curve.
Initial Setup & Onboarding
Months 0-3. Telematics installation, driver assignment, baseline inspection, initial PM schedule. Our platform auto-generates PM-A schedule from delivery date and assigns the right inspection templates per vehicle type.
Active Service (The Sweet Spot)
Years 1-5. Peak productivity, lowest TCO, highest reliability. PM happens on schedule, defects auto-route to work orders, costs track to budget. The phase where Truck Inspection & Maintenance delivers maximum value.
Aging & Watch List
Years 5-8. Maintenance costs creep up. CPM trends watch closely. Our platform flags vehicles crossing 40% of FMV in annual maintenance — the standard replacement signal. Move from active to watch list.
Replacement & Disposal
Years 8+. Decommission, document, dispose. Truck Inspection & Maintenance generates the full vehicle history packet — DVIRs, PMs, work orders, photos — which buyers pay 15-25% more for vs vehicles with no records.
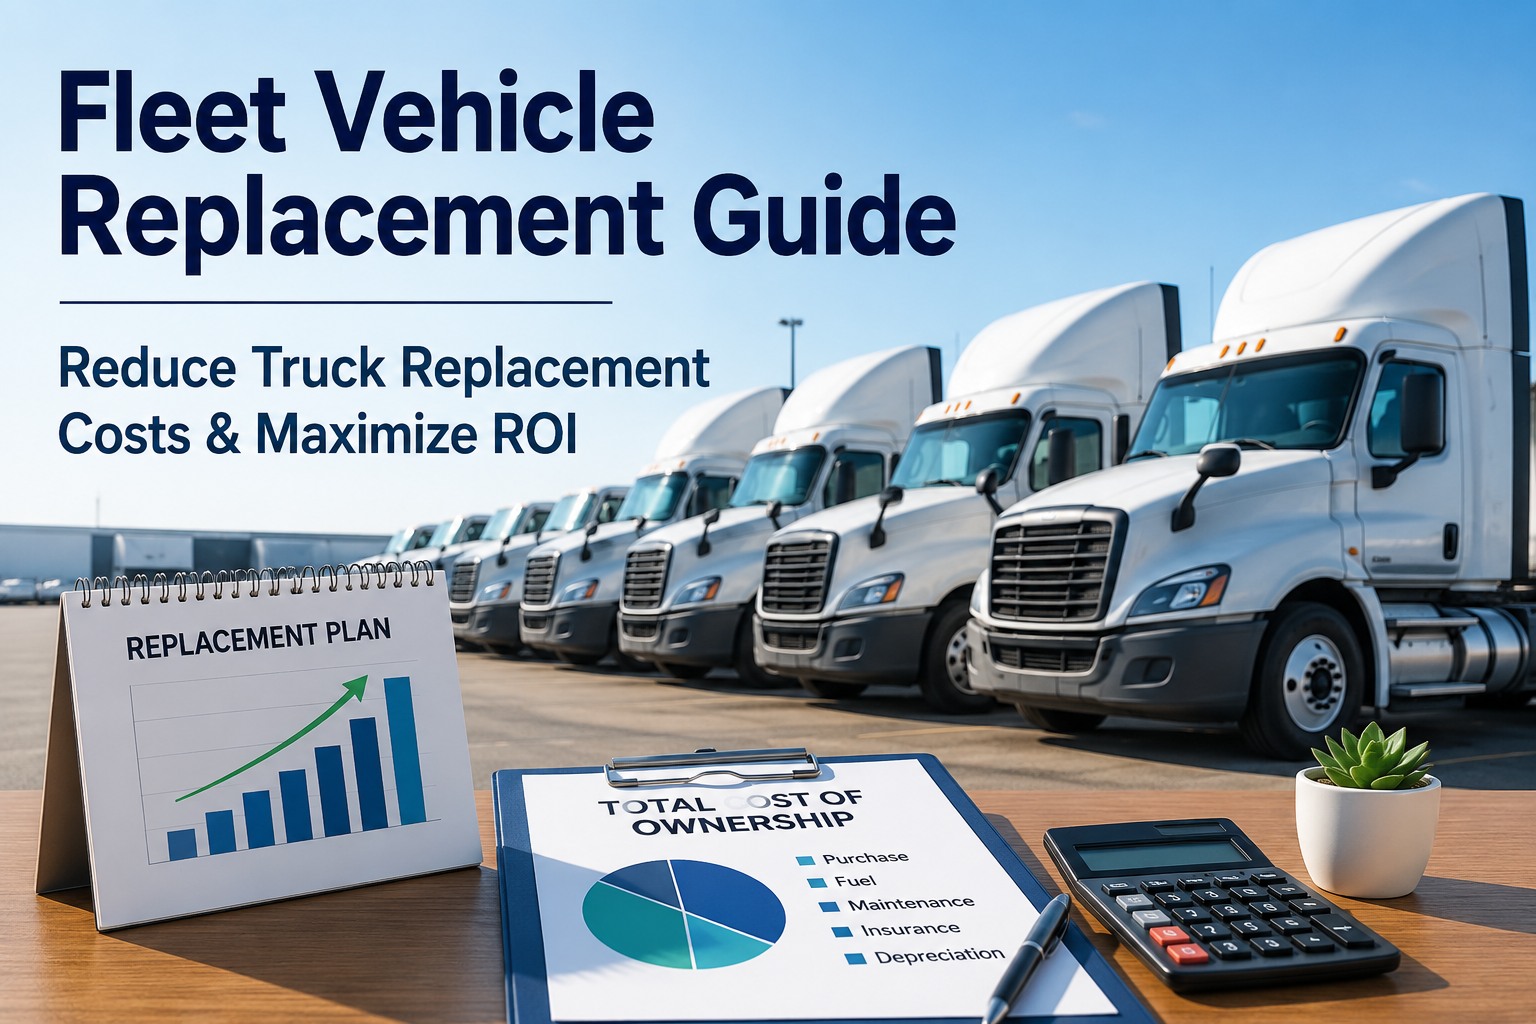
The Total Cost of Ownership (TCO) Framework
TCO per mile is the gold standard KPI for lifecycle management. It integrates every cost category against actual utilization. Truck Inspection & Maintenance auto-calculates TCO per unit, monthly, with industry benchmarks built in:
The TCO insight: Vehicles look profitable until you measure every cost component. Truck Inspection & Maintenance surfaces the hidden 20-30% of TCO most fleets never measure — downtime cost, capital cost, and insurance premium attribution per vehicle.
The "Sweet Spot" — When TCO Is Lowest
Every vehicle has a mathematical sweet spot where TCO per mile is at its minimum. Replace too early, and you waste remaining useful life. Replace too late, and maintenance + downtime erode profit. Truck Inspection & Maintenance plots each vehicle's TCO curve to identify the exact sweet spot:
Industry Replacement Guidelines
Major fleet management benchmarks give specific replacement triggers by vehicle class. Truck Inspection & Maintenance pre-loads these guidelines and auto-flags vehicles approaching the threshold:
Guidelines aren't absolute: The Texas Comptroller framework allows earlier replacement for high-cost vehicles and extended use for low-cost ones. Truck Inspection & Maintenance evaluates each unit on real TCO data — not just age or miles.
The Replacement Decision Framework
Don't replace vehicles based on hunches. Use a structured 6-criteria framework. Truck Inspection & Maintenance evaluates each criterion automatically and produces a "replace vs keep" recommendation per unit:
Annual Maintenance Cost vs FMV
Trigger: Annual maintenance > 40-45% of fair market value. Industry standard. Beyond this threshold, repair money is better spent on a new acquisition.
CPM Trend vs Fleet Average
Trigger: Vehicle CPM > 1.5x fleet average. Outlier units drag down profitability. Our platform plots CPM by vehicle to surface outliers automatically.
MTBF Declining 15% Quarter-Over-Quarter
Trigger: Mean Time Between Failures dropping rapidly. Most predictive single metric in lifecycle management. Truck Inspection & Maintenance plots the curve in real time.
Downtime % Above Tolerance
Trigger: Unplanned downtime > 5% (industry best-in-class <1.5%). Each breakdown day costs $448-$760 in lost revenue. Replacement math gets brutal fast.
Emission/Compliance Risk
Trigger: Vehicle no longer meets local emission standards, or pending regulation deadline approaching. California ACF, EPA Phase 3 GHG rules increasingly drive replacement.
Driver/Customer Reliability Complaints
Trigger: 3+ documented reliability complaints in 90 days. Often the earliest signal — drivers feel reliability decline before metrics show it. Our DVIR system surfaces patterns.
Stop guessing when to replace. Use the data.
Truck Inspection & Maintenance tracks every cost component, calculates TCO per unit, plots CPM curves, and auto-flags replacement candidates against industry benchmarks. Sign up free to see your first replacement-readiness dashboard in 10 minutes.
The Disposal Strategy — Maximize End-of-Life Value
How you dispose of a vehicle affects 15-25% of its residual value. Most fleets default to dealer trade-ins because it's easy — and leave money on the table. Truck Inspection & Maintenance generates the documentation that maximizes value through any channel:
Private Sale
Best for: Specialized or high-value units. Returns: Highest — typically 15-25% above wholesale. Effort: High. Requires marketing, buyer screening, paperwork. Worth it for $50K+ vehicles.
Auction Services
Best for: Multiple disposals, standard equipment. Returns: Market-rate, often 5-12% below private sale. Effort: Low. Online platforms (Ritchie Bros, IronPlanet) handle most logistics.
Dealer Trade-In
Best for: Streamlining new acquisition. Returns: Lowest — typically 15-25% below private sale. Effort: Minimum. Tax credit on new purchase can offset some of the gap.
Fleet-to-Fleet Direct
Best for: Common workhorse trucks with documented history. Returns: Near-private-sale returns. Effort: Moderate. Truck Inspection & Maintenance's history packet directly enables this channel.
How Documentation Drives Resale Value
The single biggest variable in disposal value isn't condition — it's documentation. Buyers pay 15-25% more for vehicles with complete digital service history. Truck Inspection & Maintenance generates a 1-click "vehicle history packet" containing everything a buyer wants:
Common Lifecycle Management Mistakes
Fleets that struggle with lifecycle management usually make one or more of these five mistakes. Truck Inspection & Maintenance prevents each:
Frequently Asked Questions
Industry standard: when annual maintenance cost exceeds 40-45% of current fair market value. For most U.S. commercial vehicles, this occurs between years 6-8 or 400,000-600,000 miles depending on class. Include downtime cost in the calculation — a truck costing $20K/year in repairs but down 45 days is really costing $50K+ total. Truck Inspection & Maintenance auto-flags vehicles crossing these thresholds. Contact our specialists for a replacement analysis.
TCO per mile is the gold standard fleet KPI. It integrates depreciation (30-40% of TCO), fuel (20-30%), maintenance (15-25%), insurance (8-15%), financing (5-12%), and downtime (5-10%) — divided by miles driven. Truck Inspection & Maintenance calculates TCO per unit automatically every month with industry benchmarks for context.
Depends on vehicle class. GSA guidelines: gas pickups 7 years/65K miles, diesel pickups 8 years/150K miles. Light-duty trucks 5-7 years/120-150K miles. Medium-duty 7-10 years/250-350K miles. Class 8 heavy-duty 8-12 years/500-750K miles. Trailers 10-15 years. These are starting points — actual replacement should be driven by TCO data, not just age. Sign up free to see your fleet's specific replacement candidates.
Fleets without formal lifecycle programs pay 18-25% more in annual maintenance costs vs those that manage lifecycle proactively. Cost per mile increases 35% for vehicles over 10 years old. Roadside breakdowns are 30% higher on reactively replaced fleets. On a 50-truck fleet, that's typically $300,000-$600,000 in annual excess cost — recovered the moment you implement structured lifecycle management.
Significantly. Buyers pay 15-25% more for vehicles with complete digital service history vs equivalent vehicles with paper or no records. They're buying proof of how the vehicle was maintained, not just the vehicle itself. Truck Inspection & Maintenance generates a 1-click "vehicle history packet" — PM records, DVIRs, defect-to-repair trail, major component replacements, DOT inspection certificates — for every disposal.
Depends on capital availability, utilization predictability, and resale market conditions. Leasing preserves capital, transfers residual risk, and locks in monthly costs — best for fleets with steady utilization. Buying makes sense when you have capital, predictable long-term needs, and want full control of disposal timing. Truck Inspection & Maintenance handles both — the lifecycle data informs the lease-vs-buy decision per vehicle. Talk to our team for guidance.
Manage every vehicle as an asset with a defined economic window.
Truck Inspection & Maintenance tracks all 5 lifecycle phases — acquisition specs through disposal documentation. TCO per unit. Replacement-ready alerts. 1-click history packets. Free for up to 3 vehicles.