Every fleet manager knows the phrase "prevention is cheaper than cure." Almost none of them can tell you by how much. The actual number is brutal: reactive repairs cost 3 to 9 times more than the same repair scheduled as planned maintenance. That's not a marketing claim — it's what happens when you add roadside call fees, rush parts freight, premium overtime labor, lost revenue during downtime, and secondary damage from a component that ran to failure. Yet the industry average fleet still runs 45% reactive maintenance. Top-quartile fleets run under 20%. The gap between those two numbers is where entire margin lives. This guide breaks down the true cost math of preventive versus reactive maintenance, when each is appropriate, and the exact roadmap to shift your fleet from reactive to preventive. Ready to start the shift? Start your free trial or reach out to our support team for a walkthrough on your fleet.
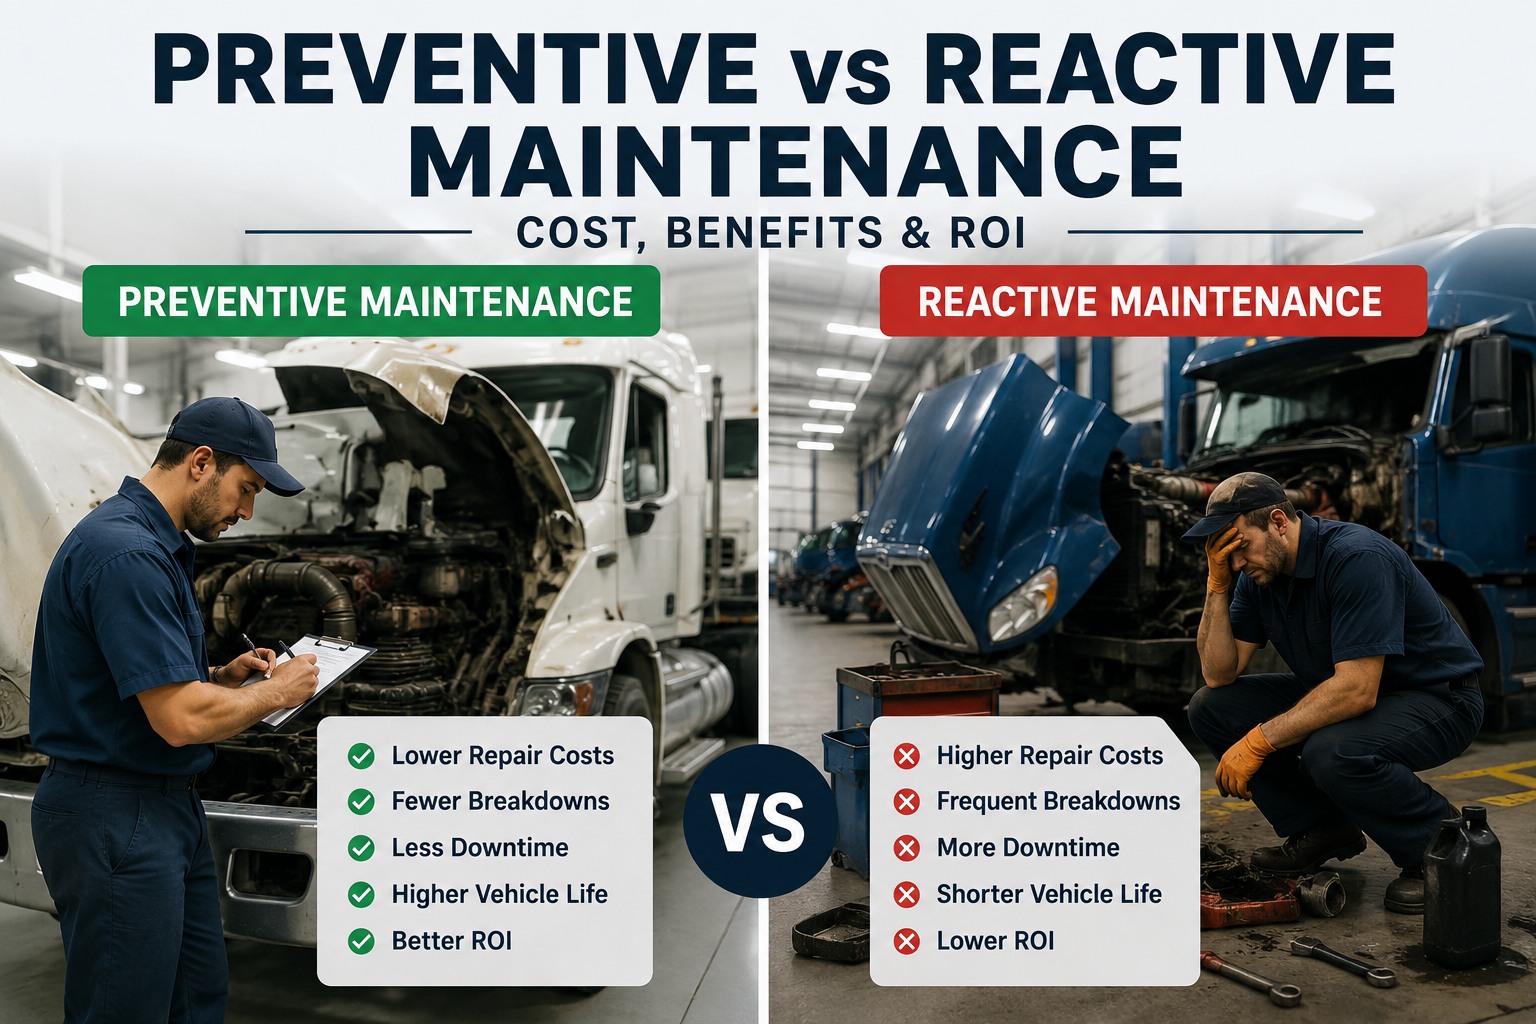
Preventive vs Reactive Maintenance: The Real Cost, Benefits & ROI Breakdown
Same repair. Two strategies. Nine times the cost. Here's the actual math of what "run to failure" costs your fleet — and the specific path to flip that ratio.
The Two Strategies in Plain Terms
Before diving into cost math, get the definitions straight — the difference is more than semantics.
Preventive Maintenance
Scheduled service performed at defined intervals — based on time, mileage, or engine hours — regardless of whether the component has failed. The goal is to catch wear before it becomes damage.
Reactive Maintenance
Repair performed after failure has occurred — a truck breaks down, a component seizes, a driver reports a defect after damage is already done. Repair happens on the failure's schedule, not yours.
The Cost Multiplier: Where the 3–9x Comes From
The reactive cost premium isn't magic. It's the sum of specific line items that stack on top of the base repair. Here's how a $500 planned repair becomes a $2,000–$4,500 unplanned one.
Head-to-Head: The Full Comparison
Every dimension that matters, side by side. This is the slide finance wants to see.
| Dimension | Preventive | Reactive |
|---|---|---|
| Total cost per repair | 1x baseline | 3–9x baseline |
| Repair scheduling control | Fleet controls timing | Failure controls timing |
| Downtime duration | Hours (planned) | Days (unplanned) |
| Parts sourcing | Standard order, best price | Rush freight, premium |
| Labor rates | Standard shop hours | Overtime + roadside premium |
| Component life | Full expected service life | Cut short by run-to-failure |
| Secondary damage risk | Contained to primary part | Cascading component damage |
| Driver safety exposure | Minimal | Breakdown on route |
| DOT compliance risk | Audit-ready records | Gaps, missed intervals |
| Insurance impact | Neutral or positive | Claim + premium exposure |
| Fleet uptime | 95%+ | 80–85% |
| Cost per mile trend | Stable, predictable | Volatile, rising |
The 6 Real Benefits of Preventive Maintenance
Cost savings are the headline benefit. But the second-order effects are often what convert skeptical operators.
15–25% total cost reduction
Structured PM programs consistently deliver 15–25% reduction in total maintenance cost per mile within 12 months of full adoption.
70% fewer breakdowns
Predictive PM based on trend data catches failures 2–4 weeks before they strand a truck — eliminating most emergency roadside events.
Uptime moves 85% to 95%+
Every 10% uptime gain is equivalent to adding fleet capacity without adding vehicles — pure margin, no capex.
25–40% fewer safety incidents
Component failures are a leading cause of preventable commercial-vehicle incidents. PM discipline dramatically reduces exposure.
Full DOT audit readiness
Every PM record, defect, and inspection stored against the VIN. When an auditor asks for 14 months of records, you export them in one click.
Predictable operating cost
Cost-per-mile stops being a surprise. Budget forecasts hold. Finance can plan capacity — not scramble to cover overruns.
Shift the ratio
Move from 45% reactive to under 20% reactive in 12 months. Structured PM cadence, automated reminders, defect-to-work-order routing — all in one platform.
The Break-Even Timeline
Every honest cost analysis addresses the elephant: PM programs cost money upfront. Here's the realistic break-even curve for a 50-truck fleet shifting from reactive to preventive.
When Reactive Maintenance Is Actually Correct
Not everything belongs in a PM program. A mature maintenance strategy uses reactive repair deliberately in specific cases — the point isn't zero reactive, it's zero unplanned reactive on critical systems.
The 5-Step Shift from Reactive to Preventive
You don't flip the switch overnight. Every fleet that's made the shift successfully has followed roughly this sequence.
Baseline your current ratio
Pull the last 12 months of work orders. Categorize each as planned or reactive. Calculate your reactive percentage. This is your starting line — you can't improve what you can't measure.
Build PM templates by asset class
Every vehicle type gets a defined PM cadence: A-service (oil, filters), B-service (fluids, tires, brakes), C-service (drivetrain, suspension). Interval based on OEM spec, mileage, or engine hours.
Automate the reminders
PM intervals fire automatically based on live vehicle data — not on someone remembering to check a calendar. This is where 90% of manual PM programs fail.
Close the defect loop
Every driver DVIR defect auto-generates a work order. Small issues stop being ignored between shifts. The catch rate at daily inspection is your leading indicator.
Track the ratio monthly
Planned-vs-reactive ratio is your one-number scorecard. If it's improving, cost-per-mile is dropping. If it's not, dig into what's slipping. This is what leadership tracks.
Common Mistakes That Kill PM Programs
Most PM programs don't fail because the strategy is wrong — they fail because of predictable execution errors. Avoid these six.
Tracking PM on paper or spreadsheets
The moment a PM interval depends on someone remembering, misses become inevitable. Automated triggering is the price of entry for a real program.
One-size-fits-all intervals
Highway trucks and urban delivery trucks don't wear the same way. Duty cycle should drive interval — not a single fleet-wide number.
No parts inventory planning
PM without stocked parts becomes reactive PM. Fast-moving parts need min/max thresholds triggered by real consumption data.
Ignoring DVIR defects
The daily inspection is your cheapest early-warning system. Defects that die in a paper binder are failures waiting to happen.
No leadership scorecard
If nobody at leadership looks at the planned-vs-reactive ratio monthly, the program drifts. What gets measured gets managed.
Skipping technician training
A PM program is only as good as the technician executing it. Standardized checklists and photo-verified inspection reduce inspection quality variance.
Frequently Asked Questions
The industry benchmark is 3–9x cheaper — meaning the same repair scheduled as PM costs one-third to one-ninth of the emergency-repair equivalent. Every 10% shift from reactive to planned cuts total maintenance cost 15–20%.
Top-performing fleets run less than 20% reactive maintenance (80%+ planned). Industry average is roughly 45% reactive. Bottom-quartile fleets run 55%+ reactive. Below 20% reactive is the target zone for top-quartile cost-per-mile performance.
Most 50+ vehicle fleets see net-positive returns by month 3, with full break-even inside 6 months. First prevented major breakdown often covers 2–3 months of program cost. Sustained savings typically deliver 15–25% total maintenance cost reduction by month 12.
Yes — for low-cost consumables (wipers, bulbs), non-safety-critical accessories, and redundant systems. Reactive is a legitimate strategy where downtime impact is minimal and secondary damage risk is zero. For anything safety-critical or where failure cascades, planned maintenance is the only correct answer.
Downtime — the cost of the truck not moving. At $448–$760 per vehicle per day and $400–$700 per hour of lost revenue, unplanned downtime dwarfs the repair invoice itself. This is why the reactive multiplier is 3–9x rather than 1.5–2x.
Yes — often with higher percentage ROI than large fleets. Small fleets typically see the sharpest gains because one prevented breakdown has bigger relative impact. Software-based PM programs scale down to as few as 3–5 vehicles with meaningful returns.
Turn every maintenance dollar into planned spend
Automated PM scheduling by asset class. DVIR-to-work-order routing. Planned-vs-reactive ratio dashboard. Cost-per-mile tracking per vehicle. Everything you need to shift from 45% reactive to under 20% — in 12 months or less.