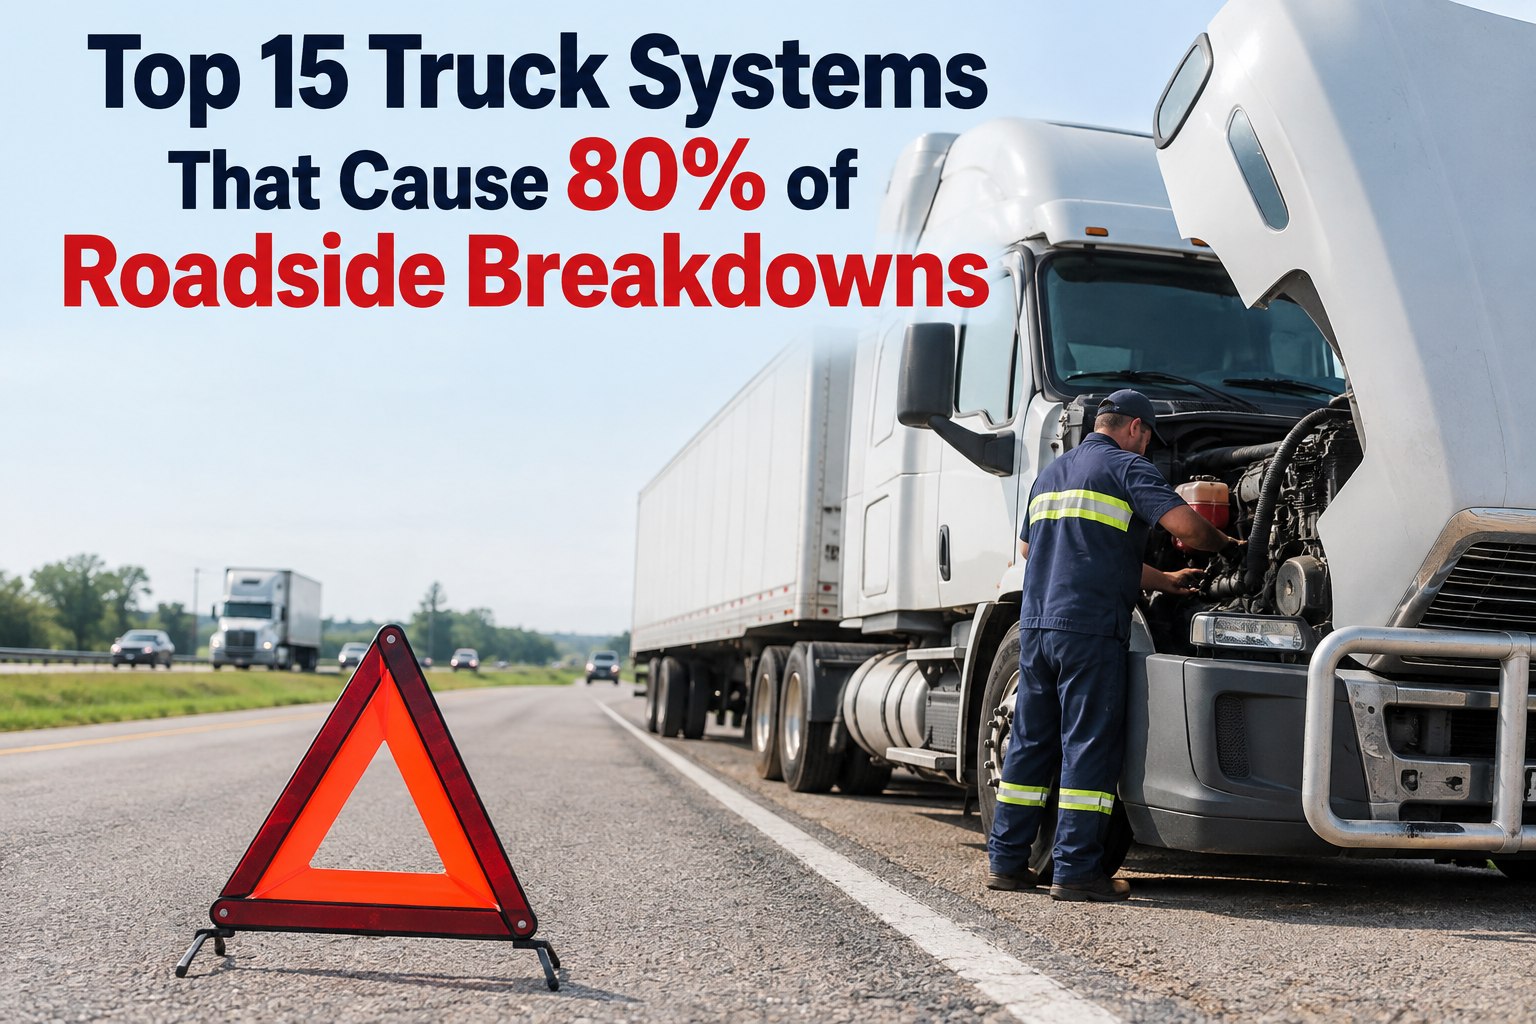
Every roadside breakdown tells the same story: a problem that started small, stayed hidden, and grew expensive. The tire that lost pressure over weeks before it blew on I-40. The battery that flashed warning signs for months before it died at a customer dock. The cooling system that ran hot twice before the engine let go on a deadline haul. None of these are random — they're predictable patterns, and a handful of systems produce the overwhelming majority of them. The 80/20 rule holds hard here: roughly 15 truck systems cause about 80% of roadside breakdowns, and the same four sit at the top of the list year after year. This checklist gives you those systems ranked, the leading indicator that flags each one weeks early, and the pre-emptive PM task that stops it — so you fix them in the bay on your schedule instead of on the shoulder on theirs.Start a free trial and turn these 15 systems into scheduled PM triggers
The 15 Systems Behind 80% of Breakdowns
A few systems cause most of the failures — and every one throws a warning weeks before it strands a truck. Here's the ranked reference: the systems, the leading indicator to watch, and the PM task that pre-empts each one.
The Big Four: Where Most Breakdowns Come From
Before the full 15, know the heavy hitters. These four systems alone account for the bulk of roadside events — and each one degrades on a timeline you can watch, not a switch that flips without warning.
The undisputed leader. Underinflation builds sidewall heat; low tread invites punctures. Watch pressure trends and uneven wear — a slow leak announces itself for weeks.
Behind 29% of truck accidents and the top roadside OOS category. Constant heat and friction wear linings and drift slack adjusters. Squeal, grind, and stroke creep are the tells.
Batteries drive up to ~30% of breakdowns and strand trucks without warning. Voltage decline, hard starts, and corroded terminals are visible long before a no-start at the dock.
Overheating from a failing cooling system takes the whole engine with it if missed. A subtle 2–3°F temperature drift over weeks predicts the failure before the gauge spikes.
The Full 15: System, Leading Indicator, PM Task
Here's the complete reference. Each row pairs a high-breakdown system with the early signal that flags it and the preventive task that pre-empts it. This is the table to build your PM program around. Start free and load all 15 systems into your fleet's PM checklist
| # | System | Leading indicator | Pre-emptive PM task |
|---|---|---|---|
| 1 | Tires | Pressure drift, uneven tread wear | TPMS trending + rotation & alignment |
| 2 | Brakes | Squeal/grind, pushrod stroke creep | Stroke & lining measurement each PM |
| 3 | Battery | Slow crank, voltage decline | Load-test + terminal clean, 3–5 yr replace |
| 4 | Alternator / starter | Dim lights, hard starts | Charging-system test at PM |
| 5 | Cooling system | 2–3°F temp drift, weeping hoses | Coolant test + hose/cap inspection |
| 6 | Belts & hoses | Cracking, glazing, fraying | Visual + tension check, replace on age |
| 7 | Air system | Slow build, audible leaks | Daily tank drain + leak-down test |
| 8 | Aftertreatment / DPF | Regen frequency up, derate warnings | Trace upstream oil leaks; scheduled cleaning |
| 9 | Fuel system | Power loss, water in separator | Filter changes + separator draining |
| 10 | Engine oil / lubrication | Pressure drop, oil-analysis flags | Interval by hours/miles + sampling |
| 11 | Transmission / clutch | Slipping, grind on shift, fluid color | Fluid level & condition checks |
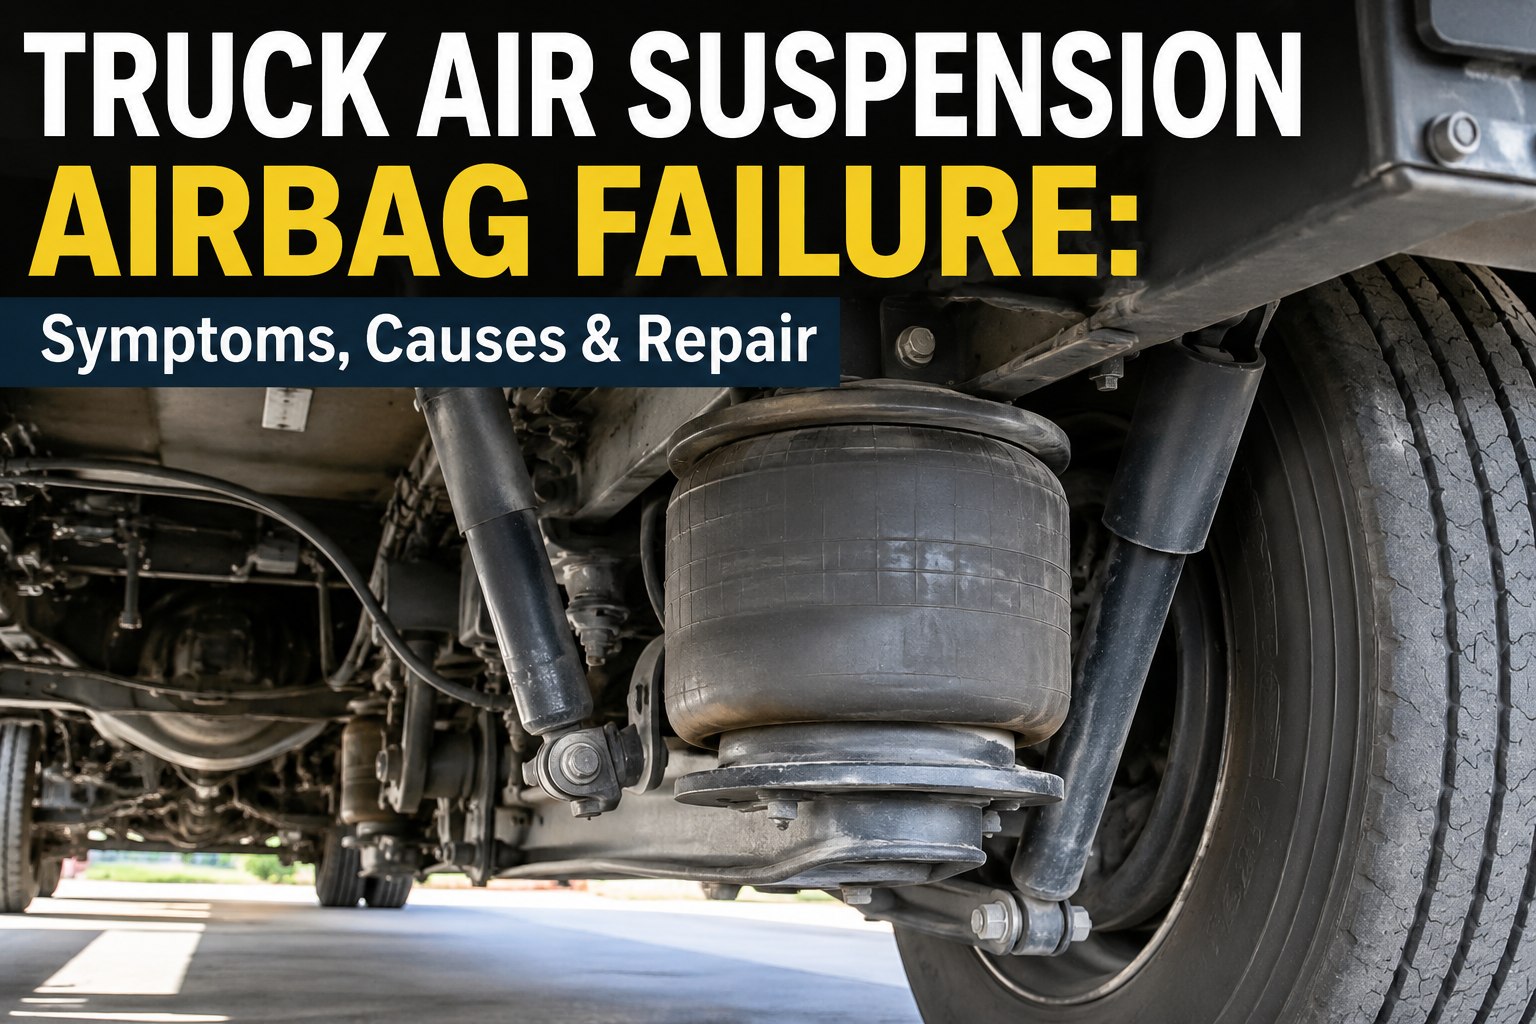
| 12 | Suspension | Uneven ride height, worn bushings | Bushing, spring & airbag inspection |
| 13 | Steering | Excess play, fluid leaks | Play check + fluid & linkage inspection |
| 14 | Lighting / electrical harness | Intermittent lamps, chafed wiring | Lamp test + harness routing check |
| 15 | Wheel ends / bearings | Hub heat, hum, seal leaks | Hub-oil sight-glass + temp comparison |
Catch the Pattern Before It Strands the Truck
Every one of these 15 failures starts as a trend — a pressure creeping down, a voltage sliding, a hub running a few degrees hot. A digital inspection program records those leading indicators at every check, so a developing problem shows up as a trend line before it's a roadside call. Defects route to work orders automatically, PM fires on the right interval per system, and real-time dashboards keep compliance above 95%.
The Tiered Inspection That Covers All 15
You don't catch 15 systems with one inspection — you catch them with three, layered by frequency and depth. This is the cadence top-performing fleets run. Talk to our team about setting up the three-tier inspection cadence.
The fast-moving, high-frequency systems: tires, fluid levels, lights, brake air test, obvious leaks. Catches the majority of breakdown causes at their earliest, cheapest stage.
The systems that drift slowly: battery and charging, belt tension, air-system leak-down, suspension components, steering play. A closer look than a driver walk-around allows.
The measurement-based checks: brake stroke and lining, coolant and oil testing, electrical scans, aftertreatment and wheel-end inspection. Where trends get quantified.
Frequently Asked Questions
Fix the 15 in the Bay, Not on the Shoulder
Replace paper DVIRs and PM spreadsheets with mobile inspections that record every leading indicator, auto-generate work orders when a trend crosses the line, and schedule PM by system so the 15 breakdown causes get caught before they strand a truck. Real-time compliance dashboards keep the whole fleet DOT-ready and above 95% PM compliance year-round.