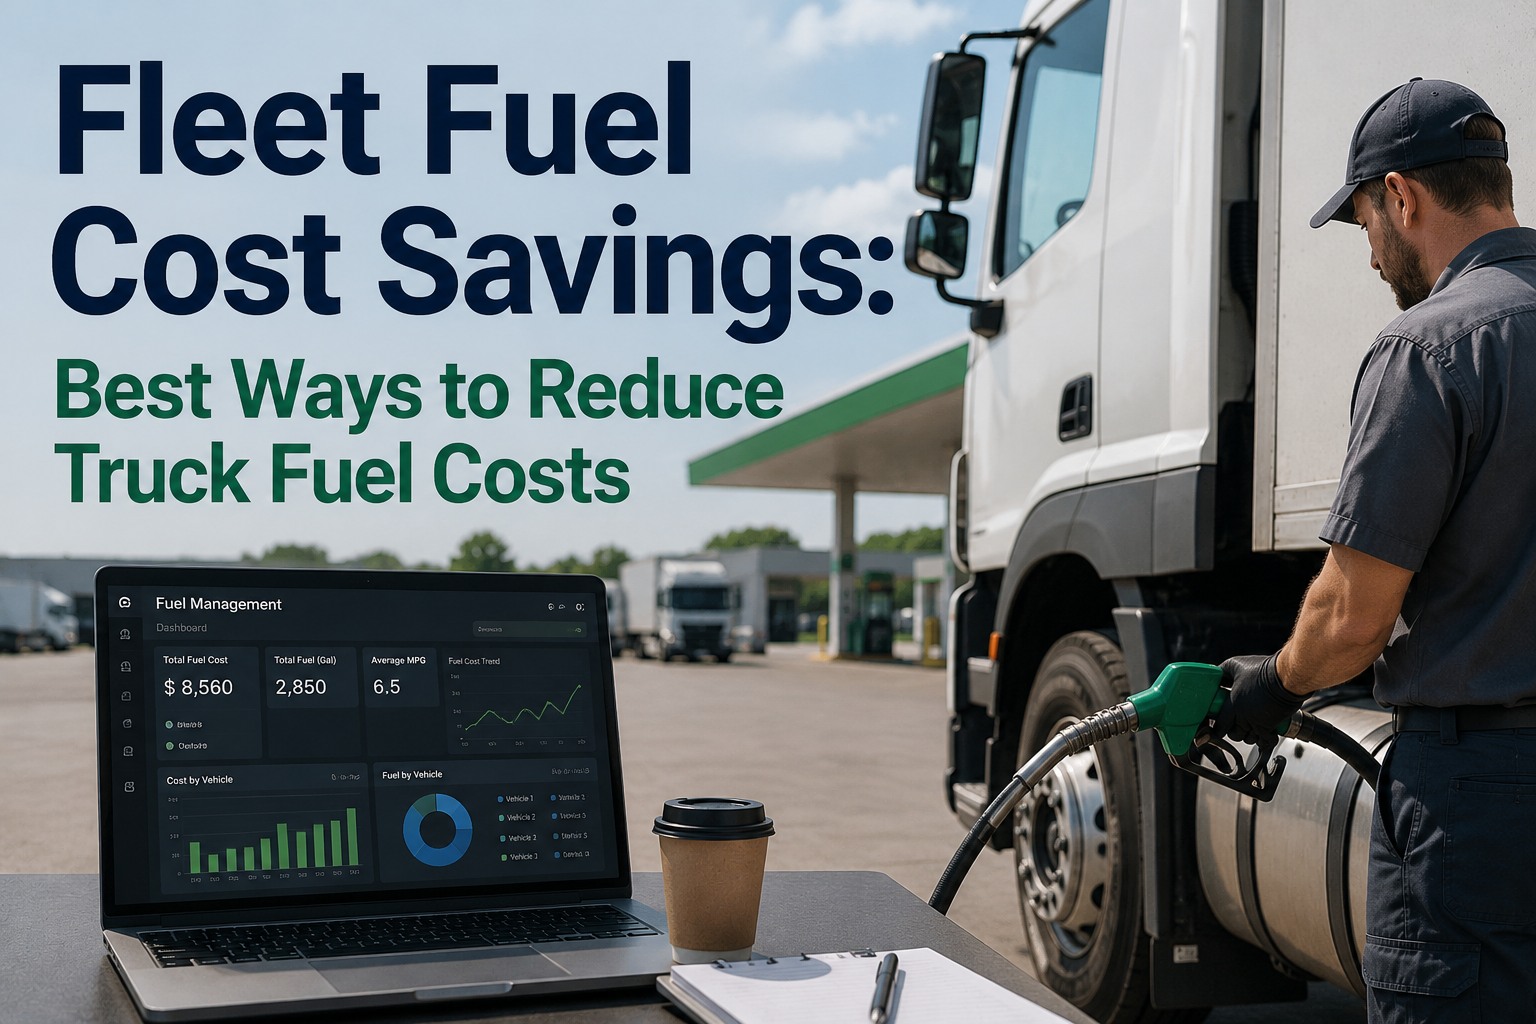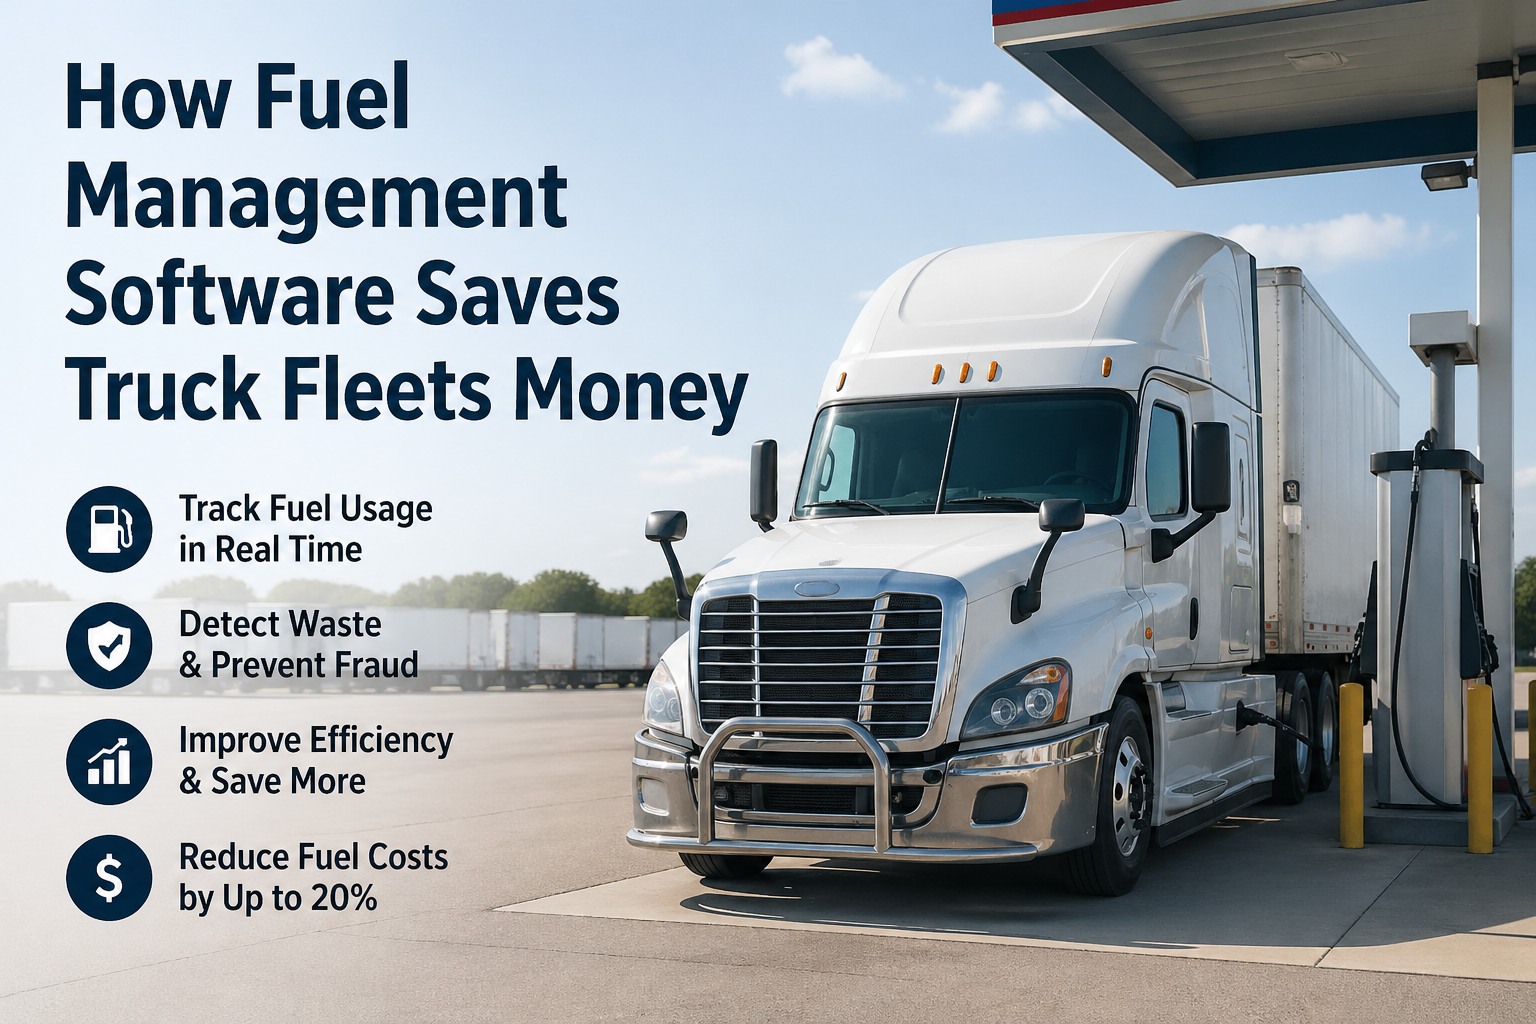
Cutting fuel spend doesn't mean parking trucks, governing every engine to 60 MPH, or telling drivers to coast downhill. Fuel waste — not fuel usage — is where the savings live, and the waste hides in three specific places: idle time, speed, and routing. A Class 8 truck burns 0.8 gallons of diesel per hour at idle, the American Transportation Research Institute puts fuel at $0.48 per mile (one of two largest carrier expenses), and ATA research shows driving at 75 MPH burns 27% more fuel than 65 MPH on the same load, same route. Across a 25-truck fleet idling just 2 hours per day, that's nearly $64,000 burned annually with nothing to show for it. Truck Inspection & Maintenance surfaces where each truck is leaking fuel — idle time, speed patterns, tire pressure, mechanical inefficiency — so fleets cut cost without cutting deliveries. Start your free trial and stop paying for fuel you're not using.
Cut Trucking Fuel Spend Without Slowing Freight
The waste is in idle, speed, and routing — not in how hard your trucks work.
The Three Fuel Drains — Where Every Dollar Actually Leaks
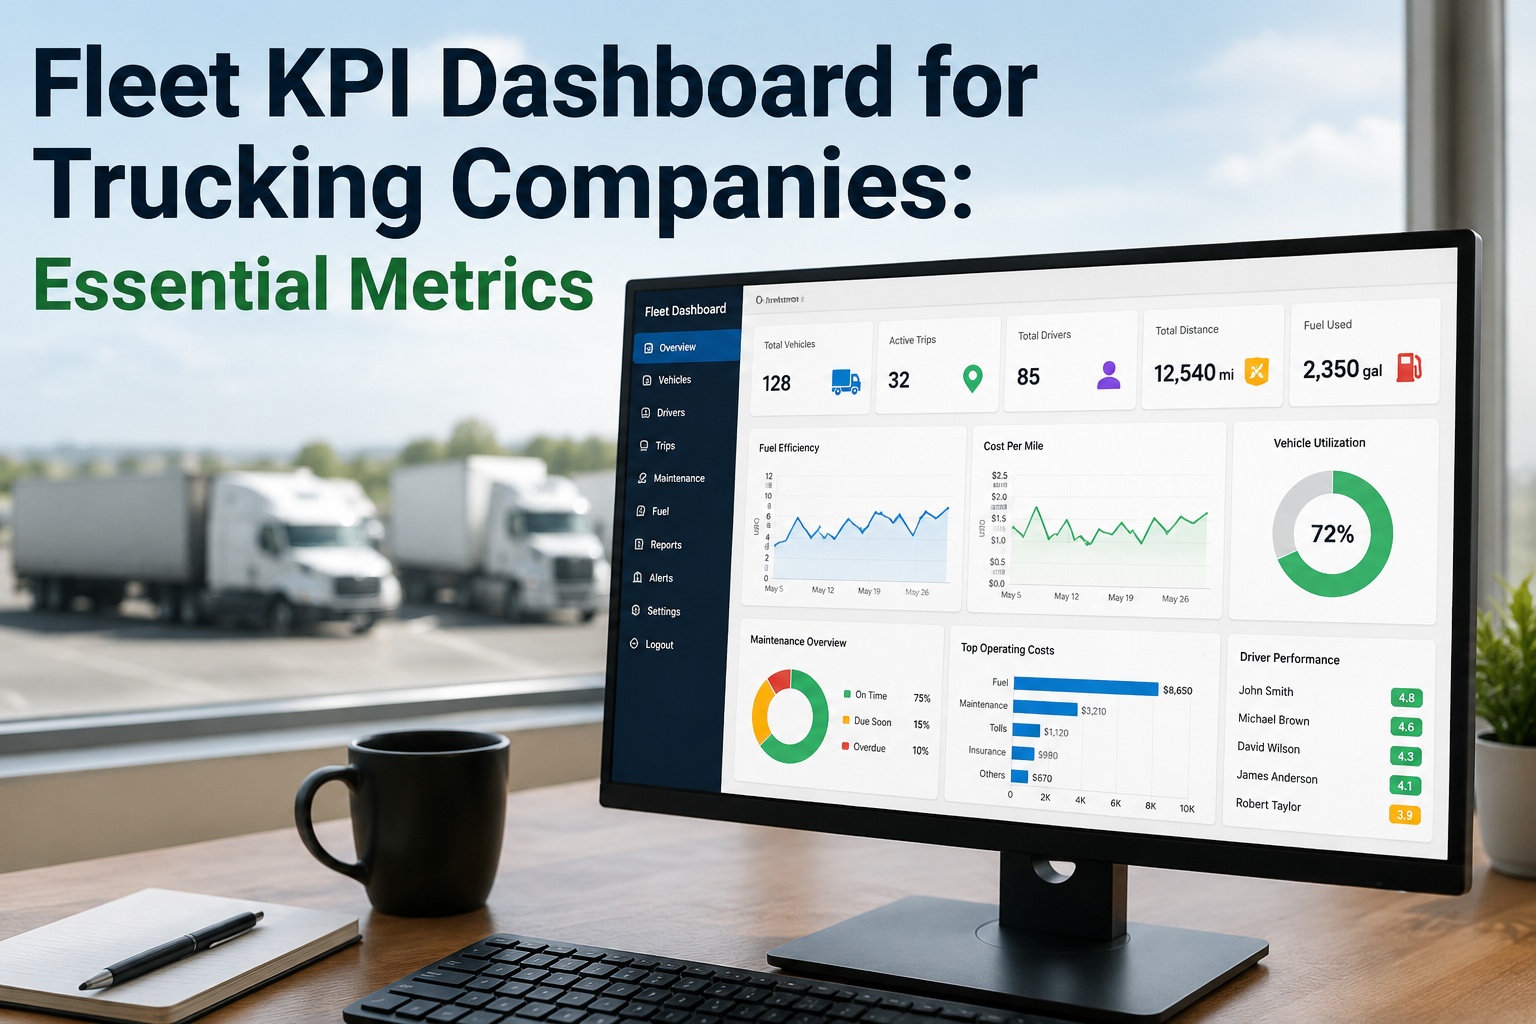
Most fleets chase fuel discounts at the pump. The real money is upstream, in three operational drains that compound across every truck, every shift, every week. Truck Inspection & Maintenance surfaces all three on a single dashboard so the leaks get plugged in priority order:
Idle Time
The fastest, cheapest, biggest win. Most fleets idle 20-35% of engine hours — every one of those hours costs fuel and produces zero revenue.
Speed
Aerodynamic drag rises with the square of speed. 75 MPH burns 27% more fuel than 65 MPH on the same load — and saves only 90 minutes per 600-mile run.
Routing & Behavior
Deadhead miles, fuel-stop selection, hard braking, and unplanned reroutes silently add 10-15% to fuel spend. Visible only when you measure it per asset.
The Idle Calculator — What Your Fleet Burns Sitting Still
Idle time is the single most expensive habit in commercial trucking, and almost every fleet underestimates it. Here's the math, scaled per fleet size at $3.50/gallon diesel — Truck Inspection & Maintenance shows you exactly which trucks land where on this chart:
The Speed-MPG Curve — Where 5 MPH Costs You Real Money
The relationship between speed and fuel isn't linear — it's exponential, because aerodynamic drag rises with the square of velocity. Drop 5 MPH on highway runs and the MPG gain shows up at the end of every quarter. Truck Inspection & Maintenance logs average speed per asset so this trade-off is measurable, not assumed:
The 5 Hidden Mechanical Killers — Where Trucks Quietly Leak MPG
Mechanical inefficiency is the quietest fuel drain because nothing breaks. The truck runs fine, the gauge climbs slower, the cost per mile creeps up 5% then 8% then 12%. Truck Inspection & Maintenance builds these checks into the standard inspection template so the drift gets caught:
Underinflated Tires
−0.5% to −1% MPG per 10 PSI
1 in 5 Class 8 tractors operate underinflated. On an 18-tire truck, three low tires drag down fuel economy on every mile. Logged on every pre-trip in our platform.
Misaligned Wheels & Axles
−2% to −5% MPG
Tires fighting the road waste energy as heat. Symptoms: uneven wear, drift, steering pull. Caught during PM B tire inspection routines.
Clogged Air Filter
−2% to −10% MPG
Restricted airflow means richer fuel mixture and incomplete combustion. The cheapest fix in the shop, almost never tracked. Our platform schedules it by mileage.
Worn Injectors / DPF Issues
−3% to −7% MPG
Failed injectors and clogged emissions hardware quietly degrade combustion. Forced regen cycles can take 45 minutes — wasted fuel and wasted time.
Missing Aero Equipment
−5% to −15% MPG
Cracked side skirts, missing trailer tails, raised cab deflectors. Drag is invisible until you measure MPG before and after. Documented per asset in inspection records.
Worn Engine + Drivetrain
−3% to −8% MPG
Slipping clutches, worn differential, sloppy turbo response. Older trucks drift downward; tracking MPG per asset over time exposes which units need attention.
See where every gallon goes — per truck, per driver, per week.
Truck Inspection & Maintenance logs idle time, average speed, tire-pressure history, and PM completion against each asset — then surfaces the trucks burning the most cash. Free for up to 3 vehicles. Contact support to plan your rollout.
The Driver Behavior Scorecard — What Top Fleets Track Weekly
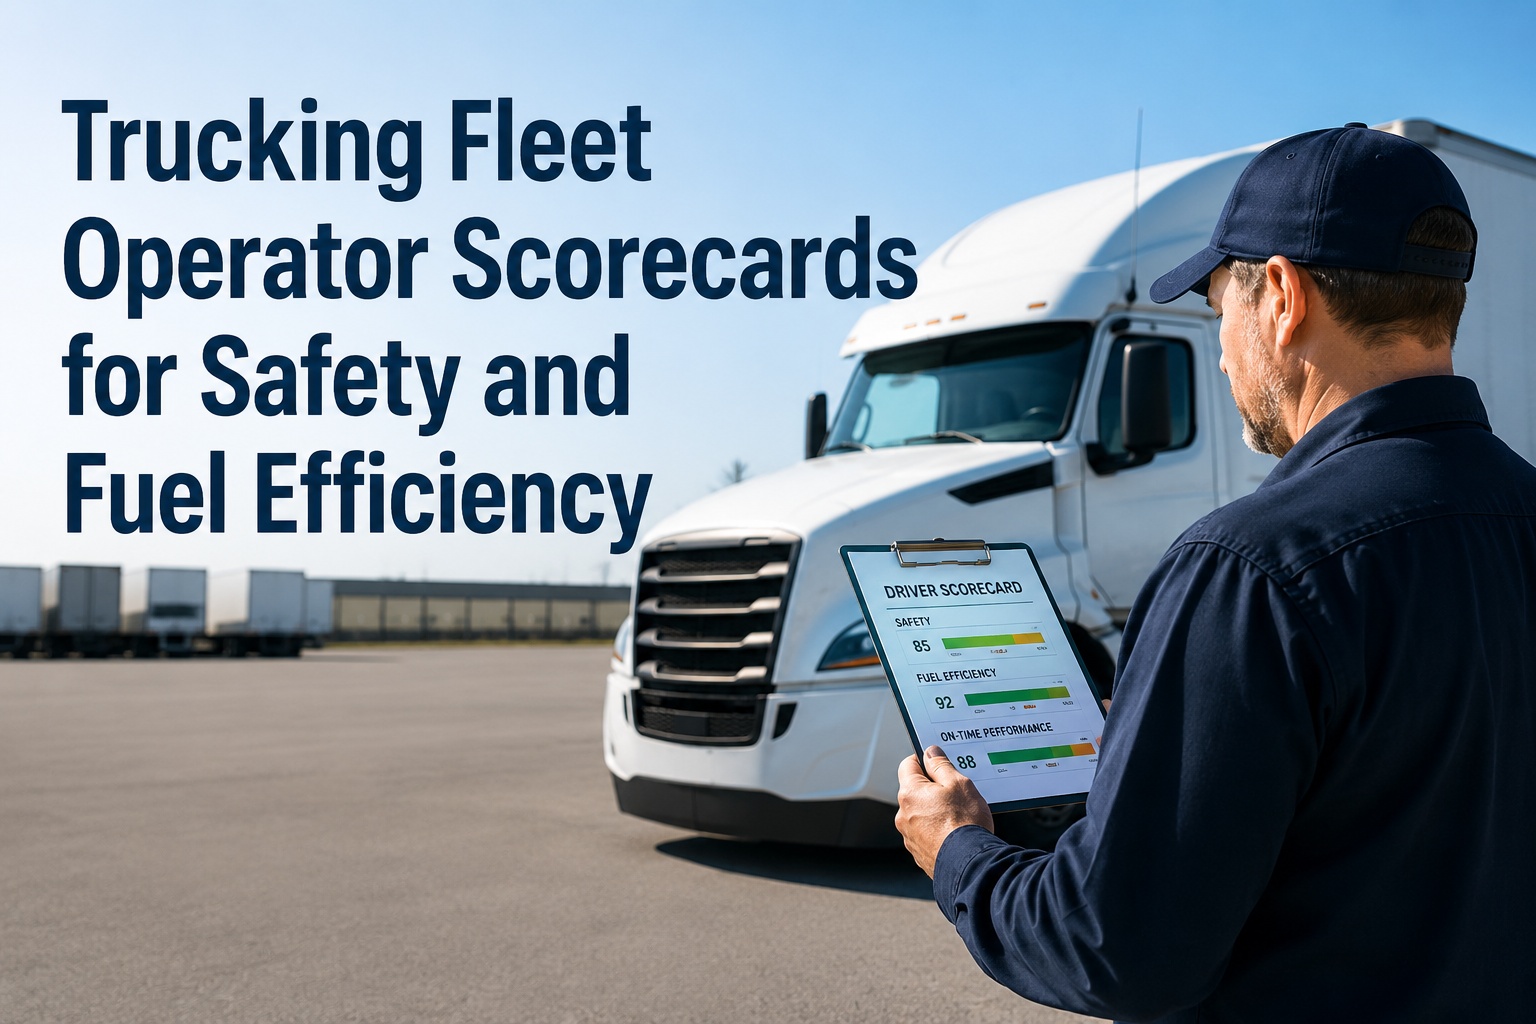
Driver habits move fuel economy 5-15% across the same equipment, same routes, same loads. The fleets that improve don't just train drivers — they score them weekly and put the numbers in front of every driver. Truck Inspection & Maintenance ties every metric below to the driver, not just the truck:
Idle Ratio
Idle hours ÷ total engine hours. Top drivers stay under 12%. Below 8% is exceptional and signals great loading-dock discipline.
Average Cruise Speed
Cruise-control hours ÷ moving hours. Top drivers run cruise 80%+ of highway time, holding the truck at the fuel sweet spot.
Hard Braking Events
Per 100 miles. Excessive braking signals tailgating and poor anticipation — every brake is fuel converted to heat. Target: under 1 event per 100 mi.
RPM in Top Gear
Percentage of drive time in top gear. Drivers who skip-shift or lug the engine waste fuel on every pull. Target: 95%+ in top gear at cruise.
The Annual Savings Stack — What Adding It All Up Looks Like
None of these levers move the needle on their own. Stacked, they move it dramatically. Here's what a 25-truck fleet can realistically save in a year by hitting moderate (not aggressive) improvement targets on each line:
Frequently Asked Questions
How does Truck Inspection & Maintenance help cut fuel spend?
The platform tracks fuel-related metrics per asset on every inspection — tire pressure, air filter condition, idle time logs, mileage between fills, and PM completion. Trends surface the trucks running below fleet average MPG, so corrective action is targeted instead of fleet-wide. Most fleets recover 5-12% of fuel spend within the first quarter just by acting on what they didn't previously see.
What's the fastest fuel saving I can implement?
Idle time reduction — almost always. It's the only fuel-saving lever that requires no equipment changes, no driver retraining, and no route changes. Start by setting a 5-minute idle threshold and tracking which drivers and trucks exceed it. Most fleets cut idle hours 30-50% in 60 days just from making the data visible. Sign up free to start tracking idle ratios per asset.
Should I governor my trucks at a lower speed?
Not necessarily — and definitely not aggressively. The fuel savings between 70 MPH and 65 MPH are real, but the time cost on long-haul lanes shows up in HOS planning and driver retention. Many fleets get most of the benefit with a 68-69 MPH governor plus cruise-control discipline, rather than dropping all the way to 62 MPH.
Do tire pressure checks really matter for fuel economy?
Yes — and most fleets underestimate the impact because the math compounds. 10 PSI under spec costs 0.5-1% MPG per tire. On an 18-tire truck with 3 low tires, that's 2-3% MPG lost on every mile run. Across a 25-truck fleet at average duty cycle, fixing tire pressure can save $10K-$15K per year on fuel alone.
What MPG should I expect from a Class 8 truck?
Industry average runs 5-7 MPG under typical long-haul conditions. Newer aerodynamic tractors with disciplined driving can hit 7-8 MPG. Flatbeds and oversized loads run lower due to drag. The number matters less than the trend per asset — a truck dropping from 6.5 to 5.8 MPG over six months is signaling something the inspection record should catch.
Will a CMMS pay for itself just on fuel savings?
For fleets above 10 trucks, almost always — and usually within 60-90 days. Recovering 5-8% on a $0.48/mile fuel cost across 100,000 annual miles per truck is real money. Add in maintenance savings and downtime prevention and the ROI math gets easy. Talk to our team for a quick ROI walkthrough on your fleet size.
Stop paying for fuel you're not using.
Truck Inspection & Maintenance surfaces idle time, speed patterns, tire pressure, and mechanical efficiency per asset — so fleets cut fuel spend without slowing freight. Free for up to 3 vehicles. No hardware. No contracts.