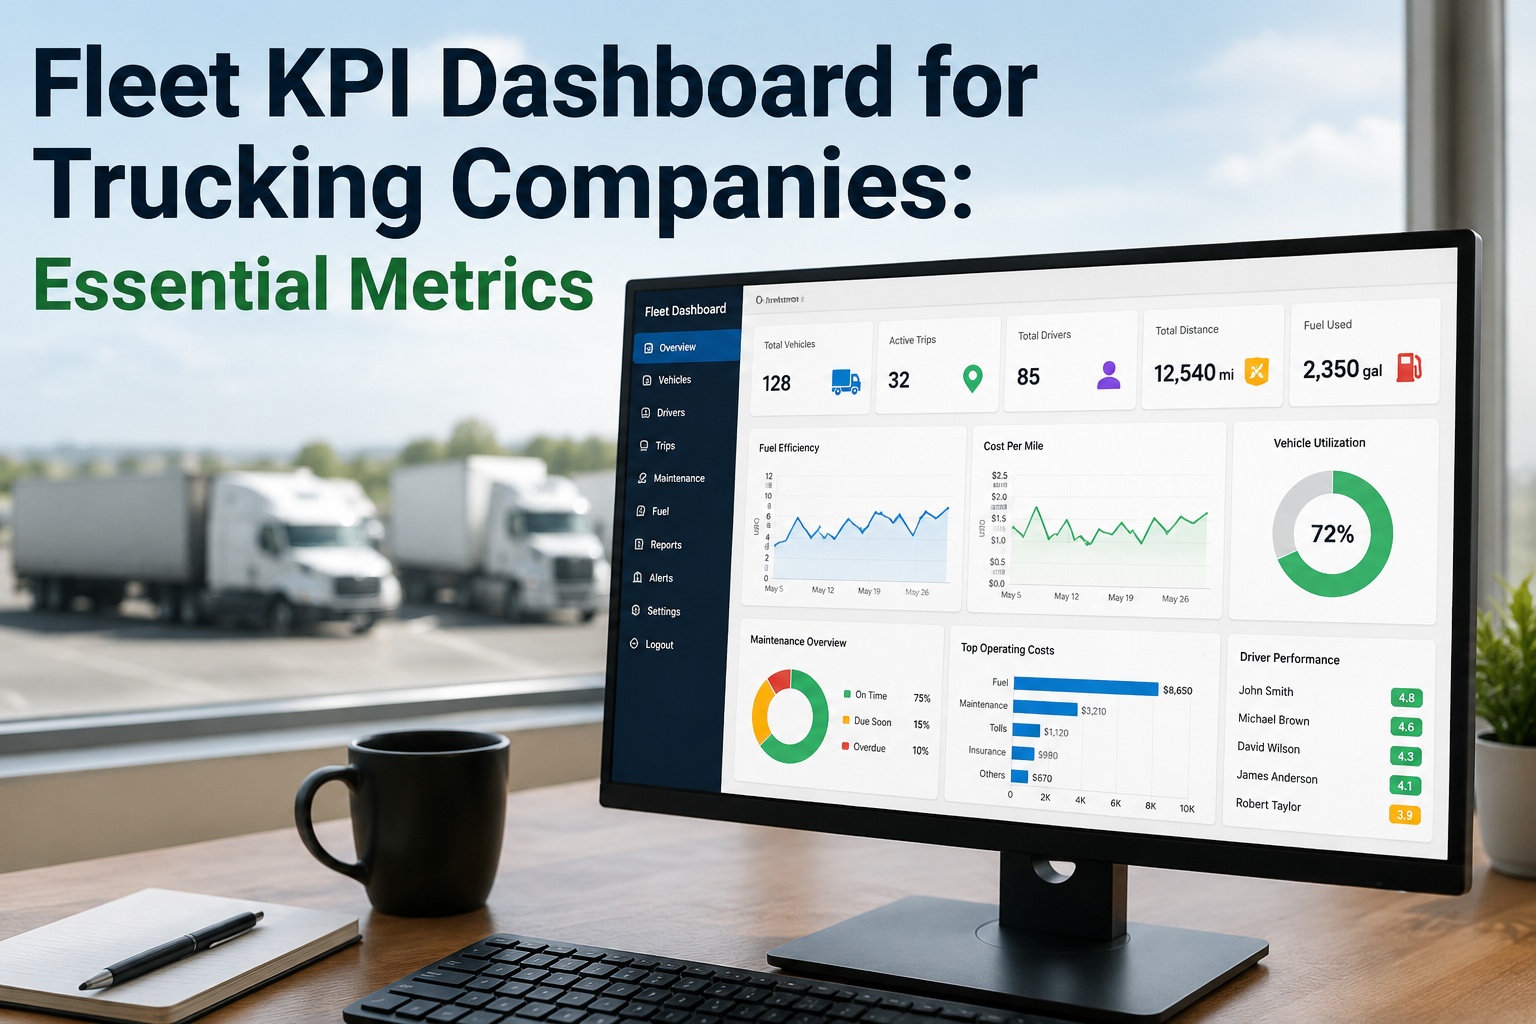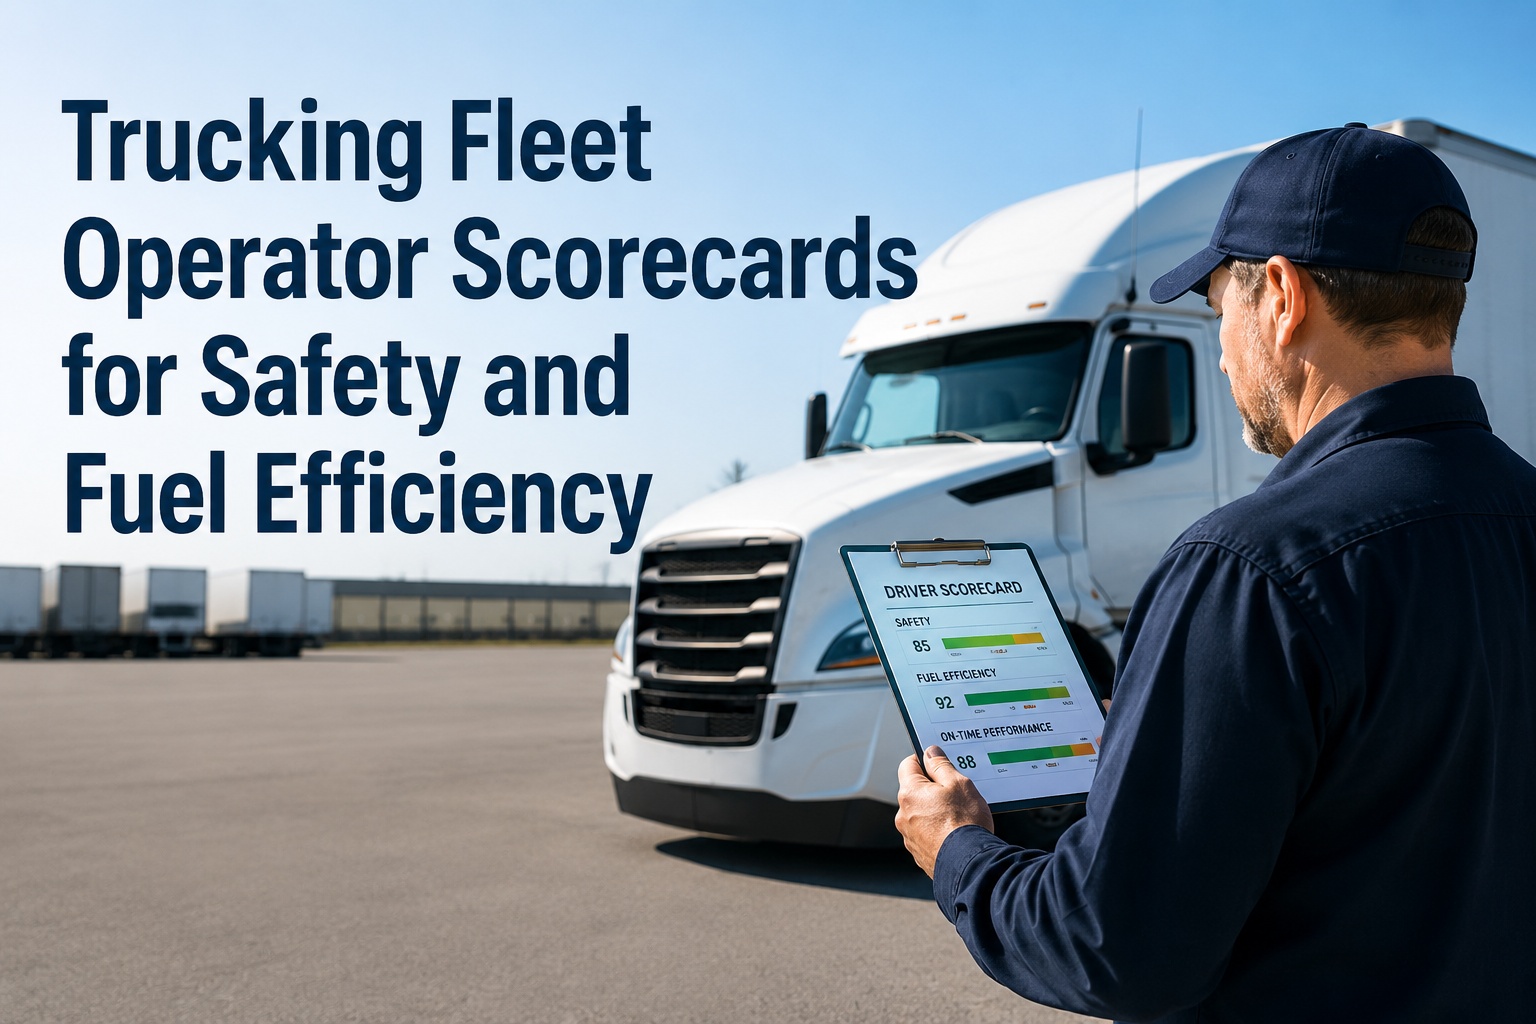
A driver scorecard is one of the most powerful tools a fleet has — and one of the easiest to get catastrophically wrong. Done well, it turns invisible day-to-day driving into a clear, motivating signal: drivers see where they stand, coaching gets targeted, fuel and crash costs drop, and good performance gets recognized. Done badly — comparing a mountain-route driver against a flat-interstate one on raw fuel economy, or scoring hard-braking events without accounting for the urban routes that demand them — it becomes a machine for resentment, gaming, and turnover. The difference isn't the metrics; nearly every fleet measures the same things. The difference is fairness: whether the scorecard normalizes for the conditions a driver can't control, weights what actually matters, and stays controllable, meaningful, and transparent. This guide covers the weighted category model, the fairness mechanics that earn driver buy-in, leading versus lagging indicators, and the test every metric must pass. And it covers the one input fleets forget: vehicle care, the maintenance-and-inspection behaviors a fair scorecard should reward. Truck Inspection & Maintenance feeds that data in. Talk to our team to fold it into your program.
Trucking Driver Scorecards That Actually Work
Fair scorecards motivate. Unfair ones breed turnover. Here's the difference.
Fairness Is the Whole Game
Before a single metric, internalize this: a scorecard's success is decided by whether drivers accept it as legitimate. The metrics are commodities — every fleet tracks braking, MPG, and on-time. What separates a scorecard that lifts performance from one that drives your best people out the door is whether it compares like with like and accounts for what's beyond the driver's control.
- Compares drivers on similar routes & vehicles
- Normalizes for gradient, traffic & load
- Scores only what the driver controls
- Transparent, with a challenge process
- Drives coaching & recognition
- Ranks all drivers on one raw number
- Penalizes hard routes & heavy loads
- Scores weather & traffic the driver can't change
- Opaque — no way to dispute an error
- Breeds gaming, resentment & turnover
The Weighted Category Model
An effective scorecard blends 8–12 metrics across a few categories, each weighted to signal what matters most. Safety leads. Here's a balanced starting model — tune the weights to your operation's priorities. Start a free account to feed vehicle-care data into your scorecard.
Safety
30–40%Hard braking, rapid acceleration, speeding, following distance, distracted-driving events.
Efficiency & Fuel
20–25%Fuel economy (MPG), idle-time percentage, route adherence, on-time delivery.
Compliance
20–25%HOS adherence, pre-trip inspection completion, documentation accuracy, certifications.
Vehicle Care
15–20%DVIR quality, defect reporting, maintenance-alert response, damage reports.
Customer Service
10–15%Delivery ratings, complaint frequency, communication scores.
The vehicle-care data most scorecards miss
Safety and fuel get all the attention, but DVIR quality, defect reporting, and inspection completion are controllable, fair, and predictive. Truck Inspection & Maintenance captures every driver's inspection and defect-reporting behavior — clean, objective data to feed the vehicle-care slice of your scorecard. No hardware, no contracts. Sign up free and reward the drivers who protect your equipment.
The Fairness Mechanics
Fairness isn't a vibe — it's three concrete data operations that turn raw numbers into comparisons drivers accept. Skip them and the scorecard loses legitimacy the first time a good driver gets a bad score for a hard route. Reach our team to discuss fair data inputs.
Normalization
Adjust for the conditions a driver can't control — route gradient, traffic density, load weight, vehicle type. Urban routes alone swing fuel economy by ~40% versus highway.
Like-for-like benchmarking
Compare each driver only against peers on similar routes, vehicles, and distances — not the whole fleet on one raw ranking.
Weighting & thresholds
Weight metrics by real importance and define clear bands — excellent, satisfactory, needs-improvement — so a score means the same thing for everyone.
Leading vs Lagging Indicators
The best scorecards balance two kinds of metric. Lagging indicators tell you what already happened; leading indicators predict what's coming — and let you coach before a crash, not after. Use both.
Behaviors that show up in data before an incident: harsh braking, speeding, close following distance, declining inspection quality. Coach these to prevent outcomes.
Results after the fact: accidents, violations, fuel spend, on-time rate. Important for accountability — but too late to change what already happened.
The Test Every Metric Must Pass
Before adding any metric, run it through four questions. If it fails one, it weakens the scorecard and erodes trust. Subjective, opinion-based measures fail immediately — they invite disputes and gaming.
Frequently Asked Questions
What makes a driver scorecard fair?
Three things: normalization, like-for-like benchmarking, and controllability. Normalize for route gradient, traffic, load weight, and vehicle type so a mountain-route driver isn't penalized against a flat-interstate one — urban driving alone swings fuel economy about 40%. Benchmark drivers only against peers on similar routes and equipment. And score only what the driver controls, not weather or traffic. Without these, comparisons feel unfair and drivers stop trusting the system. Start a free account to feed fair data in.
How should I weight scorecard categories?
A balanced model weights safety heaviest at 30–40% (hard braking, speeding, following distance), efficiency and fuel at 20–25% (MPG, idle time, on-time), compliance at 20–25% (HOS, inspections, documentation), vehicle care at 15–20% (DVIR quality, defect reporting), and customer service at 10–15%. Weighting signals what matters most, so tune it to your priorities — cost-focused fleets lean on fuel, high-risk operations on safety. Talk to our team about category inputs.
Why do unfair scorecards increase turnover?
Because drivers experience them as punishment for things they can't change. Rank a driver poorly for a hard route, heavy load, or traffic-choked lane and you've told a good worker the system is rigged against them — which breeds resentment, gaming of the metrics, and ultimately exits. In a market where retaining experienced drivers is already hard, an unfair scorecard actively works against you. Fairness through normalization is what keeps it a motivator, not a grievance. Sign up free to build it on fair inputs.
What's the difference between leading and lagging indicators?
Lagging indicators measure outcomes that already happened — accidents, violations, fuel spend. Leading indicators measure behaviors that predict those outcomes — harsh braking, speeding, close following, declining inspection quality. Repeated risky behaviors usually show up in data long before a collision is recorded, so leading indicators let you coach proactively and prevent the incident. A strong scorecard uses both: leading to improve, lagging to hold accountable. Contact us about predictive inputs.
How many metrics should a scorecard have?
Around 8–12, spread across safety, efficiency, compliance, vehicle care, and service. Too few and you miss important behavior; too many and the score becomes noise drivers can't act on. Every metric should pass four tests — measurable, controllable, meaningful, and actionable — and you should avoid subjective, opinion-based measures entirely, since they invite disputes and let scores be manipulated. Review the metric set quarterly. Start free to capture objective inputs.
How does vehicle maintenance fit into a scorecard?
It's the often-overlooked vehicle-care category — worth roughly 15–20%. DVIR completion and quality, accurate defect reporting, and response to maintenance alerts are all controllable, objective, and predictive of both equipment health and safety culture. A driver who consistently does thorough pre-trips and reports defects honestly is protecting your fleet — and a fair scorecard rewards that. Digital inspection data makes this slice clean and gameable-proof. Contact us to feed inspection data in.
Build the vehicle-care half of a fair scorecard.
Truck Inspection & Maintenance captures DVIR completion, inspection quality, and defect-reporting behavior for every driver — objective, controllable, fair data to feed the vehicle-care slice of your scorecard, alongside the safety and fuel metrics. Free for up to 3 vehicles, no hardware, no contracts.