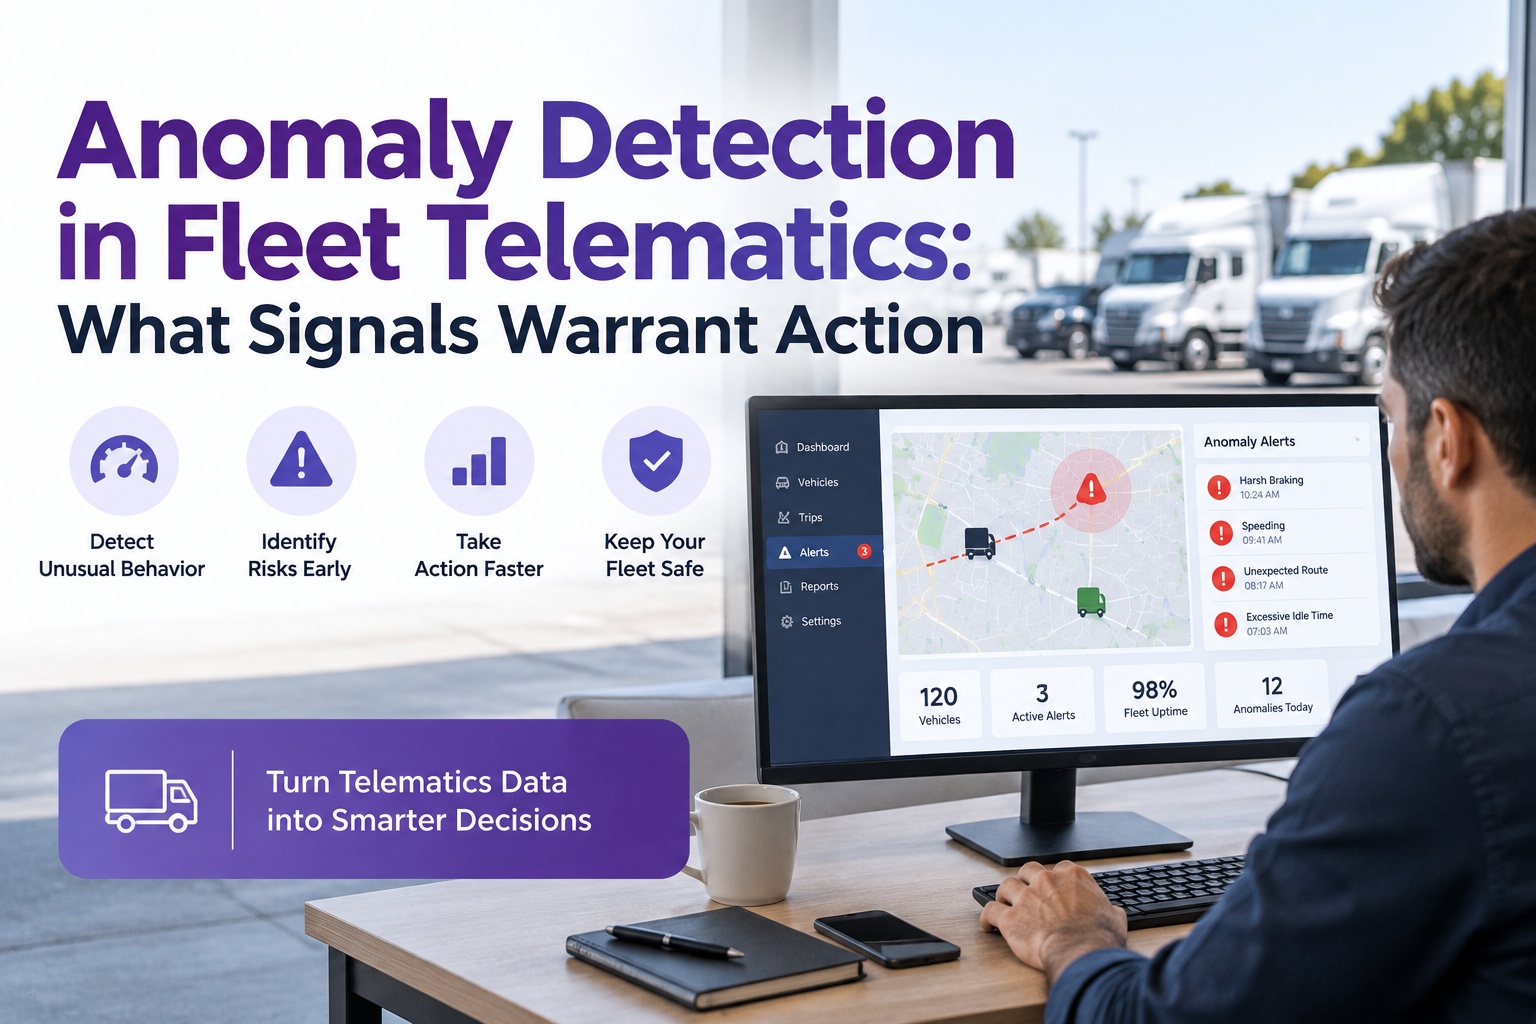
Every modern truck streams thousands of data points a day, and most of them are fine — that's why static-threshold alerts either fire on everything or fire on nothing. Anomaly detection asks a different question: is this truck behaving unlike itself? This guide covers the signals that warrant action and the workflow that turns them into work orders instead of dismissed pings. Start free and put anomaly detection on top of your existing telematics feed.

Signal → Baseline → Anomaly → Work Order

Your Telematics Feed Isn't the Problem — Reading It Is

Static thresholds either alert on everything or alert on nothing. Truck Inspection & Maintenance Management Software layers anomaly detection over the telematics feed you already pay for: it learns each truck's baseline, flags the readings that break that baseline for the first time, and routes the ones that warrant action into a graded work order — so the shop sees a shortlist worth chasing instead of a firehose worth ignoring.

Baselinedper truck, per route, per season
Gradedevery anomaly assigned a severity before it hits a phone
Routedactionable signals become work orders, not another ping

Static Threshold vs. Anomaly Detection — What Actually Changes

A static threshold fires when a number crosses a line: coolant temp above 220°F, idle above 40%, MPG below 5.5. It doesn't care whether that number is unusual for that truck, that day, or that load. Anomaly detection asks a different question — is this reading unlike what this specific truck has been doing lately — and answers it with the truck's own recent history as the reference. The two aren't rivals; they work together. Static thresholds catch the bright-line safety limits an engine derate is built on. Anomaly detection catches the slow drift a threshold would never see until the day it becomes a breakdown.

STATIC THRESHOLD "Alert when value crosses X"
  • Same limit for every truck regardless of duty cycle
  • Fires on any brief spike — even harmless ones
  • Misses slow drift below the threshold
  • Tuned once, ignored forever
  • Best for hard safety limits (engine protection, DPF regen)
ANOMALY DETECTION "Alert when this truck breaks its own baseline"
  • Baseline is per-truck, per-route, per-season
  • Ignores brief spikes; catches sustained deviations
  • Catches drift weeks before it hits a threshold
  • Re-learns itself as duty cycles change
  • Best for the "something's off but nothing's over" cases
Why both, not either A modern telematics stack runs static thresholds and anomaly detection side by side. Static thresholds are the fence around the cliff — coolant > 240°F, oil pressure < 15 psi, an FMI 0/1 lamp lit — and they page instantly, no baseline required. Anomaly detection is the trip-wire on the walk toward the fence: MPG creeping down 3% week over week, idle percentage drifting up on the same driver's route, a DPF regen cycle happening twice as often as last month. Miss either half and you're relying on luck.

The Signal Universe — Where Anomalies Actually Live

Telematics data streams from four broad families: engine and drivetrain (J1939 SPN readings, DM1 fault codes), driver behaviour (accelerator position, brake events, speed profile), operational context (idle time, route, geofence entries), and physical environment (ambient temperature, GPS grade). Not every family produces equally actionable anomalies. The map below is where the productive signals live — and where the noise-heavy ones live that most fleets waste time chasing.

01
Engine & Drivetrain Source: J1939 SPN / DM1 / DM2
Coolant temp driftBaseline creeping up 5–8°F over 2 weeks on the same route — cooling-system silting weeks before the derate.
DPF regen frequencyActive regens firing 2× more often than last month — approaching a face-plugged filter and forced service regen.
Oil pressure trendCold-start pressure falling toward the alarm floor — bearing clearance opening up before the low-pressure switch trips.
SPN/FMI repeat patternSame intermittent SPN clearing itself between cycles — the classic "no one reported it" fault that becomes a roadside DM1.
02
Fuel & Efficiency Source: J1939 SPN 183 fuel rate / SPN 247 hours
MPG per driver per routeSame route, same driver, MPG down 4% week over week — injector wear, DPF loading, tire under-inflation, or dragging brake.
Idle-fuel shareIdle-fuel percentage jumping outside driver-baseline — behaviour change or PTO-on-standby not shutting down.
Fuel-fill anomaliesFill event that doesn't match consumed volume — sensor drift, siphoning, or an unlogged transfer.
03
Driver Behaviour Source: derived from CAN speed / accelerator / brake
Harsh-brake rate anomalyDriver's harsh-brake count doubles on their normal route — road condition, fatigue, or a brake-drag pulling them into hard stops.
Over-speed streaksSustained speed above baseline for the segment — worth a coaching conversation before a CSA Unsafe Driving hit.
RPM profile changeAverage RPM up 200+ on same load class — clutch slip, driver over-revving, or a transmission not shifting into top gear.
04
Operational Context Source: GPS + geofence + duty-cycle
Route deviationTruck off its usual corridor without a dispatch order — mis-routed load, personal use, or detour that adds cost.
Engine-hours-to-miles ratioRatio rising sharply — high-idle deployment, PTO-heavy shift, or a duty cycle that now needs engine-hour PM triggers.
Unusual after-hours activityIgnition-on outside scheduled hours — moonlighting, theft, or an unlogged move at the yard.

The Severity Grade — Which Anomalies Warrant Action

Not every anomaly is an emergency. In fact, most aren't — the point of detection is to surface them so a human can decide, not to page a mechanic every time a truck sneezes. The right software attaches a severity grade to every anomaly at the moment it's flagged, so a shop lead can triage the queue in the first cup of coffee instead of drowning in it. Below is the grading scheme that maps to the way FMCSA-compliant fleets actually work.

P1 · CRITICAL
Act now — before the next trip Same-day response

Engine-protection lamp lit (J1939 FMI 0/1), coolant > 240°F, oil pressure < 15 psi, DPF forced-regen, active DM1 for a safety-critical component. Truck comes off the schedule until inspected.

P2 · WARNING
Schedule within the week 4-hour acknowledgement

Baseline drift on a critical parameter (coolant trending, DPF regens doubling, MPG down 3–5%), repeat SPN/FMI on the same unit, harsh-brake rate anomaly. Add to next PM slot; watch closely.

P3 · INFORMATIONAL
Log & review at next weekly Weekly digest

Idle-fuel share creep, minor route deviations, single-instance harsh events. Not urgent. Reviewed in the weekly fleet meeting for pattern, not paged out mid-shift.

The Right Signal, at the Right Grade, to the Right Person

Anomaly detection only pays back when the shortlist that comes out the other end is small enough to act on. Our software grades every anomaly at the moment it's flagged, routes P1 events to dispatch and shop lead simultaneously, adds P2 events to the next PM slot as a scheduled work order, and rolls P3 events into a weekly digest — so the phone rings for what's actually urgent and everything else lands on the schedule it belongs on.

The Detection Approach — How the Baseline Actually Works

There are three usable approaches to anomaly detection in fleet telematics, and mature platforms run more than one at the same time because each catches a different kind of signal. The mistake is picking one and calling it done. Static thresholds are how you catch the bright-line safety events. Statistical baselines are how you catch the drift. Model-based detection is how you catch the shape-changes — the ones where the value is fine but the relationship between two values isn't.

A
Static Threshold Best for: hard safety limits

Fixed number on a single metric. Coolant > 240°F. Oil pressure < 15 psi. FMI 0/1 lamp lit. Fires instantly, no learning required. What engine-protection strategies are built on.

B
Statistical Baseline Best for: drift and creep

Rolling mean and standard deviation per truck, per route. Flags a reading > 2σ from the truck's own recent history. Catches MPG creep, idle-percentage drift, DPF regen-frequency changes.

C
Model-Based Detection Best for: relationship changes

Learns the joint pattern of several metrics — coolant vs. ambient, fuel-rate vs. load, RPM vs. speed. Flags when the relationship breaks even if each metric is still individually fine. Catches the subtle failures thresholds miss.

The alert-fatigue tax The single biggest predictor of whether a detection program works isn't the sophistication of the model — it's the false-positive rate the shop sees in week one. If half the alerts are noise, the shop stops reading them by week three, and the good alerts get dismissed alongside the noise. That's why every serious detection platform starts wide (loose thresholds, aggressive grading) and tightens over the first month as real anomalies are confirmed. Deploying a tight configuration on day one is how detection programs quietly die.

The Anomaly-to-Work-Order Workflow — Where Most Programs Break

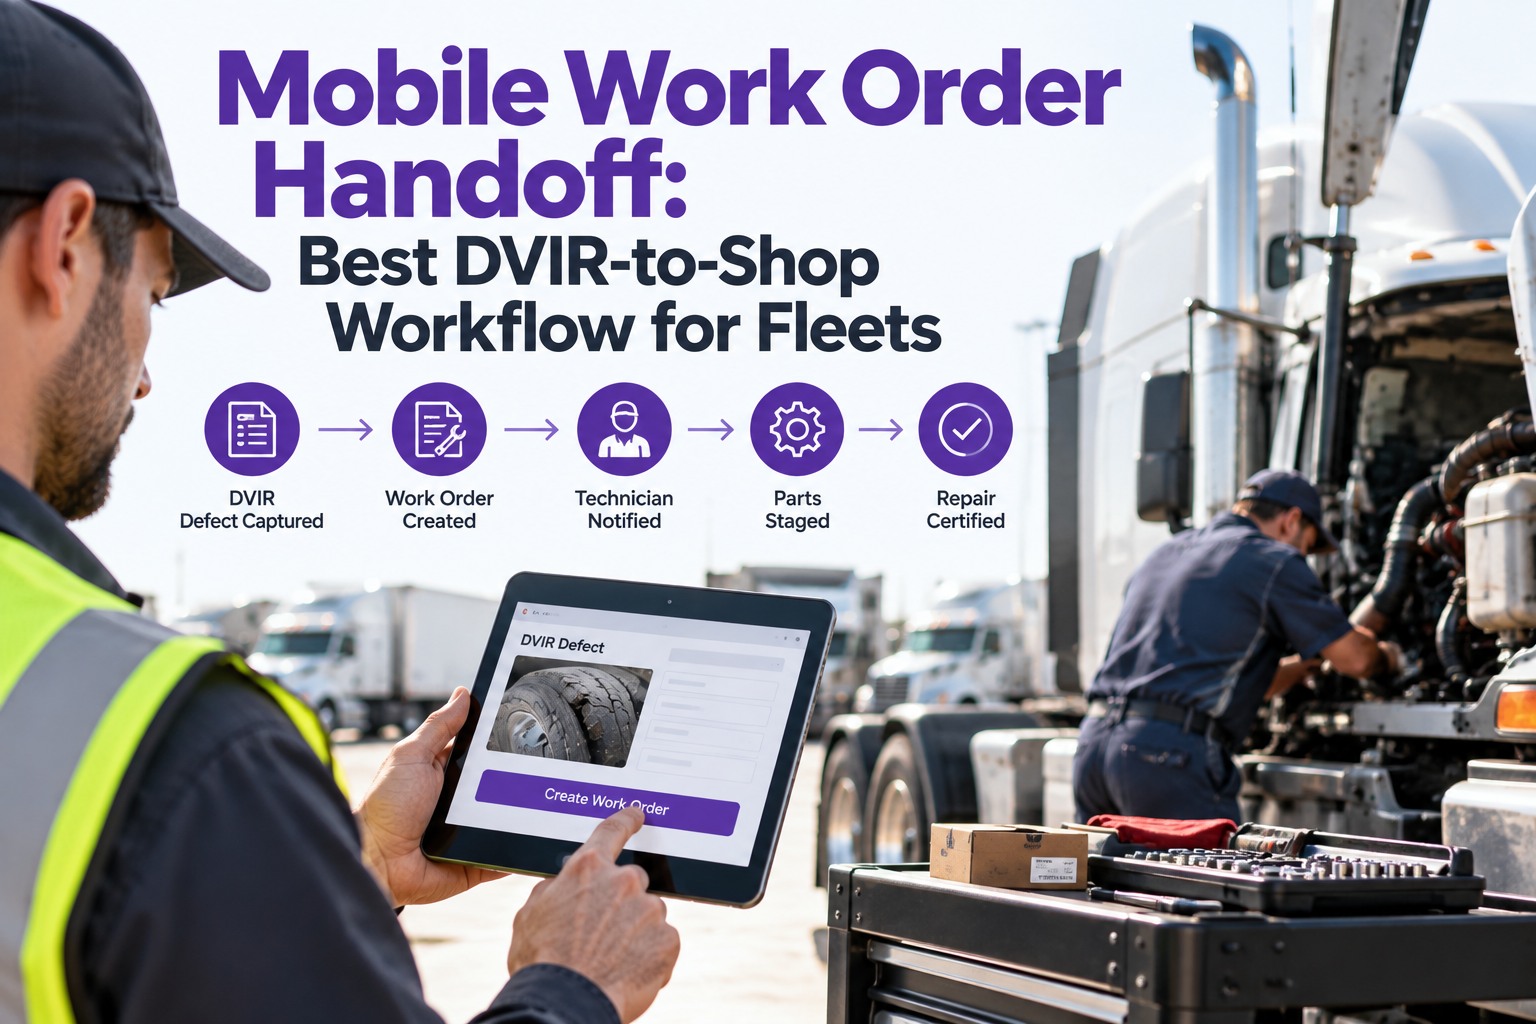
The place fleet anomaly programs quietly fall over isn't detection — it's the handoff. A P1 alert that arrives in a shop lead's SMS thread but never becomes a work order becomes exactly nothing. The value is only realized when the flagged anomaly becomes an assigned, dated, documented action in the maintenance system, closed by a signature. This is the whole point of putting detection on top of a CMMS instead of a standalone dashboard.

1
Signal captured Telematics gateway reads the J1939 stream. Every SPN, DM1, harsh event, fuel-rate reading lands in the platform every 15–60 seconds.

2
Compared to baseline Reading held against the truck's own rolling baseline plus static thresholds. Ordinary readings are logged silently. Deviations are surfaced.

3
Graded & routed Anomaly tagged P1 / P2 / P3 with a plain-English reason. P1 pages dispatch and shop lead. P2 opens a scheduled work order. P3 lands on the weekly digest.

4
Closed with a signature Work order acted on, mechanic signs off, unit released. Signal, action and outcome all attach to the truck's record for the next audit or DataQs review.

The KPIs That Prove Detection Is Working

A detection program should be measured on whether it turned into fewer breakdowns and less noise — not on how many alerts it fired. The four KPIs below are the ones a shop lead and a fleet manager can defend to a CFO after a quarter, and they're the ones we'd expect any mature detection platform to expose on its main dashboard.

01
Signal-to-noise ratio % of anomalies that turned into a real work order. Below 40% means the model is too loose; above 90% means it's too tight and missing drift.
02
Mean time from anomaly to work order Hours between signal and assigned WO. P1 events should measure in single-digit hours; P2 events within the week.
03
Anomaly-caught vs. roadside-caught Defects the platform flagged before a roadside inspection did. A rising ratio is the clearest evidence detection is working.
04
Repeat-anomaly rate per unit Same signal, same truck, within 30 days. Falling repeat rate means underlying causes are actually being fixed — not just closed out.

Frequently Asked Questions

Do I need to replace my existing telematics to run anomaly detection?
No. Anomaly detection is a layer on top of the J1939/GPS feed your existing gateway already produces. Most platforms integrate via API with Samsara, Geotab, Motive, Verizon Connect and the major OEM streams. Contact us to check compatibility with your provider.
How long before the baseline is trained enough to be useful?
Roughly 2–4 weeks of continuous data per truck. Enough runtime to cover a truck's normal route mix, load variation, and driver rotation. Static-threshold alerts work from day one; statistical baselines get sharper over the first month. Start free and let the baseline build while your threshold alerts run.
What's the biggest reason anomaly detection programs fail?
Alert fatigue. A too-tight configuration in week one floods the shop with false positives, they stop reading the queue, and the real signals get dismissed with the noise. Deploy wide, tighten over the first month. Contact us to see the safe rollout pattern.
Does detection replace pre-trip inspections?
No — it complements them. Detection catches slow drift and in-flight anomalies a driver won't see in a walk-around. Pre-trips catch what only a human eye can: bulging tires, missing triangles, a leak on the ground. Both feed the same work-order queue. Start free with detection and pre-trip on one platform.
Signal · Grade · Work Order · Closed

Turn the Telematics Firehose Into a Shortlist Worth Chasing

Anomaly detection on top of a maintenance platform, per-truck baselines, graded alerts, and every actionable signal routed straight into a work order. That's how the stream becomes uptime.
No credit card required · Free for up to 3 trucks · Works with your existing telematics feed