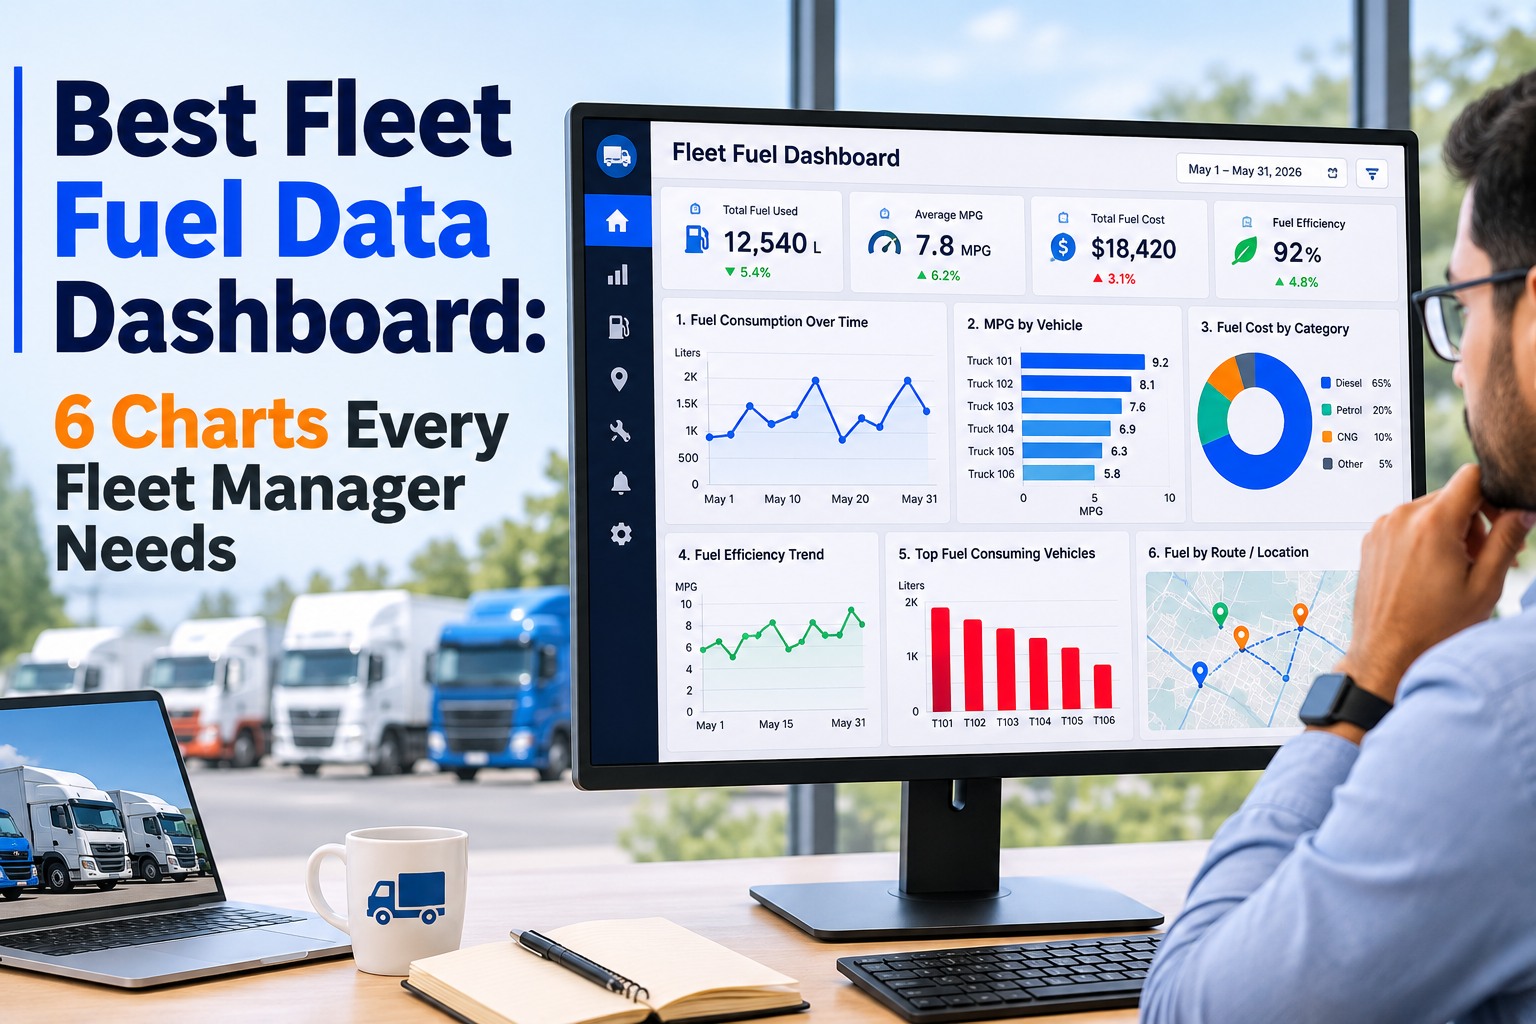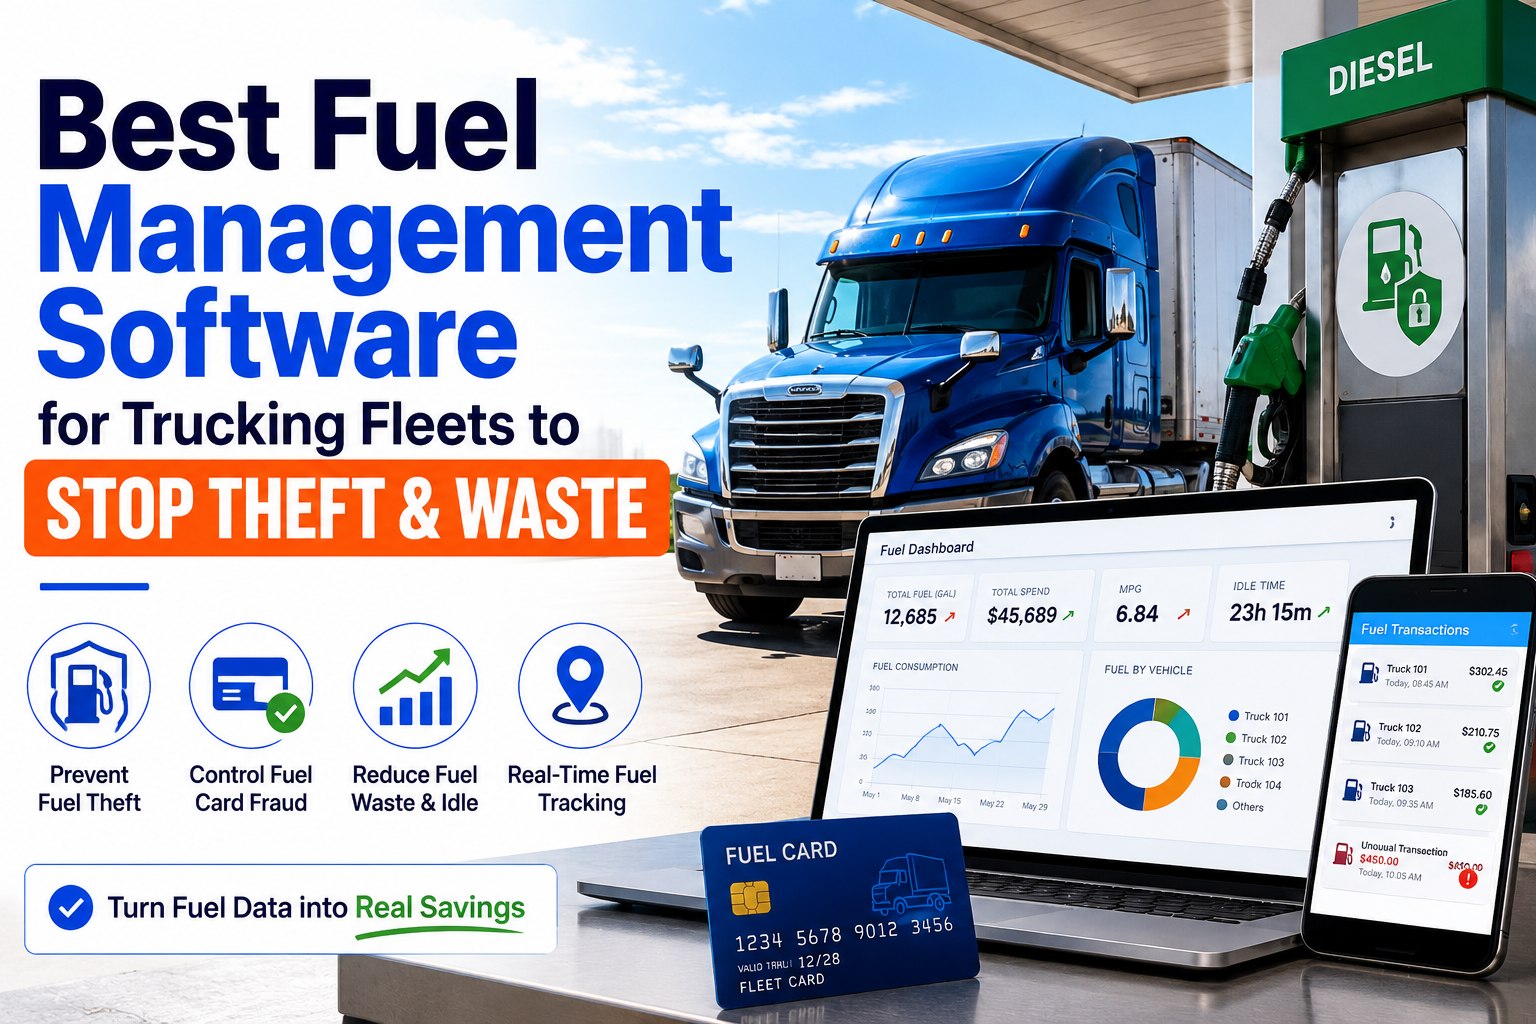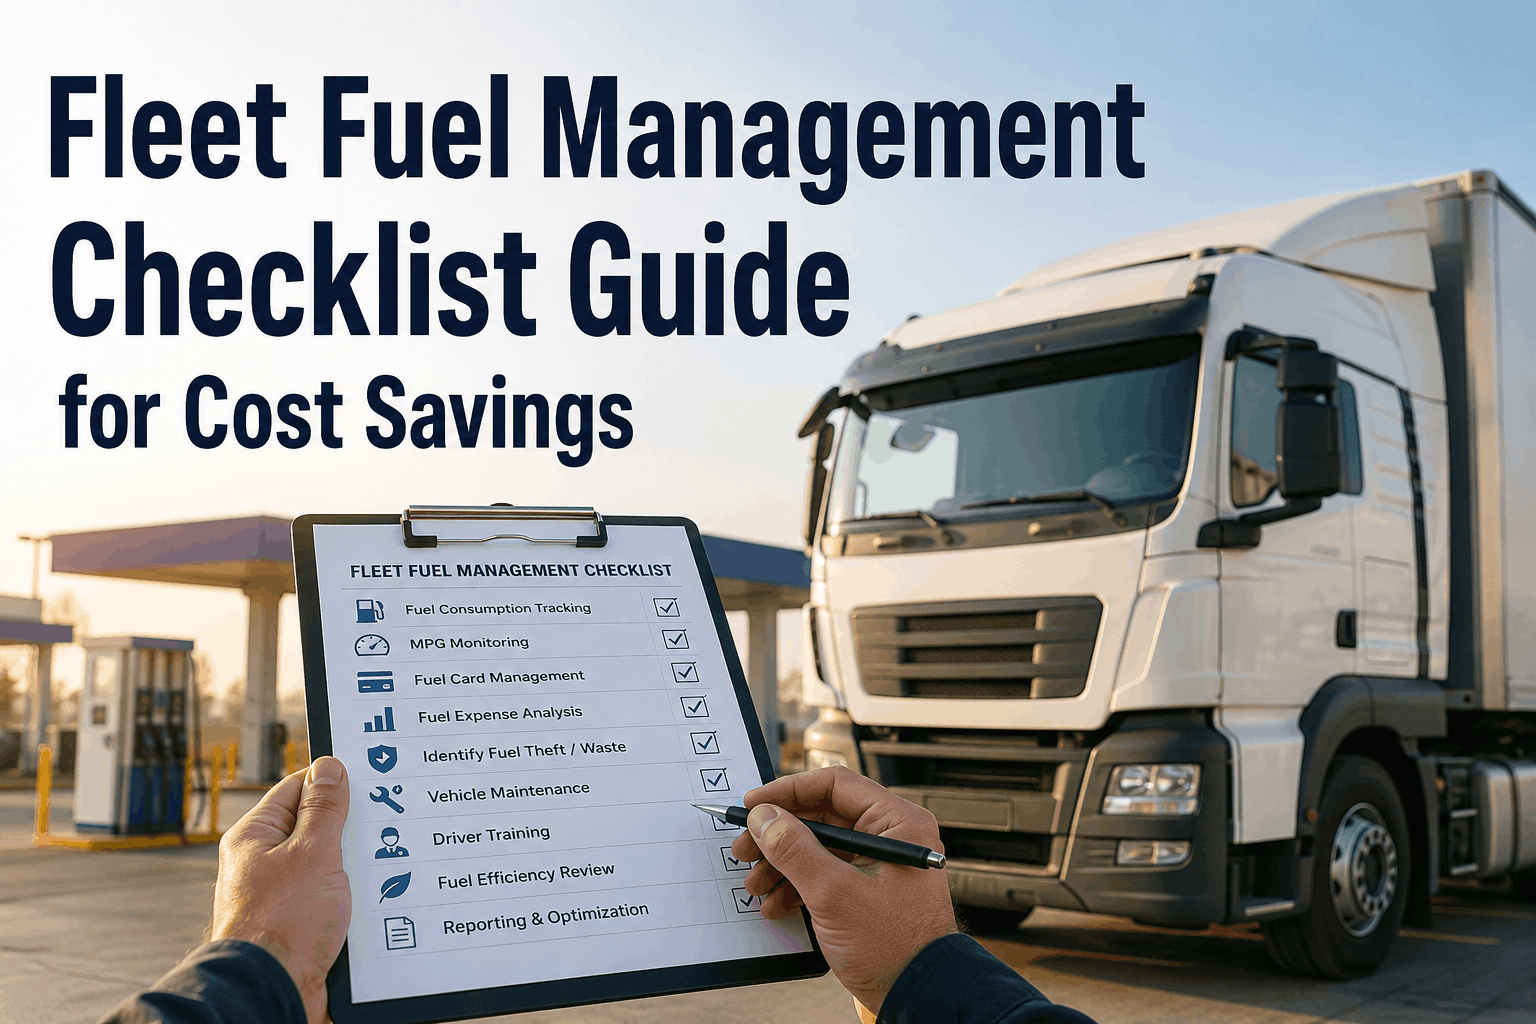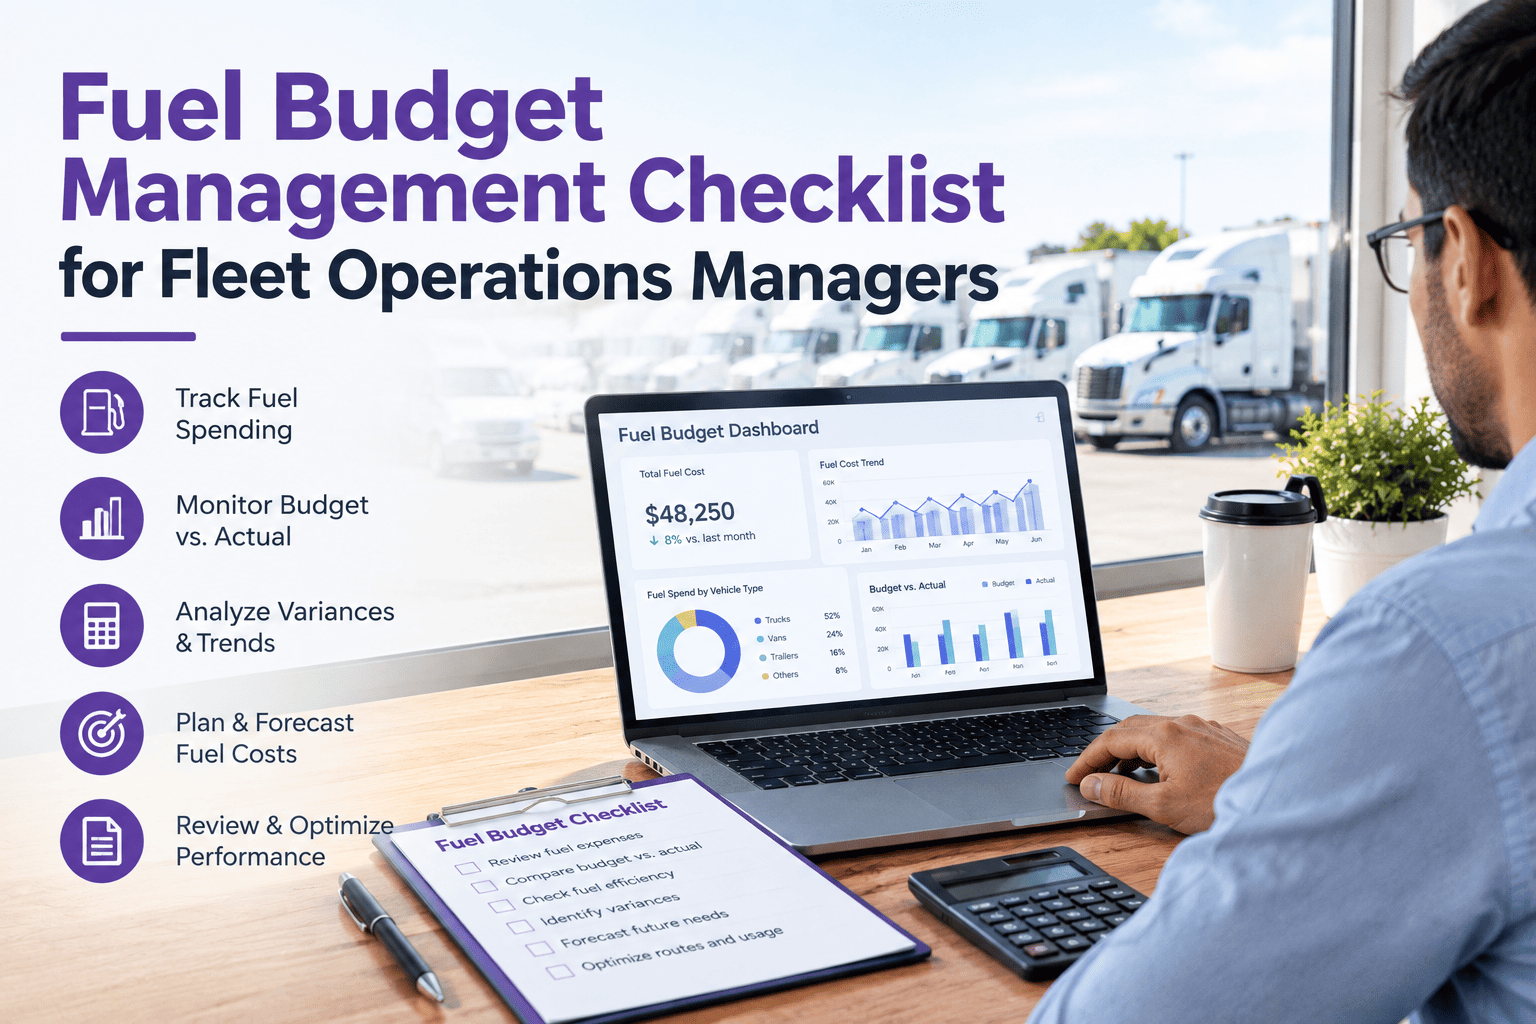
A fuel budget built once a year on a single assumed price per gallon is stale within a month. Diesel averaged $3.21 in 2024, swung to $3.83 in 2023, spiked to $4.99 in 2022, and 2026 outlooks show continuing volatility — the annual-forecast model doesn't survive that. What works instead is a monthly review discipline: close the month on actuals, break the variance into price, volume, and efficiency components, coach the drivers whose numbers moved, and rebuild the rolling forecast. Truck Inspection & Maintenance Management Software captures every gallon against the unit, ties it to odometer and engine hours from the ELD, and rolls the whole fleet into a monthly variance report the ops manager reviews in one sitting. Start free and run your first monthly fuel review in TIM.
A Fuel Budget Only Works If It Gets Reviewed Every Month — TIM Runs the Cadence
Fuel is 20–30% of total fleet operating cost — the second-largest line after driver pay. A budget without a monthly review discipline is a spreadsheet, not a control system. Truck Inspection & Maintenance Management Software runs the monthly close, breaks the variance into price, volume, and efficiency, flags the units and drivers behind the swing, and rebuilds the rolling 90-day forecast against your actuals.
The Monthly Fuel Close — 6 Steps TIM Sequences Every Month-End
The monthly close is the single most important discipline in fuel budget management. Below is the six-step workflow TIM runs on the first business day of every month — each step surfaces the data the ops manager needs to sign off on the prior month's fuel line and move to variance analysis.
The Variance Breakdown — Price vs Volume vs Efficiency
Total fuel variance is meaningless on its own — a $12,000 overrun could be entirely price-driven (nothing to fix), entirely volume-driven (a mileage question), or entirely efficiency-driven (a maintenance or driver question). TIM splits the variance into these three components so the ops manager knows what to work on.
(Actual $/gal − Budgeted $/gal) × Actual gallons. Nothing to fix operationally — this is a market signal. TIM tracks it so it can be isolated from the variances that are fixable.
(Actual miles − Budgeted miles) × Budgeted $/mi. Points at dispatch and route planning — extra miles from detours, redeliveries, or added lanes. Not a fuel problem; a routing problem.
Actual MPG worse than budgeted MPG. Points at maintenance (worn injectors, DPF issues, tire pressure), driver behavior (idle, hard acceleration), or fuel theft. The variance ops managers actually control.
The 4 Root Causes Behind Every Efficiency Variance
Efficiency variance is the one ops managers control — and it's almost always one of four root causes. TIM's investigation workflow walks the flagged unit through each in order until the cause lands.
Worn injectors, plugging DPF, low tire pressure, dragging brakes, air-intake restriction. TIM correlates the MPG drop with recent DTC codes on the unit and flags for shop review.
Excessive idle, hard acceleration, over-speed on grades, unnecessary A/C load. TIM ties MPG variance to the driver logged on the unit for the period and flags for coaching.
Odometer sensor error, fuel-level sender drift, ELD miscalibration. TIM cross-checks two data sources and flags when the drift exceeds tolerance.
Off-truck fueling, skimming, line leak, tank overflow. TIM's card-vs-consumption reconciliation catches the pattern that idle-driver metrics miss. Estimated 14% of fleet fuel payments lost to fraud in 2024.
Monthly Close · Variance Split · Driver Ranking · Forecast Rebuild — All in TIM
Truck Inspection & Maintenance Management Software runs the whole fuel-budget cadence: reconcile card vs consumption, split the variance three ways, rank units and drivers by MPG, open variance tickets on flagged units, and rebuild the rolling forecast. The monthly ops review moves from spreadsheet forensics to a signed-off report in one meeting.
The Rolling 90-Day Forecast — Why Annual Budgets Don't Survive 2026
Diesel has swung more than a dollar a gallon in a single quarter. A fleet running on a fixed annual assumption is budgeting for a market that no longer exists. TIM builds a rolling 90-day forecast every month using three inputs the ops manager can actually track.
Real consumption per unit, from ELD + fuel card reconciliation — not last year's assumption, not the OEM spec sheet.
Live EIA weekly average or contracted rack price, per region if the fleet spans multiple. Updated every close.
Committed loads, contracted lanes, seasonal factors. Dispatch validates, ops manager signs off.
Rebuilt every month. Never more than 30 days stale. Ops manager sees the forecast and the delta from the prior version.
Frequently Asked Questions
Turn Your Fuel Line From a Spreadsheet Into a Control System
TIM runs the 6-step monthly close, splits variance three ways, flags the units and drivers behind the swing, and rebuilds the rolling forecast. Fuel becomes a managed budget line instead of the biggest surprise on the P&L.