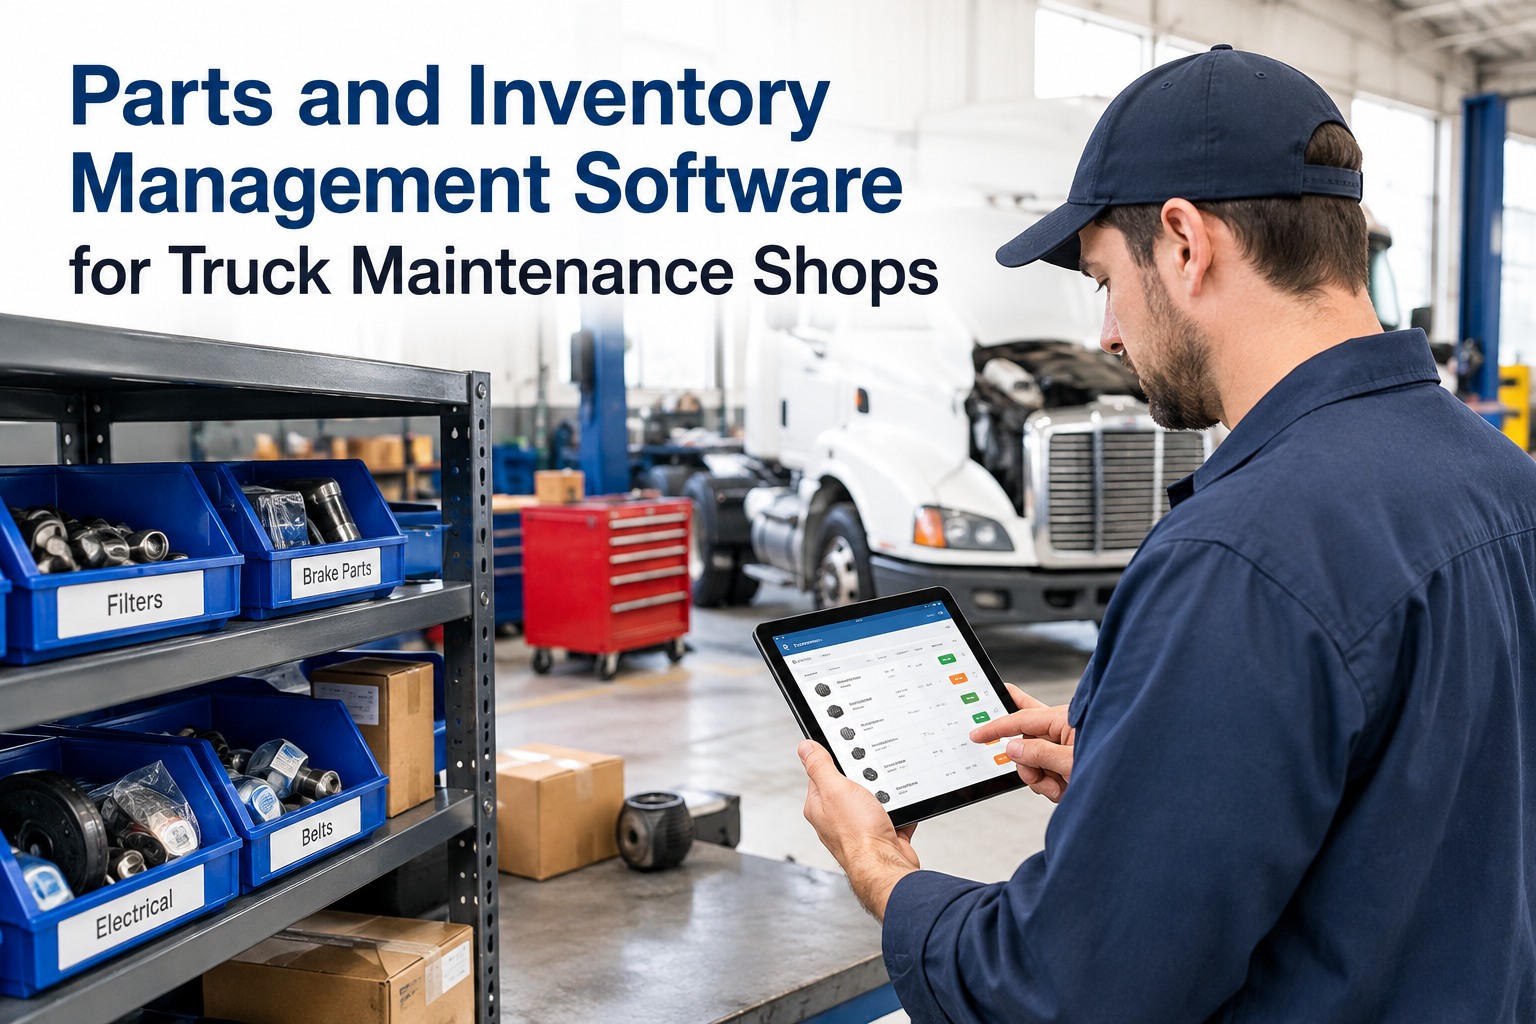
A $40 hydraulic hose fitting can idle a $300,000 truck for a week if it's not on the shelf. Q4 2025 saw parts costs jump 3.7% year-over-year according to the Decisiv/TMC benchmark report — making parts the largest driver of rising maintenance costs industrywide, outpacing labor increases for the second consecutive year. Yet 82% of fleets still manage parts inventory on spreadsheets or paper, and the typical fleet pays a 35-45% indirect-expense premium on top of direct parts and labor costs from poor stocking discipline. Emergency shipping runs 3-5× standard rates. Carrying costs eat 20-30% of inventory value annually. Cash sits in dead stock on shelves while critical spares stockout in the middle of a brake job.
The 2026 reality: fleets that implement structured parts inventory management — ABC classification, min/max stocking, reorder automation, PM-driven forecasting — reduce inventory carrying costs by 30-40% while achieving 95%+ parts availability and 91% fewer stockout events. The framework isn't complicated. It's the Pareto principle applied to parts: 20% of your SKUs drive 80% of your value, and your top 20 failure parts from the last 12 months will cover 80% of unplanned demand if you stock them right. Everything else is execution — connecting the inventory layer to your inspection workflow so defects trigger parts checks automatically, configuring min/max levels so reordering happens before stockout, and tracking vendor performance so emergency premiums shrink to zero.
This guide is the visual framework fleet managers need: the ABC classification matrix, the min/max stocking formula, the 6 inventory KPIs that prove the program works, and the 5-step implementation rollout. Start your free trial to deploy structured parts inventory management across your fleet — live in 10 minutes, free for up to 3 trucks.
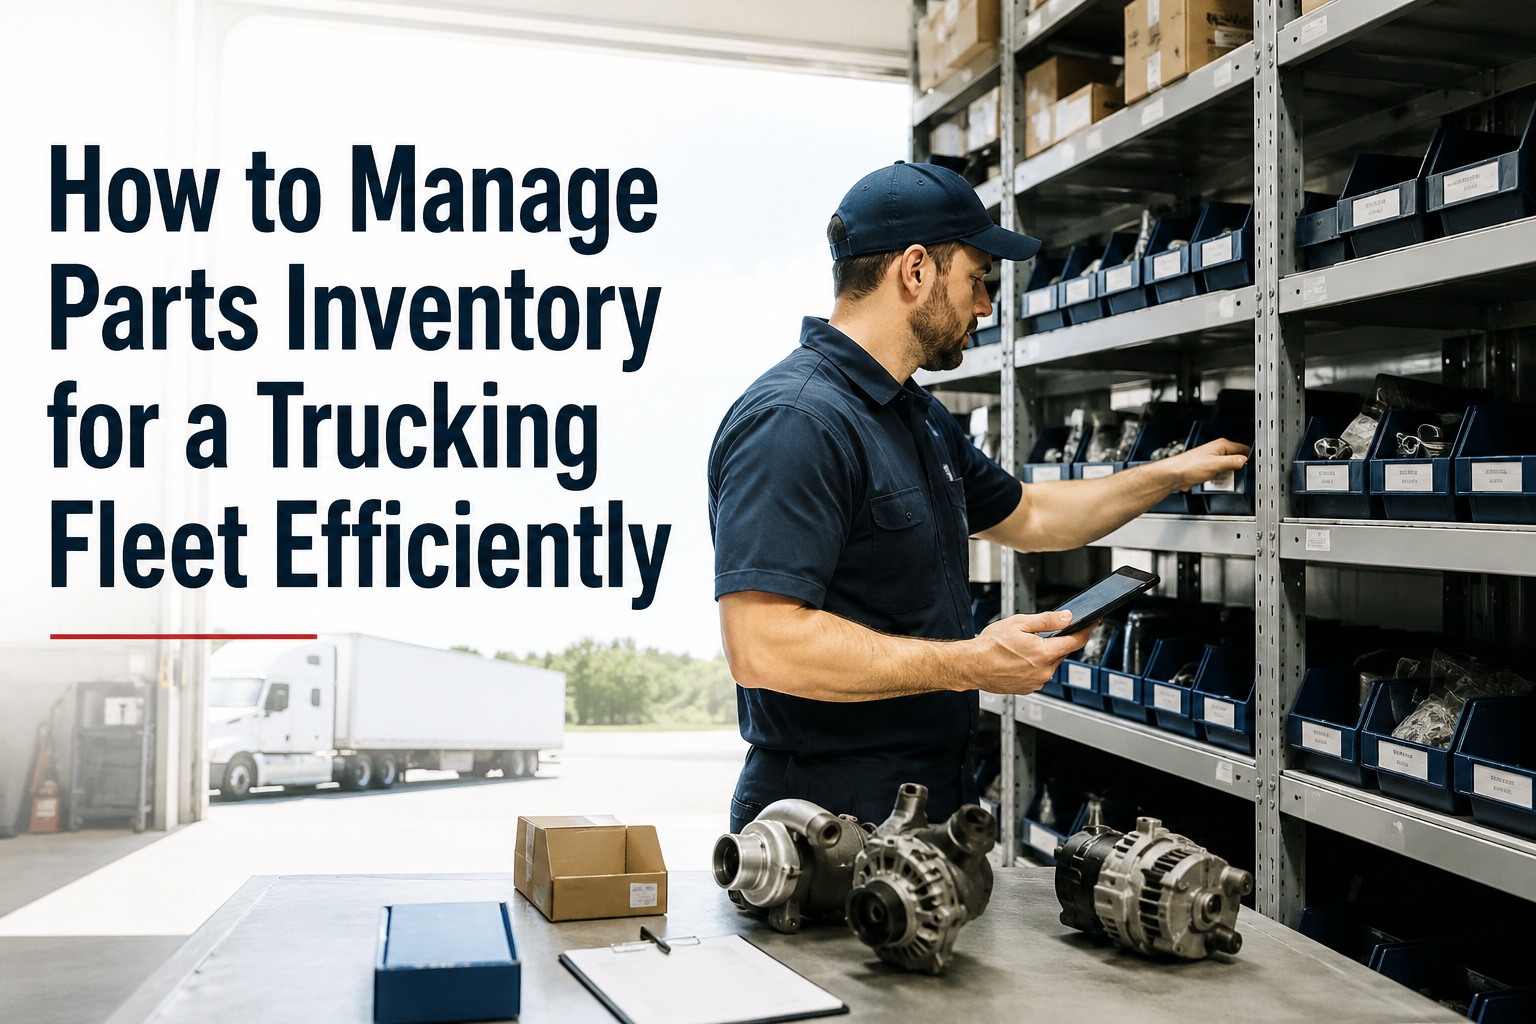
How to Manage Parts Inventory for a Trucking Fleet Efficiently
ABC classification, min/max stocking, reorder automation, vendor management. The complete 2026 playbook for trucking fleets — cut carrying costs 30-40%, achieve 95%+ parts availability, and eliminate stockout-driven downtime.
Quick Answer: How to Manage Fleet Parts Inventory
Effective fleet parts inventory management combines six integrated practices: (1) ABC classification segmenting parts by value and criticality (A items 10-20% / 70-80% value, B items 20-30% / 15-20% value, C items 50-70% / 5-10% value), (2) min/max stocking using the formula Minimum = (Average Daily Usage × Lead Time) + Safety Stock, (3) PM-driven demand forecasting tying parts consumption to upcoming service schedules, (4) automated reorder triggers when stock falls below minimum, (5) vendor management with pricing history and fill rate tracking, and (6) KPI monitoring covering inventory accuracy, fill rate, stockout frequency, carrying cost percentage, and days of inventory. Fleets implementing all six practices achieve 30-40% reduction in carrying costs, 95%+ parts availability, 91% fewer stockout events, and 15-25% reduction in emergency parts orders.
The ABC Classification Framework
Not all parts deserve the same stocking strategy. ABC analysis applies the Pareto principle to fleet parts inventory — focusing intensive management on the 10-20% of parts that drive 70-80% of value and operational impact. This is the foundation of professional parts management, and most fleets skip it entirely. Contact our sales team to run an ABC analysis on your current parts catalog.
The Min/Max Stocking Formula
Once parts are classified, every individual SKU needs a minimum stock level (the trigger for reorder) and a maximum (the cap that prevents over-investment). The formula is straightforward — modern CMMS platforms calculate it automatically from actual consumption data, but every parts manager should understand the underlying math.
The Hidden Cost of Stockouts
The repair invoice is just the start. The full cost of a single parts stockout compounds across multiple categories most fleets never separately track. Here's the real anatomy of one stockout event.
A fleet averaging 4 stockouts per truck per year pays $6,200-$22,200 per vehicle in stockout tax beyond the cost of the parts themselves. Sign up free to model the stockout tax for your specific fleet.
The 7 Parts Inventory Best Practices
These seven practices separate fleets that get parts inventory right from fleets that constantly firefight stockouts and overstock. Implement all seven and you're in the 95%+ parts availability tier. Contact our sales team to map your current operation against all seven practices.
The 6 Parts Inventory KPIs That Matter
You can't improve what you don't measure. Track these six KPIs monthly to verify your parts program delivers results — not just generates paperwork.
The 5-Step Implementation Rollout
Going from spreadsheet chaos to structured parts inventory management typically takes 60-90 days. Here's the rollout framework most fleets follow. Sign up free to deploy this rollout on your actual fleet.
Frequently Asked Questions
ABC analysis applies the Pareto principle to parts inventory, segmenting SKUs by value and operational criticality. A items represent 10-20% of SKUs but 70-80% of inventory value — critical spares like hydraulic pumps, transmission components, and engine assemblies that halt the truck when unavailable. B items are 20-30% of SKUs and 15-20% of value — PM consumables like filters, brake pads, and belts tied to scheduled service intervals. C items are 50-70% of SKUs but only 5-10% of value — commodity hardware like fuses, bulbs, and fasteners. Each tier gets a different stocking strategy: aggressive safety stock for A, min/max with PM lookahead for B, bulk-buy bin replenishment for C. Talk to our sales team for help running ABC on your catalog.
The general guideline: carry 2-4 weeks of A items (critical spares) plus safety stock, 1-2 weeks of B items (PM consumables) with PM-forecast lookahead, and bulk-buy C items (commodity hardware) on quarterly cycles. Total inventory value should run roughly 1-3% of annual fleet revenue for well-managed operations. Days of inventory by ABC class: A-items 20-40 days, B-items 30-60 days, C-items 60-90 days. Beyond those targets, you're tying up working capital in slow-moving stock. Below them, you're stockout-prone. Sign up free to size your inventory targets automatically.
The formula: Minimum = (Average Daily Usage × Lead Time in Days) + Safety Stock. Maximum = Minimum + Economic Order Quantity. Example: if you use 2 oil filters per week (0.4/day) and vendor lead time is 5 business days, minimum = (0.4 × 5) + 2 safety = 4 filters. Maximum prevents over-ordering — Min + EOQ might be 12 filters. The system triggers a reorder when on-hand drops to the minimum. Review quarterly because fleet size, vehicle mix, and usage patterns shift over time. Modern CMMS platforms calculate these automatically from actual consumption data — no manual spreadsheets required.
A moderate stockout event averages $1,548-$5,560+ per occurrence when fully accounted: truck downtime at $448-$760/day idle, emergency shipping at 3-5× standard rates ($300-$1,500), overtime labor for rushed repair ($400-$1,200), potential rental truck to cover the route ($200-$600/day), missed delivery penalties ($200-$1,500), and the unmeasured scheduling cascade. A fleet averaging 4 stockouts per truck annually pays $6,200-$22,200 per vehicle in stockout tax beyond the cost of the parts themselves. Contact our sales team to model this for your fleet.
Industry benchmarks: 30-40% reduction in inventory carrying costs (which run 20-30% of inventory value annually), 95%+ parts availability vs the typical 80-85%, 91% fewer stockout events, and 15-25% reduction in emergency parts orders. For a fleet carrying $100K in parts inventory, that's $6K-$12K saved annually on carrying alone — before counting eliminated emergency shipping, reduced downtime, and labor productivity gains. Payback periods typically run 3-6 months for fleets with structured PM programs. Smaller fleets see proportional ROI starting with strong ABC classification plus min/max automation as the foundation.
The connection happens at three points: (1) DVIR defect flagged → parts check fires → reservation or PO if stockout; (2) PM schedule generates parts demand 7-14 days ahead based on upcoming services; (3) Work order completion auto-deducts parts used from inventory. Modern fleet platforms unify inspections, PM scheduling, work orders, and parts inventory on one system of record — eliminating the data drift that breaks "best of breed" stacks. The chain from "driver finds problem" to "part is ordered" runs in seconds when integrated properly. Start your free trial to test the integrated workflow.
Deploy ABC Classification, Min/Max Automation & Auto-Reorder
500+ fleets unify parts inventory with inspections, PM scheduling, and work orders on one platform. Cut carrying costs 30-40%. Hit 95%+ parts availability. Eliminate stockout-driven downtime. Vendor performance tracked. Multi-location visibility. KPI dashboards. The 2026 standard for trucking fleet parts management.