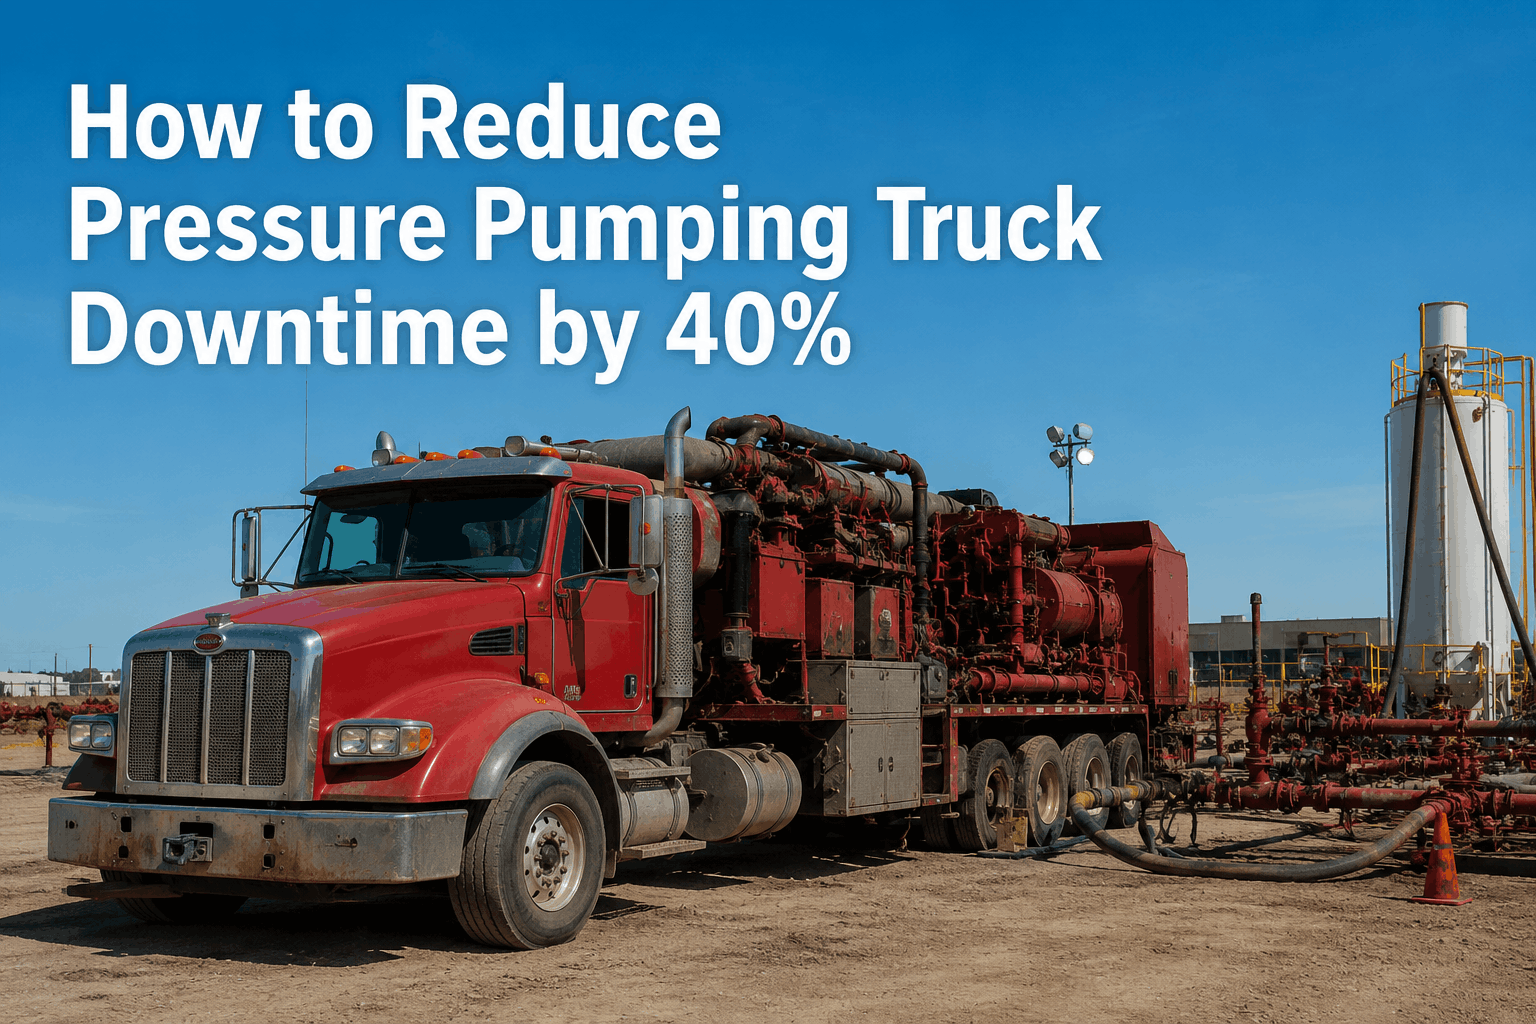
Pressure pumping truck downtime is the most expensive equipment failure mode in the commercial trucking world — and it isn't close. A pressure pumping unit (often called a frac truck) is a $1.5M-$3M+ self-contained pumping system: a 2,500-3,000 hp diesel engine driving a heavy-duty transmission and a plunger pump capable of delivering proppant slurry at 15,000+ PSI to fracture hydrocarbon-bearing formations thousands of feet underground. Operations run 24/7 at active well sites. Daily revenue per fully utilized pump runs $50,000-$100,000+ depending on contract terms and market conditions. A frac spread typically deploys 10-15 pumping units simultaneously, all timed against precise pumping schedules. A single unit failure during an active pumping stage can stop the entire spread, cascading $5,000-$10,000+ per hour in direct downtime cost plus indirect costs that compound rapidly: contract penalty clauses, missed pumping stage targets, idle crew labor, and customer relationship damage on a market where shippers track operator uptime metrics quarterly.
The 40% downtime reduction documented across pressure pumping deployments isn't theoretical — it's field-validated across thousands of pumping unit operations through six specific mechanisms tailored to the unique severe-duty profile of frac equipment. Engine-hour-based PM scheduling replaces the mileage-only thinking that fails completely on equipment that barely moves on job sites. Oil analysis and vibration monitoring catch power end and fluid end problems before catastrophic failure — the two highest-cost failure modes on any pressure pumping unit. Parts staging strategy keeps critical spares (valves, packing, plungers, seats) within 2-hour transport of active spreads instead of distant central warehouses. Field maintenance acceleration brings repair capability to the asset rather than transporting the asset to repair, eliminating 24-48 hours of transport time per failure event. Operator training paired with telematics data reduces the abuse-driven failures that drive 20-25% of unscheduled downtime. The combined effect, validated across thousands of pumping unit operations: 35-45% reduction in unscheduled downtime, $3M-$8M+ annual savings per fleet, and dramatic improvement in customer uptime metrics that drive contract renewal.
This guide is the complete pressure pumping truck downtime reduction framework for 2026: the cost drivers that make pressure pumping downtime so catastrophic, the 6 downtime reduction levers tailored to oilfield severe-duty operations, the per-truck downtime math, and the 90-day implementation plan. Start your free trial of our truck inspection and maintenance software to deploy oilfield-specific maintenance workflow across your fleet — live in 10 minutes, free for up to 3 trucks.
How to Reduce Pressure Pumping Truck Downtime by 40%
Why Pressure Pumping Downtime Is Catastrophic
The economics of pressure pumping downtime aren't comparable to any other trucking application. Understanding the cost drivers explains why structured uptime programs are the highest-ROI investment in oilfield fleet management.
$5,000-$10,000+ Per Hour Direct Downtime
Spread-Wide Cascade Effects
Contract Uptime Penalties
Multi-Million Dollar Asset Idle
High-Failure-Cost Component Profile
Customer Uptime Score Impact
The 6 Downtime Reduction Levers
Each lever addresses a specific pressure pumping cost driver. Together they produce the documented 40% downtime reduction. Contact our sales team to evaluate which levers apply most to your operations.
Engine-Hour-Based PM Scheduling
SCHEDULING · 8-12% UPTIME GAINOil & Vibration Analysis
PREDICTIVE · 10-15% UPTIME GAINPower End / Fluid End Cycling
DEDICATED · 8-10% UPTIME GAINParts Staging Strategy
LOGISTICS · 6-8% UPTIME GAINField Maintenance Acceleration
PROCESS · 5-7% UPTIME GAINOperator Training + Telematics
BEHAVIOR · 6-8% UPTIME GAINThe Per-Truck Downtime Math
What does a 40% downtime reduction actually save in dollar terms? The per-truck math shows why oilfield fleet investments in uptime programs have unmatched ROI in commercial trucking.
| Metric | Baseline | Optimized (40% reduction) | Per-Truck $ Recovered |
|---|---|---|---|
| Annual unscheduled downtime hours | 500-700 hrs | 300-420 hrs | — |
| Direct hourly downtime cost | $5,000-$10,000 | $5,000-$10,000 | — |
| Direct downtime exposure (annual) | $2.5M-$7M | $1.5M-$4.2M | $1M-$2.8M |
| Power end overhauls avoided | 1.5/year baseline | 0.4/year optimized | $100K-$165K |
| Fluid end replacements avoided | 2/year baseline | 0.6/year optimized | $40K-$110K |
| Engine major service shifts | Reactive timing | Scheduled timing | $15K-$40K |
| Total per-truck annual savings | — | — | $1.15M-$3.1M |
Per-truck annual savings of $1.15M-$3.1M apply to fleets transitioning from reactive maintenance to fully optimized oilfield-specific workflow. Most pressure pumping fleets currently sit somewhere between, with savings typically running $400K-$1.2M per truck annually. Apply across a 50-100 unit fleet and total annual savings reach $20M-$100M+. The economics dwarf any other downtime reduction opportunity in commercial trucking — making structured oilfield uptime programs the single highest-ROI investment available in fleet operations.
The 90-Day Implementation Plan
Most pressure pumping fleets can implement the 6-lever framework within 90 days. Speed matters in oilfield: the longer you wait, the more downtime hours compound.
Baseline & Engine-Hour PM Switch
Oil Analysis Program Active
Parts Staging Strategy Deployed
Field Maintenance & Operator Scorecards
Uptime Metrics & Optimization
Frequently Asked Questions
Why are pressure pumping trucks so expensive when they break down?
Three factors compound the cost. First, the equipment itself is high-value: a pressure pumping unit costs $1.5M-$3M+ depending on configuration. Second, the operating context multiplies downtime cost — pumping units operate as part of a 10-15 unit frac spread executing precisely scheduled pumping stages, and single-unit failure can stop the entire spread until repair or replacement. Direct hourly downtime runs $5,000-$10,000+ for the disabled unit, plus cascading cost across the broader operation. Third, failure modes are uniquely expensive: power end overhaul $50K-$150K, fluid end replacement $30K-$80K, engine major service $40K-$80K, discharge iron failure during pumping can mean catastrophic shrapnel damage to the entire unit. Add contract uptime penalty clauses (commonly 1.5-2× lost revenue) and customer relationship damage on quarterly performance scorecards, and pressure pumping downtime becomes the most economically consequential equipment failure in commercial trucking. Start your free trial for oilfield uptime programs.
Why doesn't standard fleet PM work for pressure pumping?
Standard fleet PM is built around mileage-based intervals assuming a truck that drives. Pressure pumping units barely move — they're transported to job sites, then operate stationary for days or weeks pumping. A pressure pumping unit might log 20,000 miles per year while accumulating 4,000-6,000 engine hours during pumping operations. Mileage-only PM dramatically under-services these units; engine-hour-primary scheduling is essential. Beyond scheduling, pressure pumping has unique high-value components that don't exist in standard PM templates: power ends and fluid ends with specific wear modes, high-pressure discharge iron systems, sand-handling equipment with abrasive wear patterns, and pump fluid systems with specialized hydraulics. Generic fleet maintenance software can't capture any of this. The platforms that win in pressure pumping operations are built with engine-hour primary scheduling, dedicated power end / fluid end workflow, oil analysis integration, and operator behavior tracking for the abuse-prone failure modes.
How much can oil analysis actually save on pressure pumping equipment?
Significantly more than fleets typically expect. Quarterly oil analysis on engines, transmissions, and pumps identifies developing problems 200-500 operating hours before they manifest as failures — typically while repair costs are still in the $5,000-$15,000 range rather than the $50,000-$150,000 range of catastrophic failure. Specific catches: bearing wear metal trending up indicates main bearing failure 300-500 hours out, allowing scheduled repair; viscosity breakdown signals oil oxidation that destroys engine internals if not addressed; contamination patterns reveal external infiltration (water, dirt, fuel dilution) that destroy components rapidly. Per-truck oil analysis program cost typically runs $1,500-$3,000 annually. Industry data shows 60-70% of pressure pumping engine failures and 50-60% of pump failures are catchable through quarterly oil analysis — meaning each program typically prevents $200K-$800K in failure cost annually per truck. The ROI is among the highest in oilfield fleet management. Contact our sales team for oil analysis integration.
What's the difference between power end and fluid end maintenance?
The pressure pumping unit's pump is mechanically divided into two sections. The power end contains the crankshaft, connecting rods, crossheads, and bearings that convert engine rotational energy into reciprocating linear motion. Power end maintenance focuses on bearing health, lubrication, crosshead alignment, and structural integrity. Failure mode: catastrophic bearing failure or crankshaft damage costing $50K-$150K per repair event. The fluid end contains the plungers, valves, valve seats, packing, and high-pressure manifolds that convert reciprocating motion into pressurized fluid output at 15,000+ PSI. Fluid end maintenance focuses on valve seat condition, packing wear, plunger surface integrity, and discharge port erosion. Failure mode: progressive performance loss (output reduction, leaks) escalating to catastrophic packing or valve failure costing $30K-$80K per fluid end replacement. Both systems require dedicated inspection cycles — generic pump PM templates miss the specific wear modes that drive cost. Best practice: structured inspection on every PM with documented condition tracking over time. Sign up free to deploy power end / fluid end workflow.
How does parts staging actually reduce downtime?
Parts availability is one of the largest variables in pressure pumping uptime. When a unit fails on a remote job site and the required part is at a central warehouse 6-8 hours away, the repair clock starts at part-arrival time, not failure-discovery time. A 12-hour repair compounds to 20-24 hours just from logistics. Parts staging strategy keeps critical components within 2-hour transport of active spreads at regional hub locations near major operating basins (Permian, Eagle Ford, Bakken, Marcellus, Haynesville, DJ, etc.). Critical components to stage: fluid end valves and seats (highest-frequency failure), packing kits, plungers, common bearings (engine, transmission, pump), discharge gaskets, electrical relays, common sensors. Single avoided 12-hour parts run typically saves $60K-$120K in downtime cost — easily justifying the staged inventory carrying cost. Most fleets transitioning to staging strategy see 6-8% additional uptime improvement on top of the other 5 levers.
What's the realistic timeline for pressure pumping uptime improvement?
Most pressure pumping fleets see measurable uptime improvement within 30-60 days of deploying the 6-lever framework, with full 40% downtime reduction visible by month 4-6. The fastest improvements come from engine-hour-based scheduling (immediate as previously under-serviced units catch up on PM) and parts staging (immediate impact on repair logistics). Oil analysis takes 60-90 days to begin producing early-catch saves. Operator coaching takes 30-60 days to change behavior measurably. Field maintenance capability requires 60-90 days to staff and equip. The compound effect builds: monthly uptime metrics typically improve 5-10% in month 1, 15-25% by month 3, and 35-45% by month 6. Customer uptime scorecards take a quarter to reflect improvement, but quarterly contract review meetings start showing positive trends within the first reporting period. Speed matters because every day of delay compounds downtime — a 60-day implementation delay on a 100-unit fleet typically costs $15M-$40M in continued reactive downtime. Talk to our sales team to accelerate deployment.