Your fleet average is a lie of omission. A blended cost per mile of $2.05 hides the lane bleeding $2.60 and the driver crashing twice as often as the rest. With trucking's marginal cost at a record $1.78 per mile excluding fuel and average operating margins below 2%, the money is no longer in working the whole fleet harder — it is in finding the handful of outliers dragging everyone down. Yet fewer than one in three operators can prove where their fleet actually stands. Benchmarking by lane and by driver turns one misleading average into a map of exactly what to fix first. This guide shows the metrics that matter, how to segment them, and how to act on the outliers. Start benchmarking your fleet free.
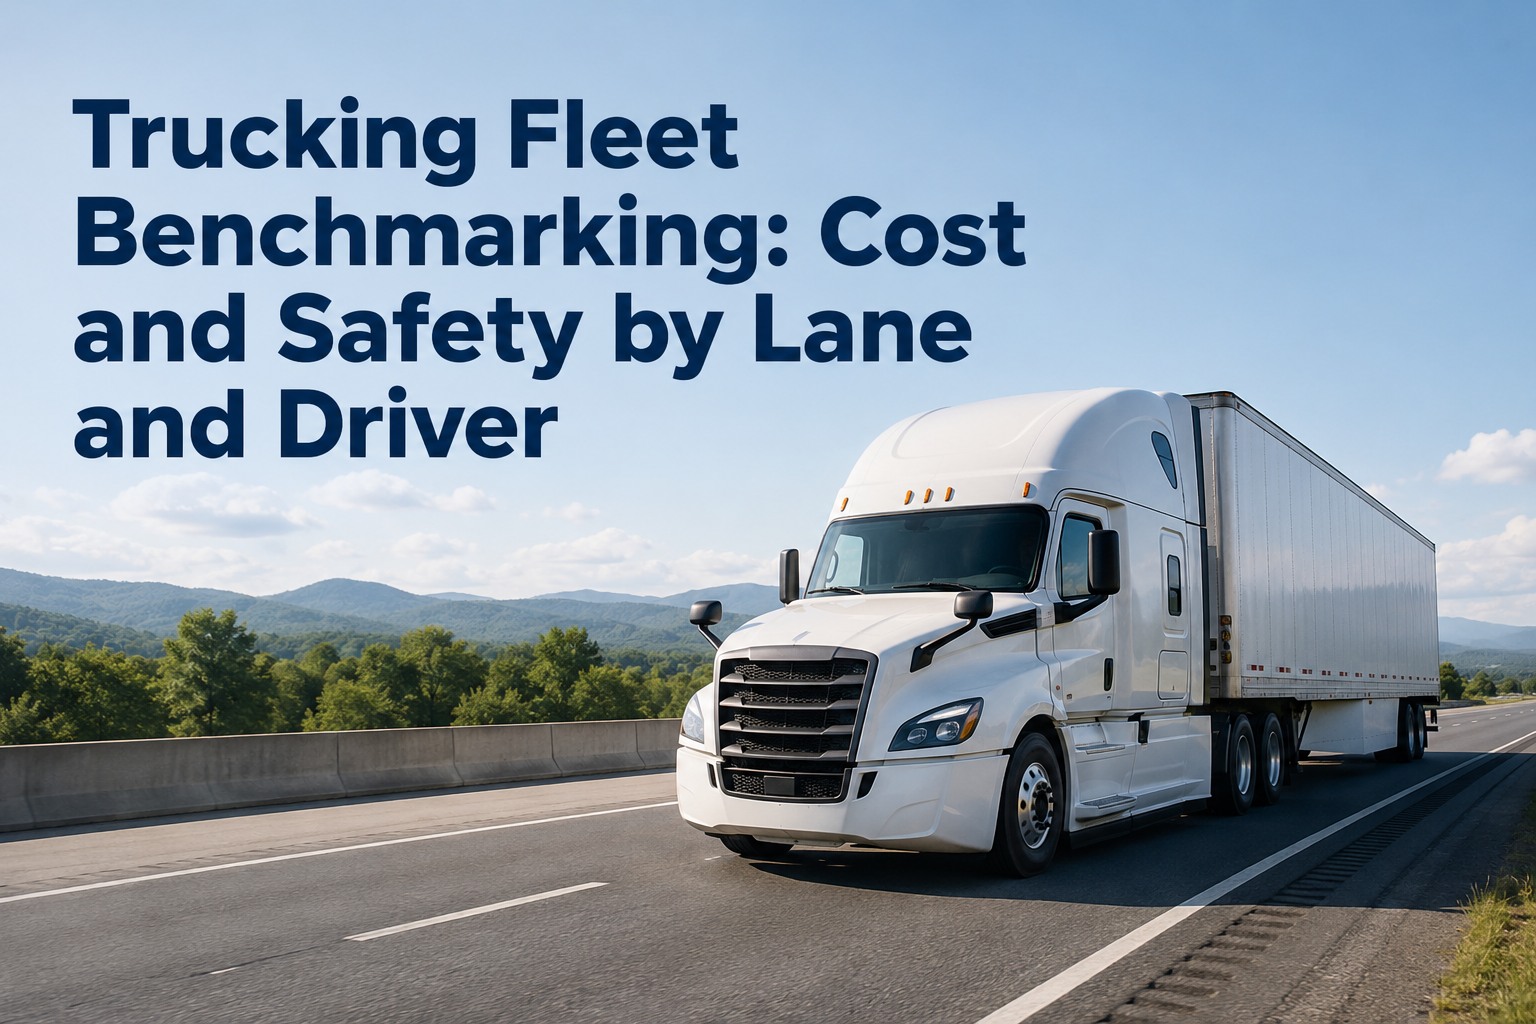
Trucking Fleet Benchmarking: Cost and Safety by Lane and Driver
Know which lanes and drivers cost and crash the most. Benchmark cost per mile and safety side by side — so you fix the outliers instead of guessing at the average.
Why the Fleet Average Hides Your Real Problem
An average is a single number standing in for a wide spread. When you manage to it, you reward your worst performers with cover and punish your best with neglect. The gap between top-quartile and bottom-quartile fleets is dramatic across every metric — and that same spread lives inside your own operation, lane to lane and driver to driver.
The Four Metrics Worth Benchmarking
Cost and safety are the two questions that decide whether a lane or driver is worth keeping. Break each into a measurable metric, and the outliers reveal themselves. These four are where the signal lives.
The single most comprehensive number — fuel, maintenance, insurance, depreciation. Track it per lane and per driver, not just fleet-wide.
Two lanes at the same CPM can hide very different problems. The mix tells you whether to chase fuel, maintenance, or routing.
Roadside violations, preventable crashes, and harsh-driving events per 100K miles. The clearest signal of driver and lane risk.
Miles run versus miles available. An underused truck on a cheap lane can still be your worst asset on a cost-per-revenue basis.
See Cost and Safety on the Same Screen
Truck Inspection & Maintenance benchmarks CPM and safety events by lane and driver from your existing records — so the outliers surface without a spreadsheet marathon.
Benchmark the Right Way: Segment First
The fastest way to draw the wrong conclusion is to compare things that aren't alike. A city delivery lane and a highway haul live at completely different CPM targets. Good benchmarking groups like with like before it compares anything.
What a Driver Scorecard Reveals
The same lane, two drivers, two very different results. A driver scorecard puts cost and safety side by side so you can see who's quietly excellent and who needs coaching — before a CSA score or a repair bill makes the point for you.
| Driver | CPM | Safety events / 100K mi | Status |
|---|---|---|---|
| Driver 1 | $1.74 | 0.4 | Top performer |
| Driver 2 | $2.02 | 1.1 | On target |
| Driver 3 | $2.48 | 2.6 | Coach now |
Turning a Benchmark Into a Dollar
Benchmarking only matters if it changes a decision. Each gap you find maps to a concrete action — and a concrete saving. Here's how the outliers translate into money.
Frequently Asked Questions
Cost per mile is the most comprehensive single number because it rolls fuel, maintenance, insurance, and depreciation into one figure. The 2026 industry average sits around $2.26 per mile while top performers run below $1.56. But CPM is most powerful when broken down by lane and driver rather than viewed as a fleet-wide average.
A fleet average blends your best and worst performers into one misleading number. Segmenting by lane and driver exposes the spread — the lane costing far more than the rest, the driver with triple the safety events. Those outliers are where the real savings sit, and they're invisible at the fleet level.
Segment first. Group similar lanes or trucks into peer groups by route type, distance, climate, and freight, then compare within each group. A city delivery lane and a long highway haul have completely different cost targets, so comparing them directly produces misleading gap analysis.
Leading fleets review key metrics weekly for operational adjustments, run deeper benchmark comparisons quarterly, and do an annual deep-dive for budgeting and strategy. The value comes from a consistent cadence rather than sporadic checks — a steady rise in a lane's CPM is only visible if you're watching regularly.
No. Most of the data already exists in your maintenance records, fuel logs, and telematics. Truck Inspection & Maintenance pulls from your existing records to calculate cost and safety metrics by lane and driver automatically, so you can benchmark without adding equipment or a dedicated analyst.
Find the Outliers Dragging Your Fleet Down
Truck Inspection & Maintenance benchmarks cost per mile and safety by lane and driver from records you already keep — surfacing the lanes that bleed and the drivers that crash, so you fix the few things that move the whole fleet.