Every truck has a moment when it's worth the most it will ever be worth to keep — and most fleets blow right past it. Run a unit too long and maintenance climbs, downtime stacks up, and resale value evaporates. Replace too early and you torch capital on a truck that still had cheap, productive miles left. The gap between those two mistakes is real money: research shows replacing at the optimal point versus 30,000 miles late can save roughly $37,000 per truck — about $740,000 across a 20-unit fleet. The catch is that 40–60% of an aging truck's true cost never shows up on a standard P&L. This guide shows where the replacement sweet spot sits, the signals that you're past it, and how to find it for every unit. Find your replacement sweet spot free.
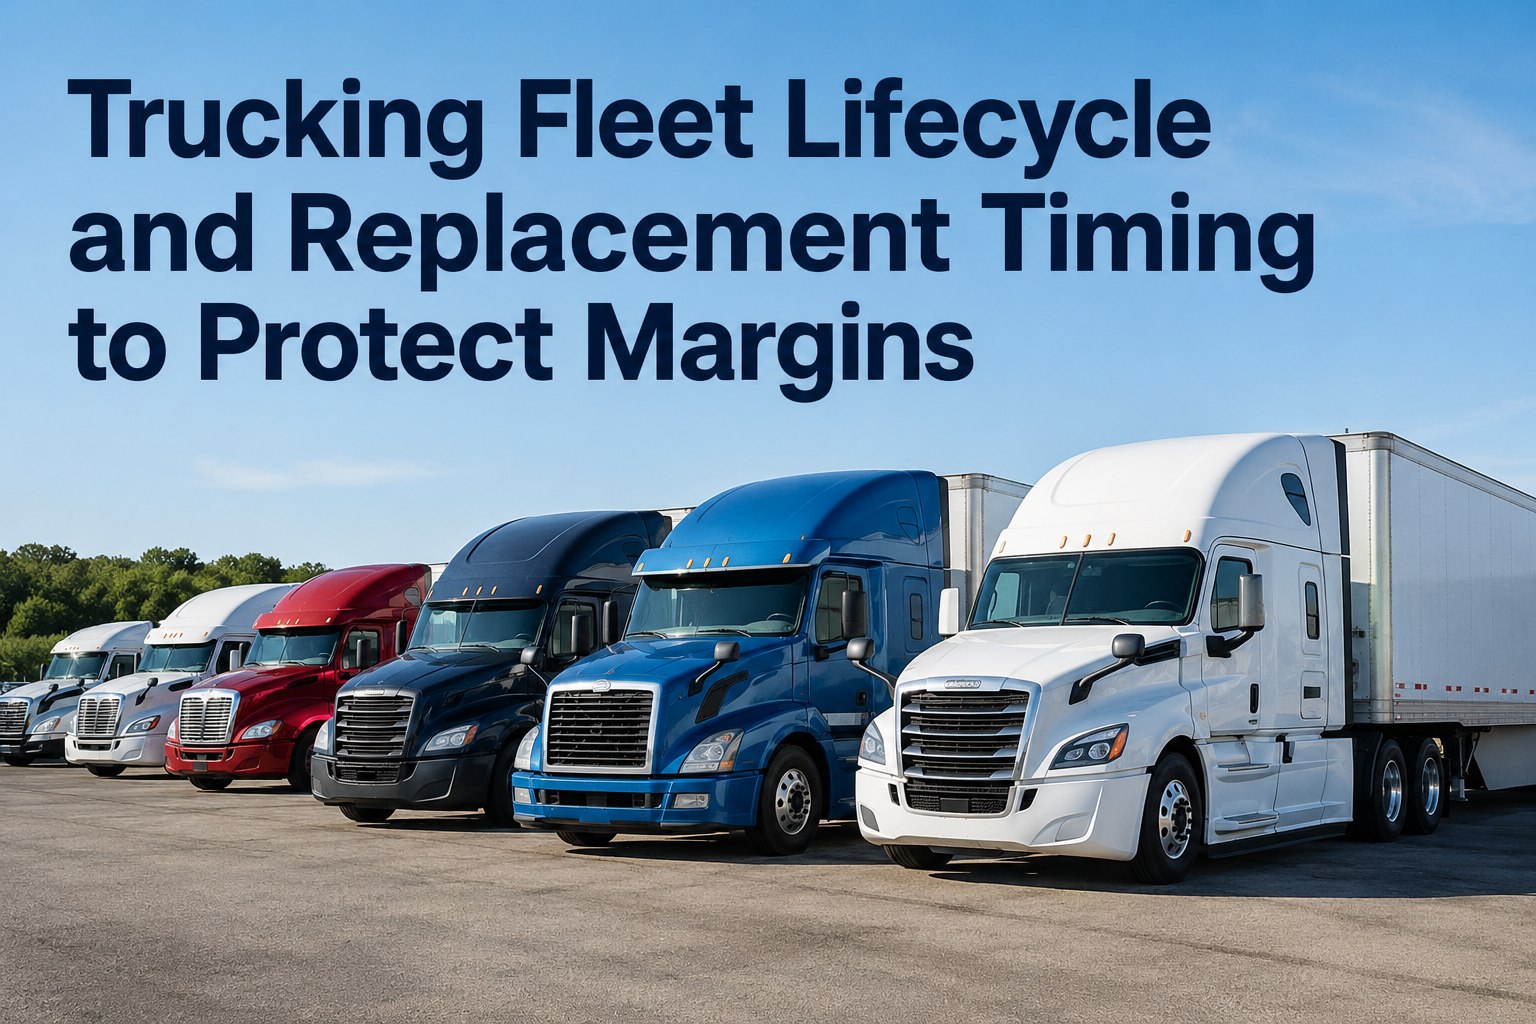
Trucking Fleet Lifecycle and Replacement Timing to Protect Margins
Run a truck too long and downtime soars; replace too early and you waste capital. Lifecycle data finds the optimal replacement point for every unit — so you cycle on math, not on gut feel.
The Two Ways to Get It Wrong
Replacement timing is a balancing act between two opposite mistakes, and both quietly cost margin. One drains capital; the other drains uptime. The art is landing in the narrow window between them.
You trade in a truck that still had cheap, reliable miles left, paying a new-vehicle premium and fresh depreciation you didn't need to absorb yet.
Maintenance and downtime climb past the cost of a new payment, resale value collapses, and a single bad year can cost more than all prior years combined.
The Sweet Spot: Where the Curve Bottoms
Total cost per mile follows a U-shape over a truck's life. Early on, depreciation dominates but maintenance is low. Late, depreciation slows but repairs and downtime spike. The lowest point of the combined curve is the economic life — the moment to cycle the truck.
Find Each Truck's Bottom of the Curve
Truck Inspection & Maintenance trends cost per mile per unit and flags the moment maintenance starts outrunning depreciation — your replacement signal, backed by data.
The Cost That Hides From Your P&L
The reason fleets run trucks too long is that the worst costs are invisible. A P&L shows parts and labor, but not the idle crew, the missed delivery, or the customer who didn't call back. As much as 40–60% of an old truck's true cost never appears in the books — creating a false economy that feels like saving while you're actually bleeding.
Signals You're Past the Sweet Spot
You don't need a consultant to spot a truck that's overstayed its economic life. These signals show up in the data and on the repair invoices — each one a flag that the unit has crossed from asset to liability.
When a month of maintenance costs more than a new truck's monthly payment, the math says replace now.
The unit's CPM trends above the fleet average and keeps climbing — the curve has turned back up.
A pending transmission or engine rebuild near $18,000 forces a clear rebuild-vs-replace decision.
More unplanned days out of service mean lost revenue that never shows on the repair bill.
Crossing the warranty line typically brings a 15–20% maintenance jump you now absorb in full.
Residual value hasn't bottomed yet — sell while the truck commands a premium, not after.
The Decision Rule, Made Simple
Strip away the spreadsheets and the call comes down to one comparison: the cost of keeping versus the cost of replacing. When keeping costs more, you cycle the unit.
Frequently Asked Questions
At the inflexion point where the rising cost of maintenance and downtime begins to outweigh the depreciation savings of keeping the older asset. For most long-haul Class 8 tractors that sweet spot falls between years five and seven, or roughly 500,000–700,000 miles. Regional and vocational trucks with lower mileage are more age-driven, often optimal at 8–10 years due to component wear and corrosion.
More than the repair bills show. Replacing at the optimal point versus about 30,000 miles late can cost roughly $37,000 more per truck — nearly twice as expensive — which scales to around $740,000 of wasted capital across a 20-truck fleet. Maintenance on trucks over 10 years old can reach $1.10 per mile, and a single bad year on an old unit can exceed the cost of all prior years combined.
Because the biggest costs are invisible. A standard P&L captures parts, labor, and fuel but not downtime, idle crew time, missed deliveries, or lost customers — and those hidden costs make up an estimated 40–60% of an aging truck's true expense. That creates a false economy where keeping the old truck feels like a saving while it quietly drains margin.
Compare the annual cost of keeping the truck — maintenance plus the value of downtime plus rising operating costs — against the annualized cost of a replacement, which is depreciation and financing minus residual value. When keeping costs more than replacing, cycle the unit. The key is including downtime, which most informal calculations leave out and which tips many "still cheaper to keep" trucks into replacement territory.
It turns your own maintenance history into a cost-per-mile trend for each unit. Truck Inspection & Maintenance tracks repair costs, downtime, and mileage per truck, surfaces the point where CPM stops falling and starts climbing, and flags units crossing into liability territory — so you replace on each truck's actual curve rather than a fleet-wide average or a gut feeling.
Replace at the Bottom of the Curve, Every Time
Truck Inspection & Maintenance trends cost per mile, downtime, and repair history for every unit, surfaces the moment maintenance starts outrunning depreciation, and flags trucks past their economic life — so you capture residual value, avoid the hidden costs, and protect margin on every replacement decision.