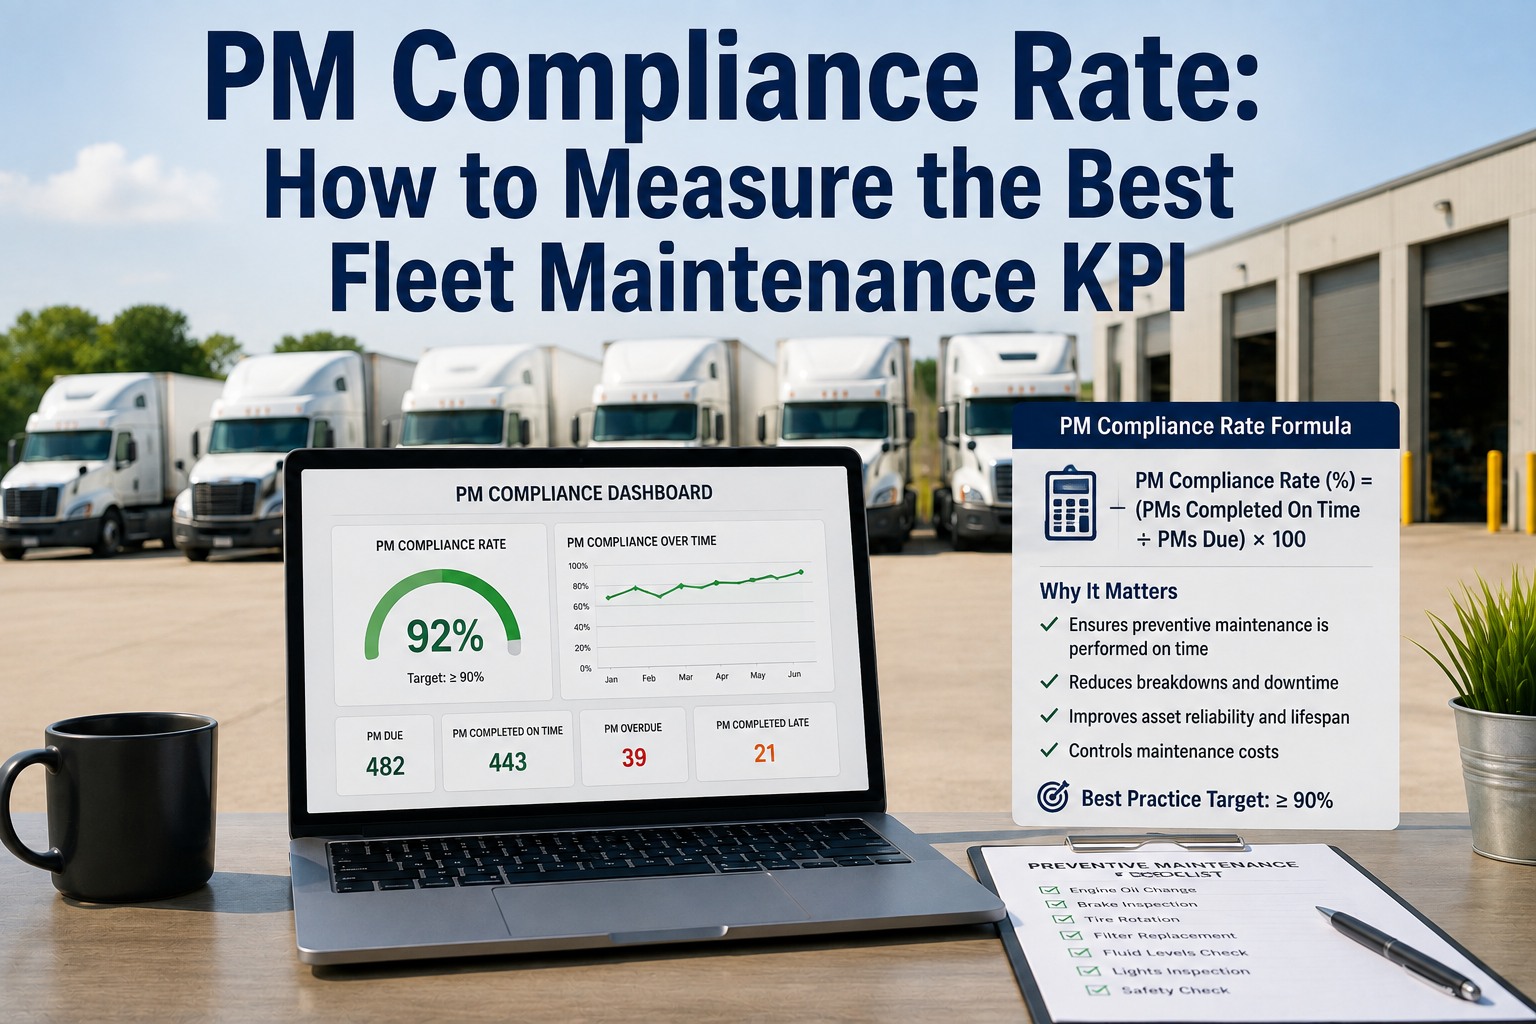
Ask ten fleet maintenance managers to name the single most important KPI on their dashboard and nine will point to PM compliance rate. It's the one leading indicator that reliably predicts everything else — future breakdown frequency, roadside OOS orders, cost per mile, vehicle availability, driver satisfaction. And unlike MTBF (which depends partly on asset age and manufacturer quality) or availability (which is downstream of PM discipline), PM compliance is almost entirely within your team's control. The formula is simple: PMs Completed On Time divided by PMs Scheduled, times 100. World-class fleets hit 95%+. Best-in-class per SMRP hits 90%+. Below 80% signals a systemic problem. But the industry average across all US commercial fleets sits at just 70% — meaning 3 out of 10 scheduled PMs are late or missed entirely, which statistically guarantees 3.5× more breakdowns within 60 to 90 days. The catch: the metric is easy to game. A PM finished the day it was due and one finished three weeks late both count as "completed" in the standard formula. That's why the 10% rule matters — a PM must complete within 10% of the scheduled interval (3 days for a 30-day PM, 500 miles for a 5,000-mile oil change) to count as on time. Get the measurement right, apply the 10% rule, publish the number weekly to every shop tech and fleet manager, and PM compliance moves from vanity metric to the most actionable data point in the fleet. Ready to make PM compliance the number that runs your maintenance program? Sign up free for Truck Inspection & Maintenance today — no credit card required and start tracking PM compliance rate automatically across your entire fleet with weekly dashboards, or contact our support team for a personalized walkthrough tailored to your fleet size, PM schedule complexity, and current compliance baseline.
PM Compliance Rate: How to Measure the Best Fleet Maintenance KPI
One formula. One weekly number. Predicts breakdowns, availability, cost per mile, and CSA scores. Here's how to measure it right — and what to do when the number slips.
The Formula — Written Once, Applied Everywhere
Every PM compliance calculation across every industry uses the same formula. Understand the two numbers going in and the KPI becomes actionable at the shop floor.
The 6-Band Benchmark Gauge — Where Your Fleet Stands
PM compliance is measured against clear industry benchmarks. Here's the 6-band gauge showing what each score band means for your fleet's reliability, breakdown rate, and cost profile.
Why PM Compliance Is the #1 KPI — 4 Reasons
Not every KPI belongs on the top of the dashboard. PM compliance earns that spot because of four properties no other single fleet metric combines.
What Pulls PM Compliance Down — 6 Root Causes
PM compliance rarely drops for a single reason. Here are the six systemic causes that pull the number down across every fleet type — and where to look first when your dashboard shows slippage.
Automate PM compliance tracking — weekly dashboards for every stakeholder
PM schedule generated from mileage, engine hours, and calendar triggers per truck. Automatic 10% rule window enforcement. Real-time compliance dashboard visible to dispatch, maintenance, and executives. Weekly compliance reports with trend charts per truck, per tech, per PM type. Truck Inspection & Maintenance software makes PM compliance the automated default rather than a spreadsheet effort — because top-performing fleets moved from 70% to 95%+ compliance within 90 days of digital PM adoption.
PM Compliance vs Other Fleet KPIs — Understanding the Relationship
PM compliance doesn't exist in isolation. Here's how it relates to the other 5 KPIs on a typical fleet maintenance dashboard — and why it sits at the top.
Frequently Asked Questions
PM compliance rate measures the percentage of scheduled preventive maintenance tasks completed on time. The formula is: PM Compliance Rate = (PMs Completed On Time ÷ Total PMs Scheduled) × 100. For example, if your shop scheduled 100 PMs for the month and completed 87 within the compliance window, your PM compliance rate is 87%. Industry benchmarks are consistent across sources: 95%+ is world-class per SMRP best practices, 90%+ is best practice threshold, 85-89% is acceptable but signals attention needed, 80-84% signals developing problems, 70-79% is warning zone (where the US industry average sits), and below 70% is critical program failure. The catch that most fleets miss: apply the 10% rule when counting "on time." A PM must complete within 10% of the scheduled interval to count as on-time — a 30-day PM has a 3-day compliance window, a 5,000-mile oil change has a 500-mile window. Without the 10% rule, PM compliance becomes a vanity metric that misses the actual reliability signal. Truck Inspection & Maintenance software enforces the 10% rule automatically.
Industry best practice targets 90% or higher, with world-class operations at 95%+. Per SMRP Best Practices (6th Edition), world-class PM compliance is 90% or higher — meaning at least 9 out of every 10 scheduled PMs completed within the compliance window. For critical A-class assets (heavy-duty trucks in commercial service, aircraft, medical equipment), the target is 95%+. For less critical assets, 90% is acceptable. The 2026 US commercial fleet industry average sits at just 70%, which correlates statistically with 3.5× more breakdowns than fleets above 90%. Only 28% of US fleets achieve 95%+ PM on-time completion. The improvement path from 70% to 95% typically takes 90-180 days with digital PM systems, and yields 50% breakdown reduction, 15-25% lower total maintenance cost within 2 years, and 5-8 percentage point improvement in vehicle availability. Setting the target below 90% is a red flag — it signals acceptance of a program that's already predicting breakdowns.
The 10% rule states that a preventive maintenance task must complete within 10% of the scheduled interval to count as "on time" for compliance calculation purposes. Applied to specific PM intervals: a 30-day PM has a 3-day compliance window (days 27-33), a 5,000-mile oil change has a 500-mile compliance window (4,500-5,500 miles), a 250-hour engine PM has a 25-hour compliance window, an annual DOT inspection has a 36-day window (37 days before or after the due date). Missing the window in either direction = counted as a miss for compliance calculation. Why the 10% rule matters: without it, a PM completed 3 weeks after its due date still counts as "completed" in the standard formula, but it lost most of its value because the whole point of PM is catching wear and failure risk before it turns into downtime. Teams can post a 95% compliance rate while running a program that's chronically late and the metric never reveals the problem. Applying the 10% rule typically drops reported compliance by 8-15 percentage points — but the number you get is honest and actually predicts breakdowns.
PM compliance rate combines four properties that no other single fleet KPI matches. First — almost entirely controllable: unlike MTBF (depends on asset age and manufacturer quality) or vehicle availability (depends on external repair timing), PM compliance is nearly 100% within the team's control. The team writes the schedule, prioritizes execution, and closes the loop. Second — leading indicator: most KPIs tell you what already happened (breakdown count, cost per mile, roadside violations); PM compliance tells you what will happen 60-90 days from now. Third — actionable at every level: technician can close the work order in window, fleet manager can adjust scheduling, executive can allocate resources. Same number, useful action at every level of the organization. Fourth — predicts every other KPI: improving PM compliance from 70% to 95% typically reduces breakdowns by 50%, cuts total maintenance costs 15-25%, improves availability 5-8 percentage points, reduces roadside OOS orders, and lowers cost per mile. No other single metric combines all four properties. Contact our team to see Truck Inspection & Maintenance PM compliance dashboards in action.
PM compliance rarely drops for a single reason. Six systemic root causes account for most compliance slippage across fleets. Unrealistic schedule — PM intervals set at ideal OEM spec without accounting for actual duty cycle, technician capacity, or truck downtime windows. Reactive work encroachment — emergency breakdowns push scheduled PMs off the calendar (shop runs 55% reactive when it should run 20%). Technician understaffing — not enough wrench hours to complete scheduled PM volume, compliance drops proportionally with tech capacity. Dispatch-maintenance conflict — dispatch keeps trucks in service to meet load commitments while maintenance needs the truck for scheduled PM, and without coordination the PM window closes. Manual tracking errors — spreadsheet PM tracking, paper work orders, or radio/WhatsApp coordination means completed PMs never get logged so reported compliance looks worse than reality. Frozen PM templates — equipment upgraded, duty cycle changed, but the original PM schedule stays frozen (technicians complete obsolete tasks while genuinely needed work goes unscheduled). Fix: audit which of the 6 root causes applies, apply targeted intervention rather than blanket "try harder" messaging.
Weekly for operational review, monthly for management review, quarterly for trend analysis. Weekly cadence catches slippage before it becomes a systemic problem — if compliance drops from 92% to 87% in one week, the underlying cause (a broken tool, a shop tech out sick, an emergency breakdown wave) can be identified and corrected before it drags the monthly number down. Monthly review looks at 4-week trends, per-truck and per-tech performance, and whether specific PM categories are slipping (oil changes may hold at 95% while brake inspections drop to 78%). Quarterly review addresses systemic questions: is the PM schedule still right for the duty cycle? Do we need more techs? Is dispatch coordination working? Reviewing PM compliance less frequently than weekly means problems compound before they're visible. Reviewing without action attached — "our compliance is 82% and we need to do better" — teaches teams that the metric doesn't matter. Every off-target compliance number should trigger specific action assigned to a specific owner with a specific timeline. Try free: sign up here.
Truck Inspection & Maintenance software turns PM compliance into a weekly automated number
PM schedules generated from mileage, engine hours, and calendar triggers per truck. Automatic 10% rule enforcement — no late PMs counted as on-time. Real-time compliance dashboard for dispatch, maintenance, and executives. Weekly reports with trend charts per truck, per tech, per PM category. Root-cause analysis for slippage with targeted action assignments. Every element of PM compliance tracking automated in one platform — because moving from 70% to 95%+ compliance takes 90 days with the right system and forever with a spreadsheet.