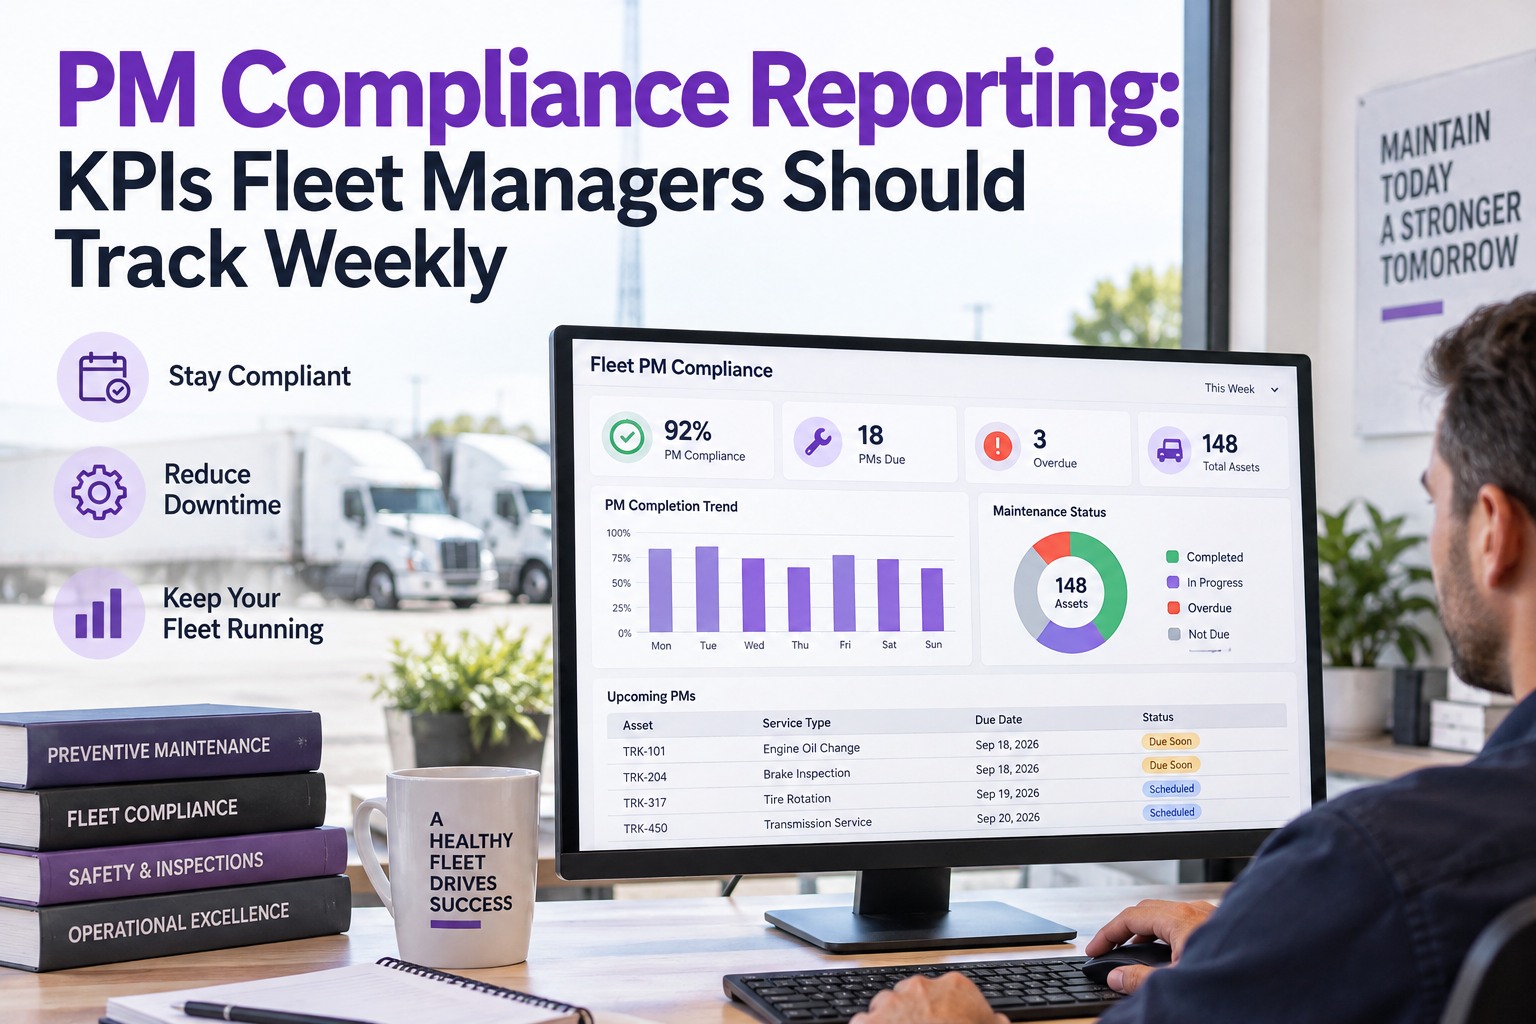
Most fleets don't miss PM because they don't care — they miss it because they don't measure it weekly. A quarterly compliance review tells you which trucks slipped three months ago; a Monday-morning dashboard tells you which trucks are about to. The difference between an 82% PM compliance fleet and a 96% one isn't budget or headcount — it's whether the fleet manager is looking at the right five numbers every week. Start free and get your weekly PM report auto-generated every Monday.
The Five PM KPIs Every Fleet Manager Should See Every Monday
A quarterly PM review tells you what already went wrong. A weekly one tells you what's about to. Truck Inspection & Maintenance Management Software auto-generates a Monday-morning report with the five numbers that decide whether your fleet stays audit-ready this week — or slips one truck at a time toward a DOT finding.
Why Weekly, Not Monthly or Quarterly
PM slippage compounds. A truck that missed its 25,000-mile service on Monday runs 3,000 more miles by Friday; a truck two weeks overdue is a truck at fifteen percent higher failure risk than one on schedule. The purpose of a weekly report isn't to punish the fleet — it's to catch the slip while it's still one truck, before it becomes a pattern.
The Five KPIs — And What Each One Actually Tells You
Every fleet software vendor will show you thirty metrics; five is what a fleet manager can actually act on before Monday's coffee is cold. Each one answers a different question, and together they give a complete picture of whether the PM program is holding or slipping.
PM Compliance Rate
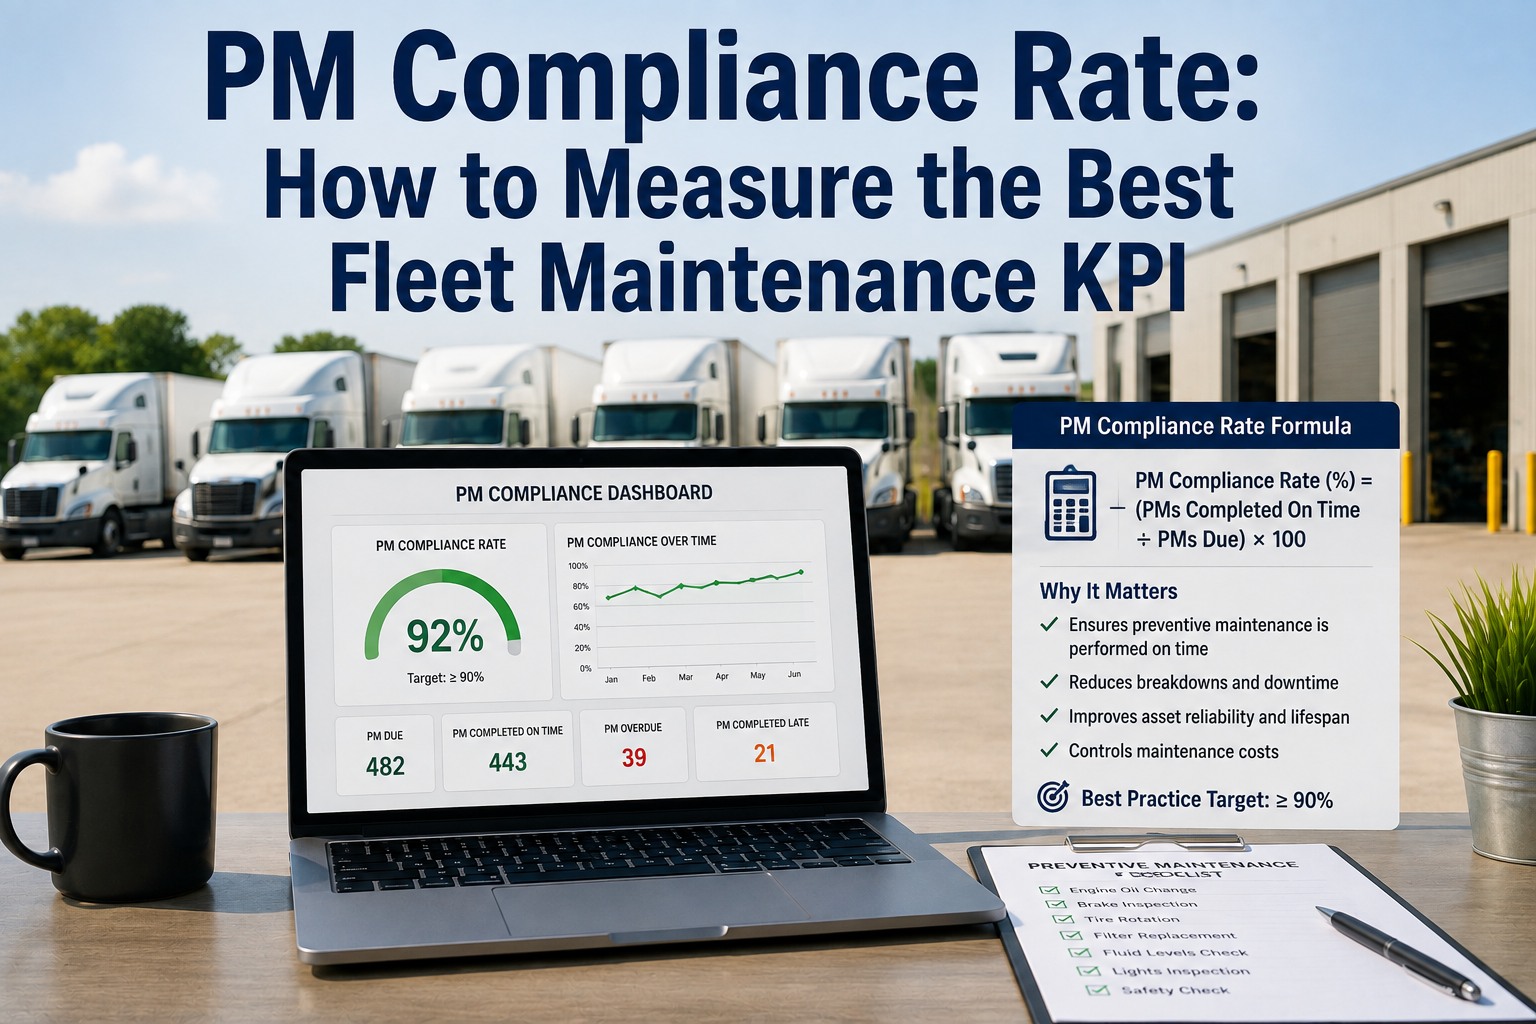
The headline number. Anything under 95% means the program is slipping; anything under 90% means the DOT is going to notice. Track it fleet-wide and per-terminal so a single yard doesn't drag the whole number.
Overdue PM Count
The compliance rate hides how bad the slippage is. A fleet of 100 trucks at 96% compliance sounds fine — until you see four trucks are each three weeks overdue. This number surfaces the worst offenders by name.
Planned vs. Reactive Ratio
The best predictor of PM discipline. Best-in-class fleets run 80% or more of their work orders as planned; a fleet firefighting at 40% reactive isn't just losing money on emergency parts, it's telling you the schedule isn't being followed.
DVIR-to-Work-Order Time
A defect flagged in a DVIR but not converted to a work order for three days is a defect that will still be there next week. Measures whether the paperwork loop is actually closing. This is where fleets discover their maintenance planner is a bottleneck.
Repeat-Defect Rate
The one number that tells you whether repairs are actually fixing things. A high repeat rate means either PM is missing root causes, or the shop is band-aiding instead of resolving. Trends here predict future breakdowns better than the failure history itself.
What the Monday-Morning Report Looks Like
The report itself is one screen — no drill-downs required to see the state of the fleet. Every KPI shows the number, the direction (arrow up or down from last week), and whether it's inside or outside the target band. A green board means you can go work on other things; a red one gives you the exact truck to walk out to.
Threshold Bands — Green, Amber, Red
Every KPI needs a rule for when it crosses from "fine" to "act now." A weekly report without thresholds is just a stack of numbers; with them, it's a decision.
| KPI | Green | Amber | Red |
|---|---|---|---|
| PM Compliance | ≥ 95% | 90–94% | < 90% |
| Overdue PMs | 0–2 | 3–5 | ≥ 6 |
| Planned Ratio | ≥ 80% | 65–79% | < 65% |
| DVIR → WO Time | ≤ 4h | 4–24h | > 24h |
| Repeat-Defect Rate | < 3% | 3–5% | > 5% |
The Report Writes Itself
Truck Inspection & Maintenance Management Software calculates every one of these KPIs from the DVIR, PM, and work-order data your fleet is already producing — no spreadsheet exports, no manual counting. The Monday-morning report lands in the fleet manager's inbox with every number, every trend arrow, and every red-band asset called out by unit number.
The Weekly Review Ritual
A report only earns its keep if it turns into decisions. The best-run fleets treat the Monday report as a 15-minute meeting with a fixed structure — no rambling, no rehash, just five questions in the same order every week.
What the Data Looks Like in an Audit
Weekly reports aren't just for internal management — they're the strongest audit evidence a fleet can produce. When a DOT reviewer asks whether your PM program is being followed, the answer is a stack of 52 signed reports for the year, not a promise.
Frequently Asked Questions
Get the Five Numbers That Decide Your Fleet's Week
Truck Inspection & Maintenance Management Software turns your existing DVIR, PM, and work-order data into a Monday-morning report with the five KPIs a fleet manager can actually act on — with green/amber/red thresholds, week-over-week trend arrows, and every red-band asset named. Leading fleets use it to lift PM compliance above 95%, cut reactive work, and stay audit-ready year-round.