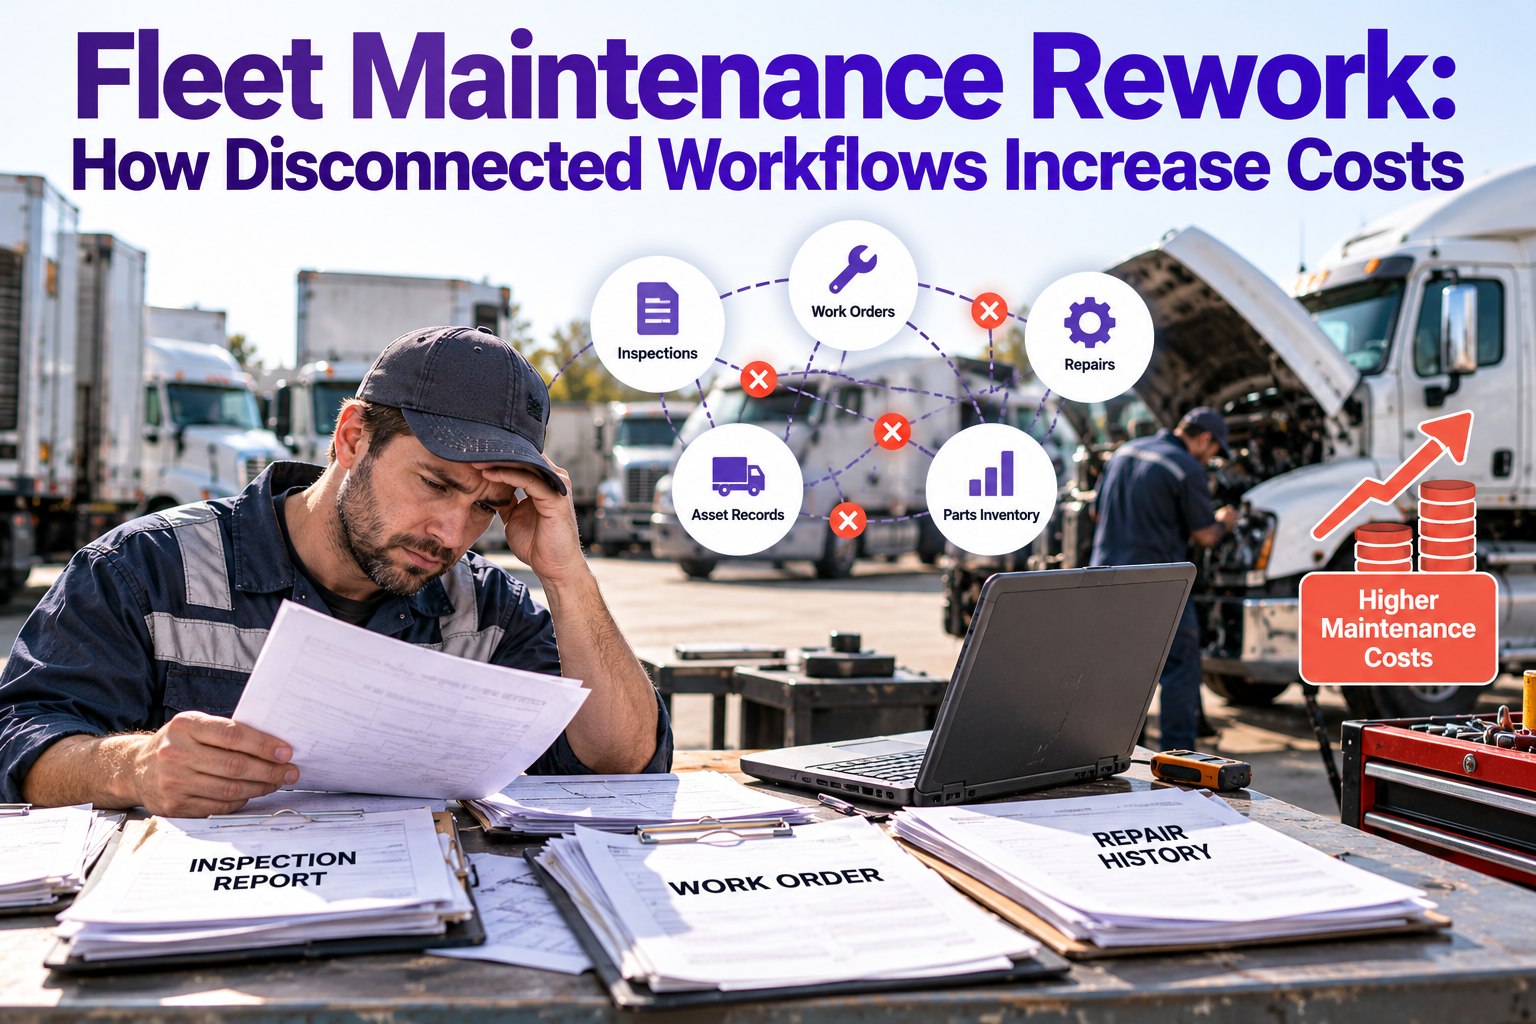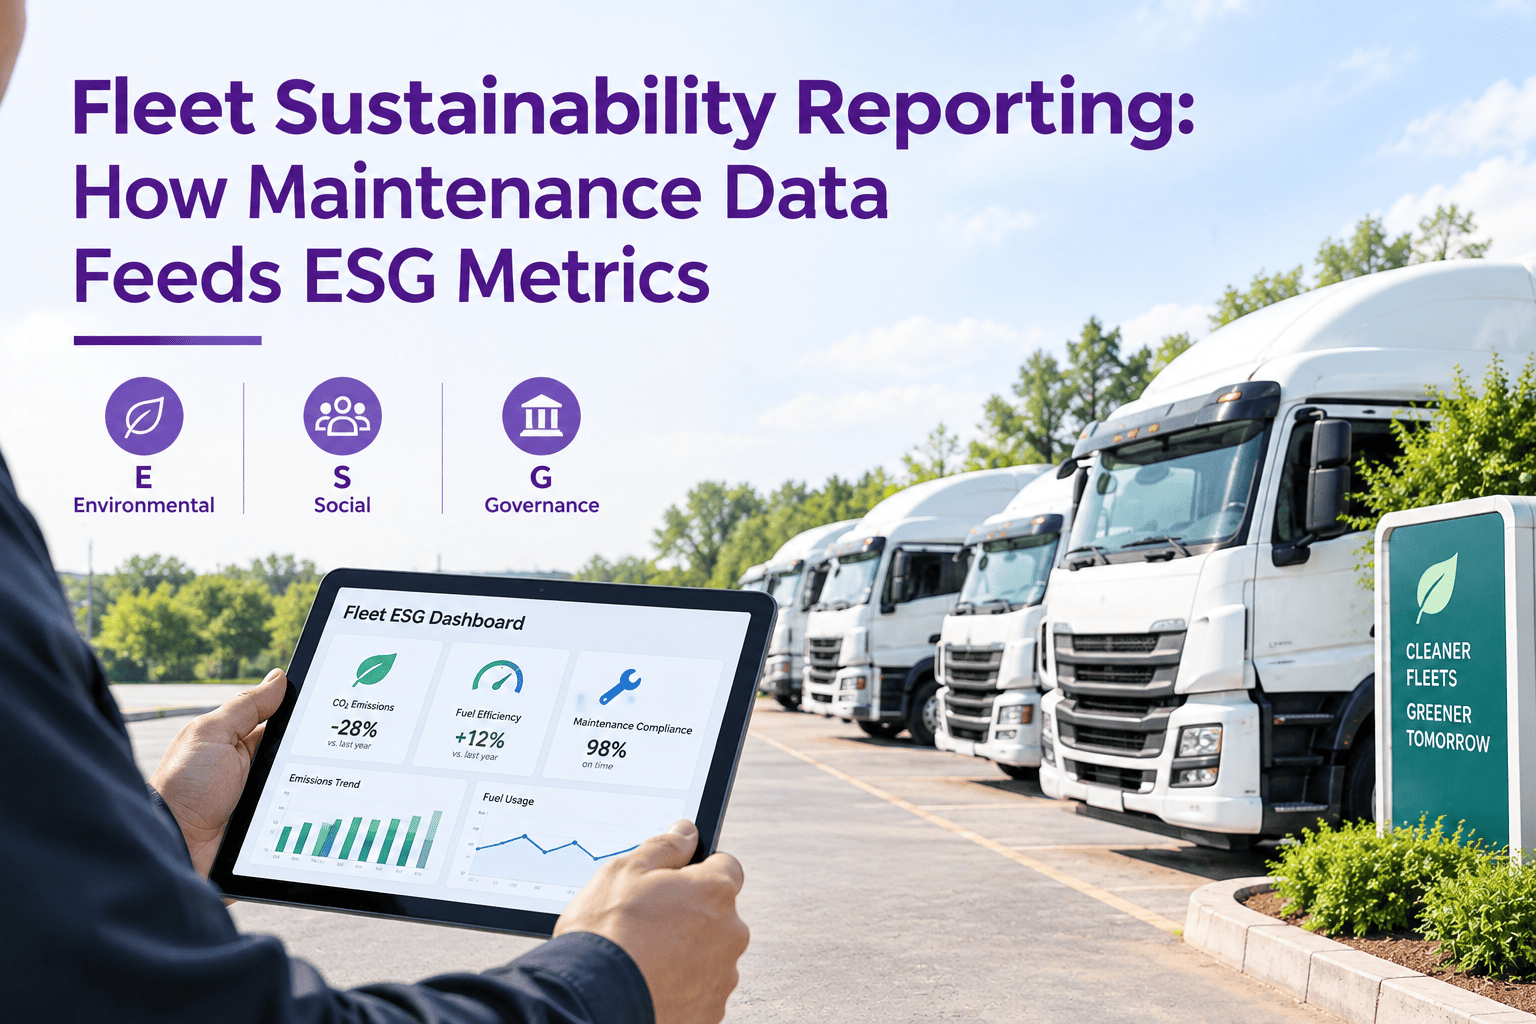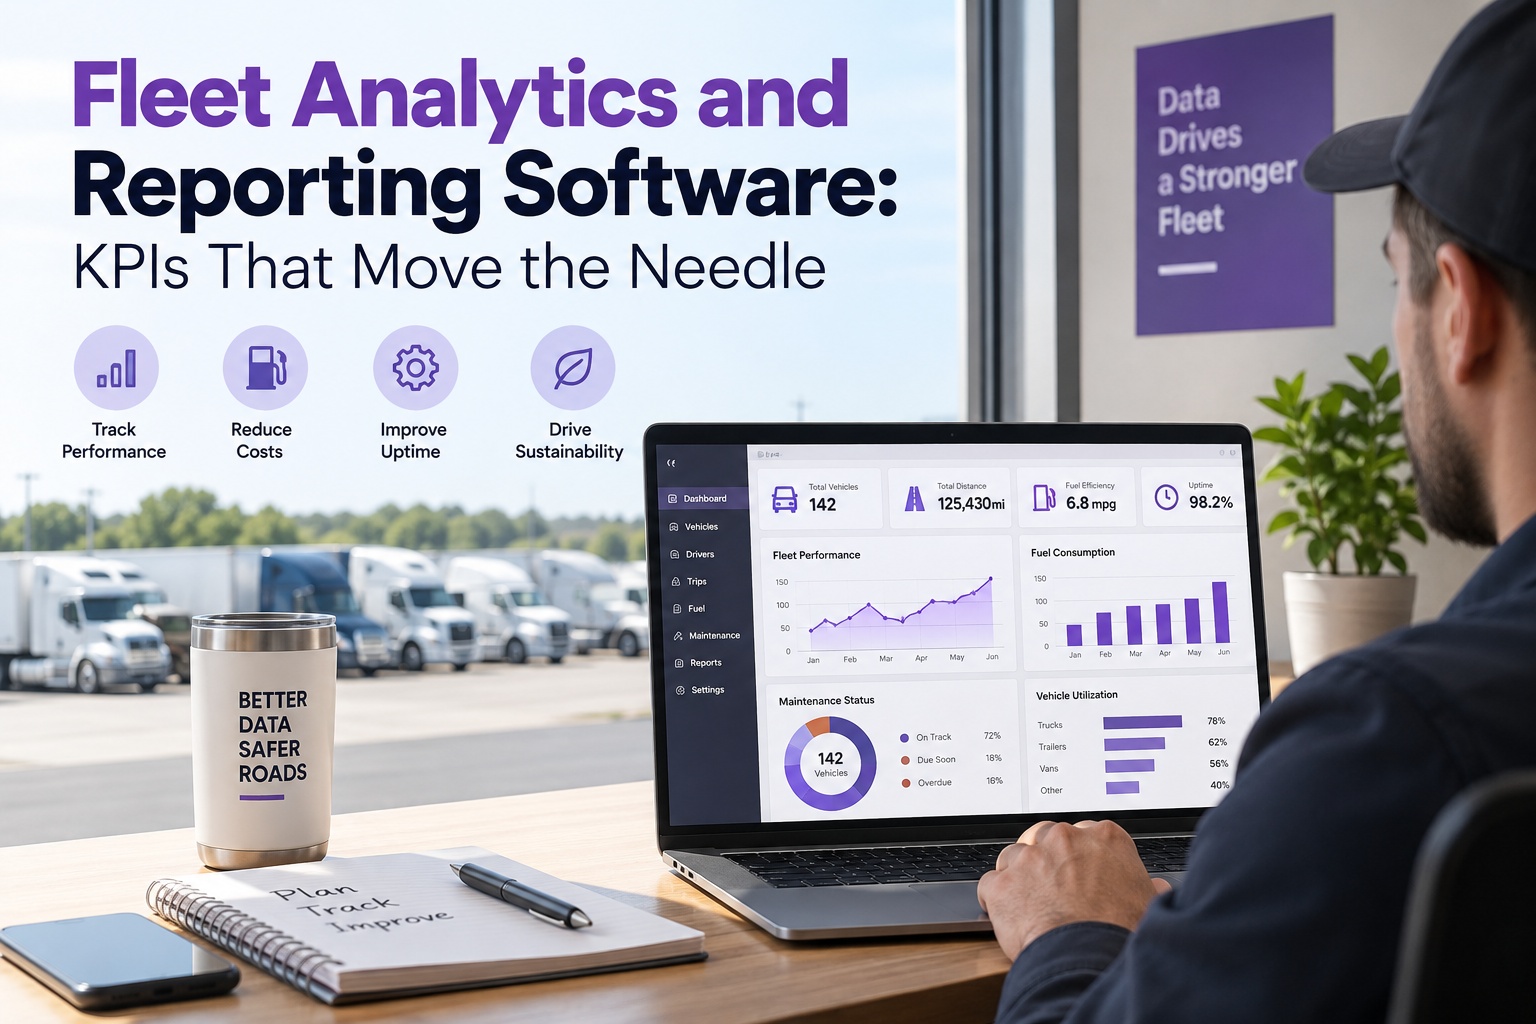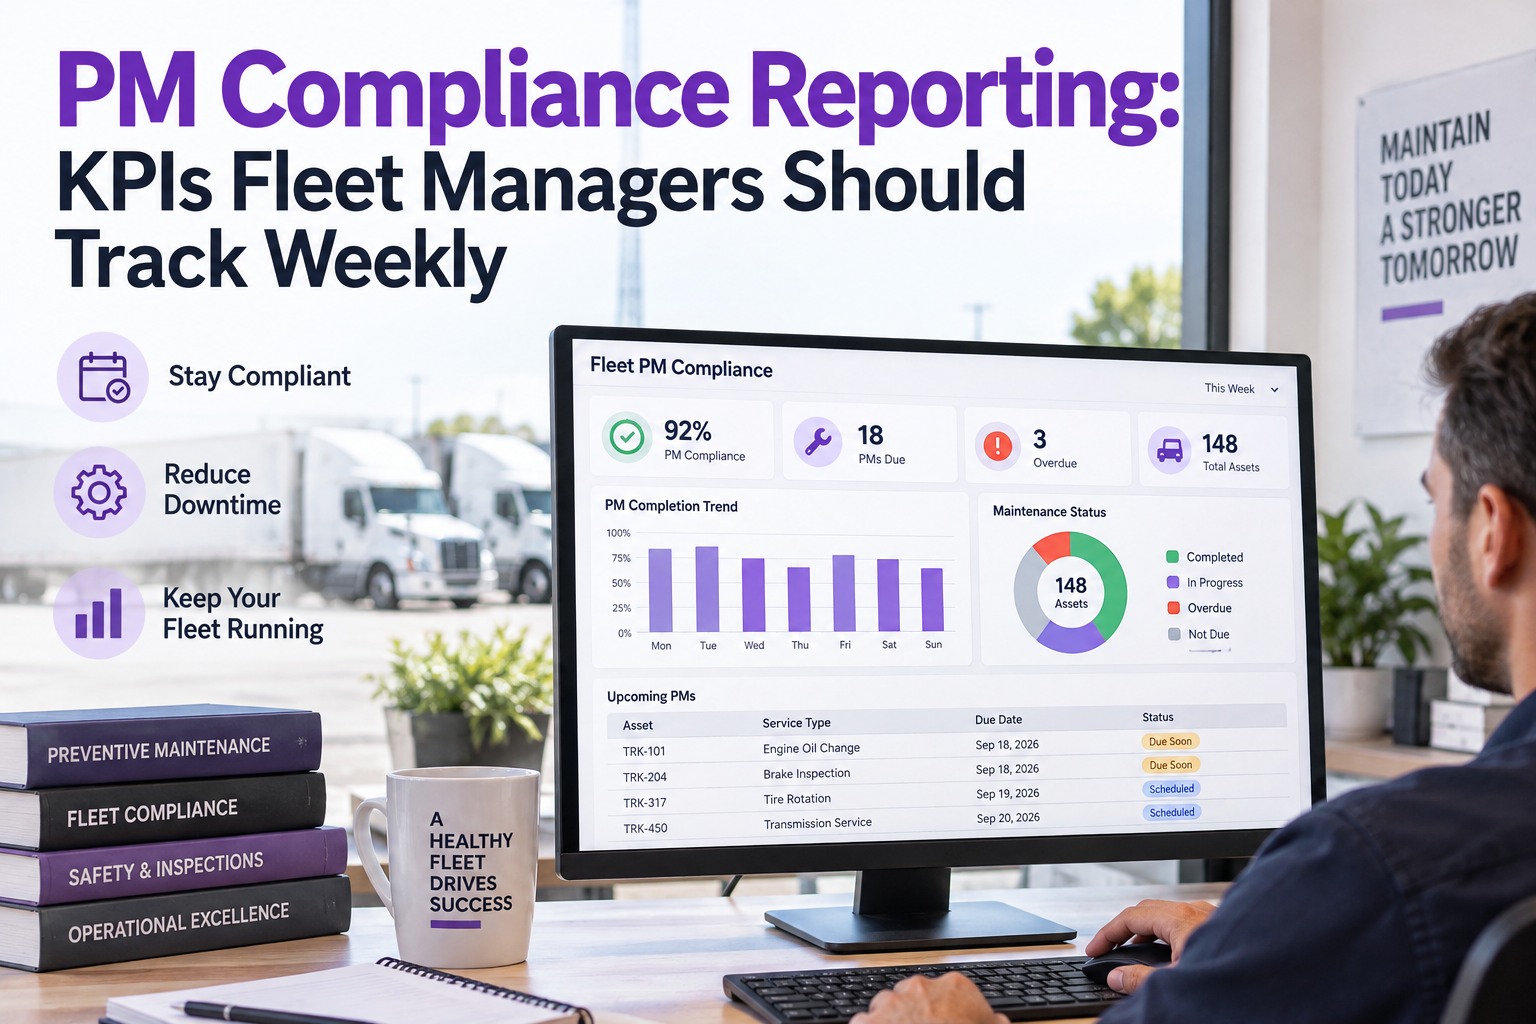
A maintenance report that's a pile of invoices isn't a report — it's evidence nobody reads. Leadership doesn't want line items; they want four or five numbers that answer one question: is the fleet getting cheaper, safer and more available, or not? The real job of fleet reporting is turning a month of work orders into a story a CFO reads in thirty seconds. This guide covers the KPIs that carry that story, the targets that make them mean something, and how to put them on a dashboard leadership actually opens. Start free and turn your work orders into a dashboard.
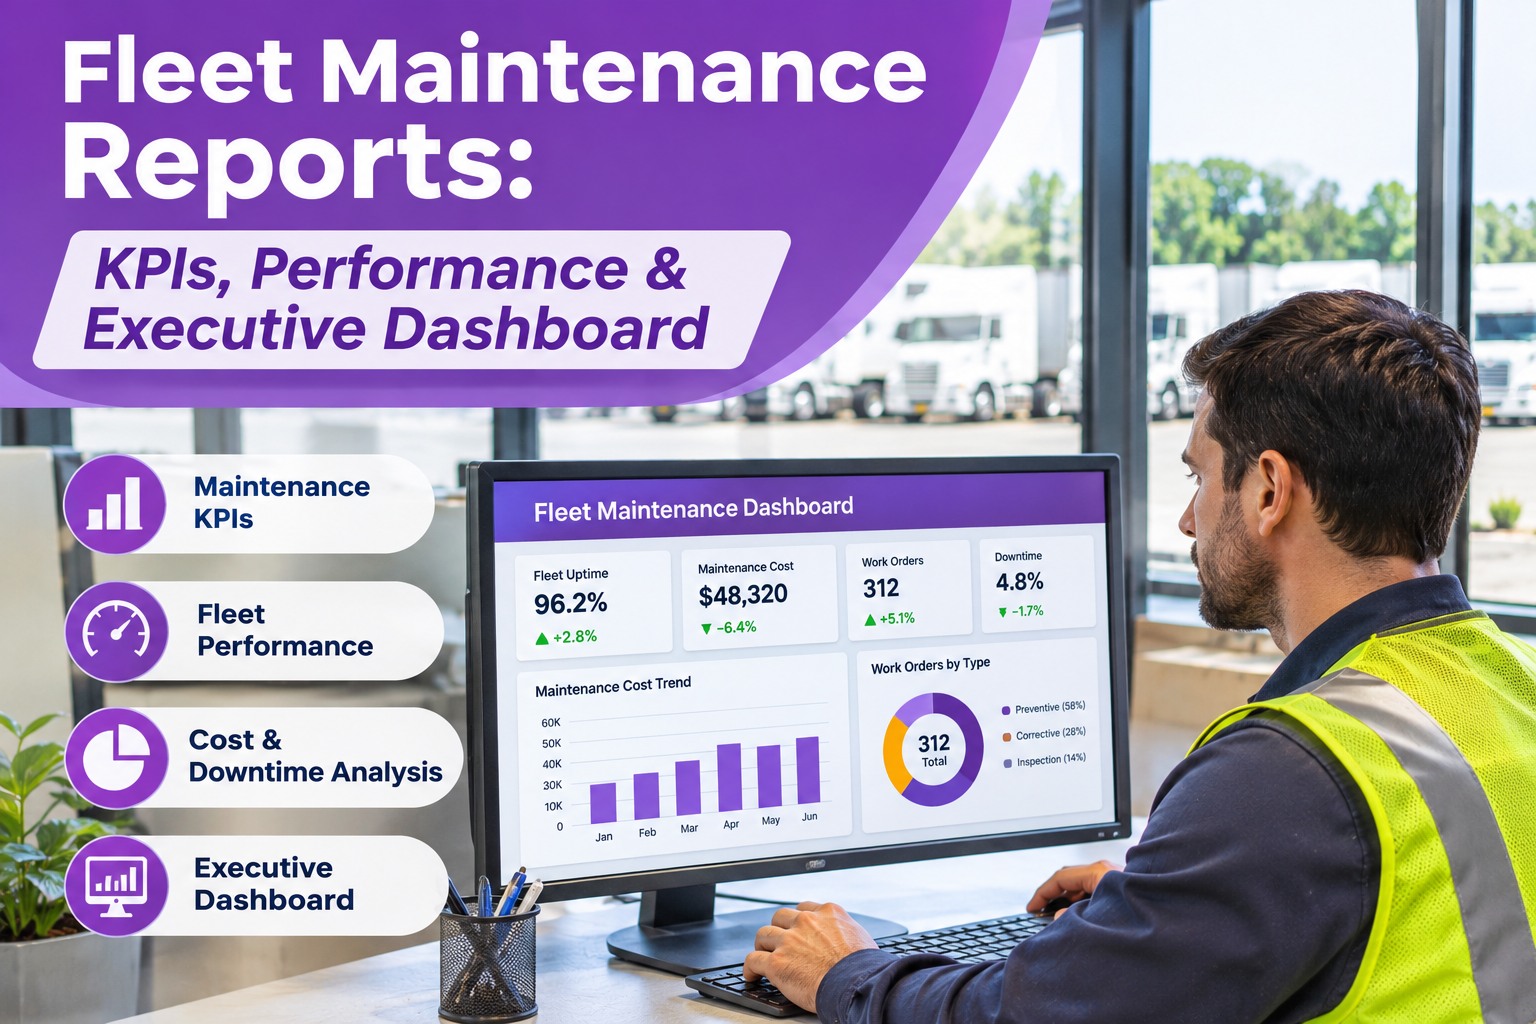
Fleet Maintenance Reports: KPIs, Performance & Executive Dashboard
The Five KPIs That Carry a Fleet Report
There are dozens of fleet metrics, but five cover all four dimensions leadership cares about — cost, availability, reliability and discipline. Start here; add the rest later.
The Three Questions Leadership Actually Asks
Executives don't think in KPIs; they think in questions. Group the metrics under the three they ask and the report organizes itself.
Leading vs Lagging: Why the Order Matters
Here's the insight that separates a useful dashboard from a rear-view mirror. The KPIs aren't independent — the leading one you can act on today drives the lagging ones you'll report next quarter. Fix the front of the chain and the rest follow.
This is why a report built only on cost per mile is a report you can't act on — by the time the number moves, the cause is months old. Lead with PM compliance and reactive ratio, and cost per mile takes care of itself. Book a demo to see the leading metrics that move your cost per mile.
What Good Looks Like: The Target Scorecard
A number without a target is trivia. These are the published benchmarks fleets measure against — but set your own baseline first, then chase the target from where you actually stand.
Reporting Cadence: Who Sees What, When
The same data serves four audiences at four speeds. Match the view to the reader or the report gets ignored.
The Dashboard Is Only as Current as the Data Under It
A monthly report built by hand is stale before it's sent. When every KPI is calculated from the work orders and inspections as they close, the dashboard is live — and the monthly report is a screenshot, not a week of spreadsheet work.
The Report Nobody Reads
Most fleet reports fail the same four ways, and all of them are fixable. They show too many metrics, so the signal drowns — pick five, not twenty-five. They show a number with no target, so no one knows if it's good. They show this month with no trend, so no one sees direction. And they lean on vanity metrics — total work orders closed, hours logged — that measure activity, not outcomes. A report that shows five outcome KPIs, each with a target and a trend arrow, is one a busy executive can read and act on. Start free and report five KPIs that actually land.
Why Fleets Report From Software
Frequently Asked Questions
Start with five: PM compliance, availability or uptime, cost per mile, planned-vs-reactive ratio, and MTTR. Together they cover reliability, cost, availability and discipline. Add MTBF, parts fill rate and DVIR compliance once the first five are solid. Book a demo to see these KPIs on your fleet.
Aim for 90% or better, with best-in-class fleets at 95%-plus. Below 85% quietly builds reliability problems that surface as unplanned downtime weeks later, which is why PM compliance is the leading metric to watch. Book a demo to track PM compliance automatically.
Answer their three questions — is it reliable, affordable and compliant — with five KPIs, each shown against a target and a trend arrow, on one screen. Lead with the outcome numbers, keep the detail one click away, and skip vanity metrics like total work orders closed. Book a demo to see the executive dashboard.
Leading KPIs — PM compliance, inspection and scheduled-service adherence — are proactive and tell you what's coming. Lagging KPIs — downtime, MTTR, breakdown rate, cost per mile — report what already happened. Managing the leading ones is how you move the lagging ones. Book a demo to see leading and lagging metrics together.
Turn a Month of Work Orders Into a Report Leadership Reads
Truck Inspection & Maintenance Management Software calculates every fleet KPI from the work you already log, shows them on a live executive dashboard against target and trend, and sends the report on schedule — so your numbers tell the story for you.