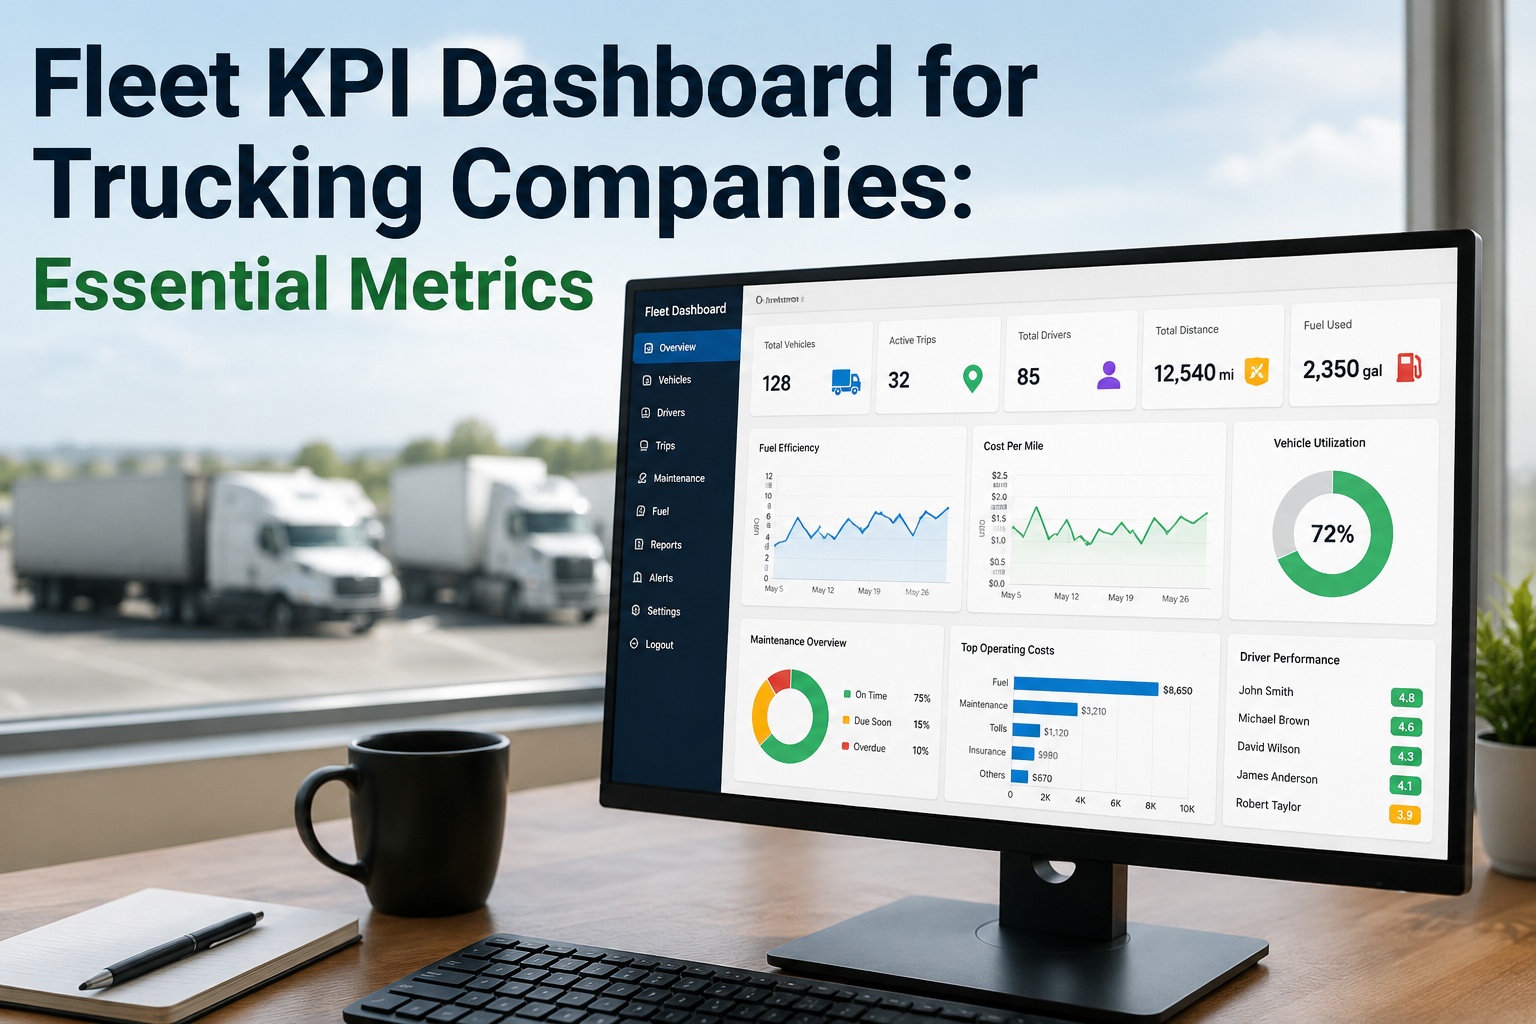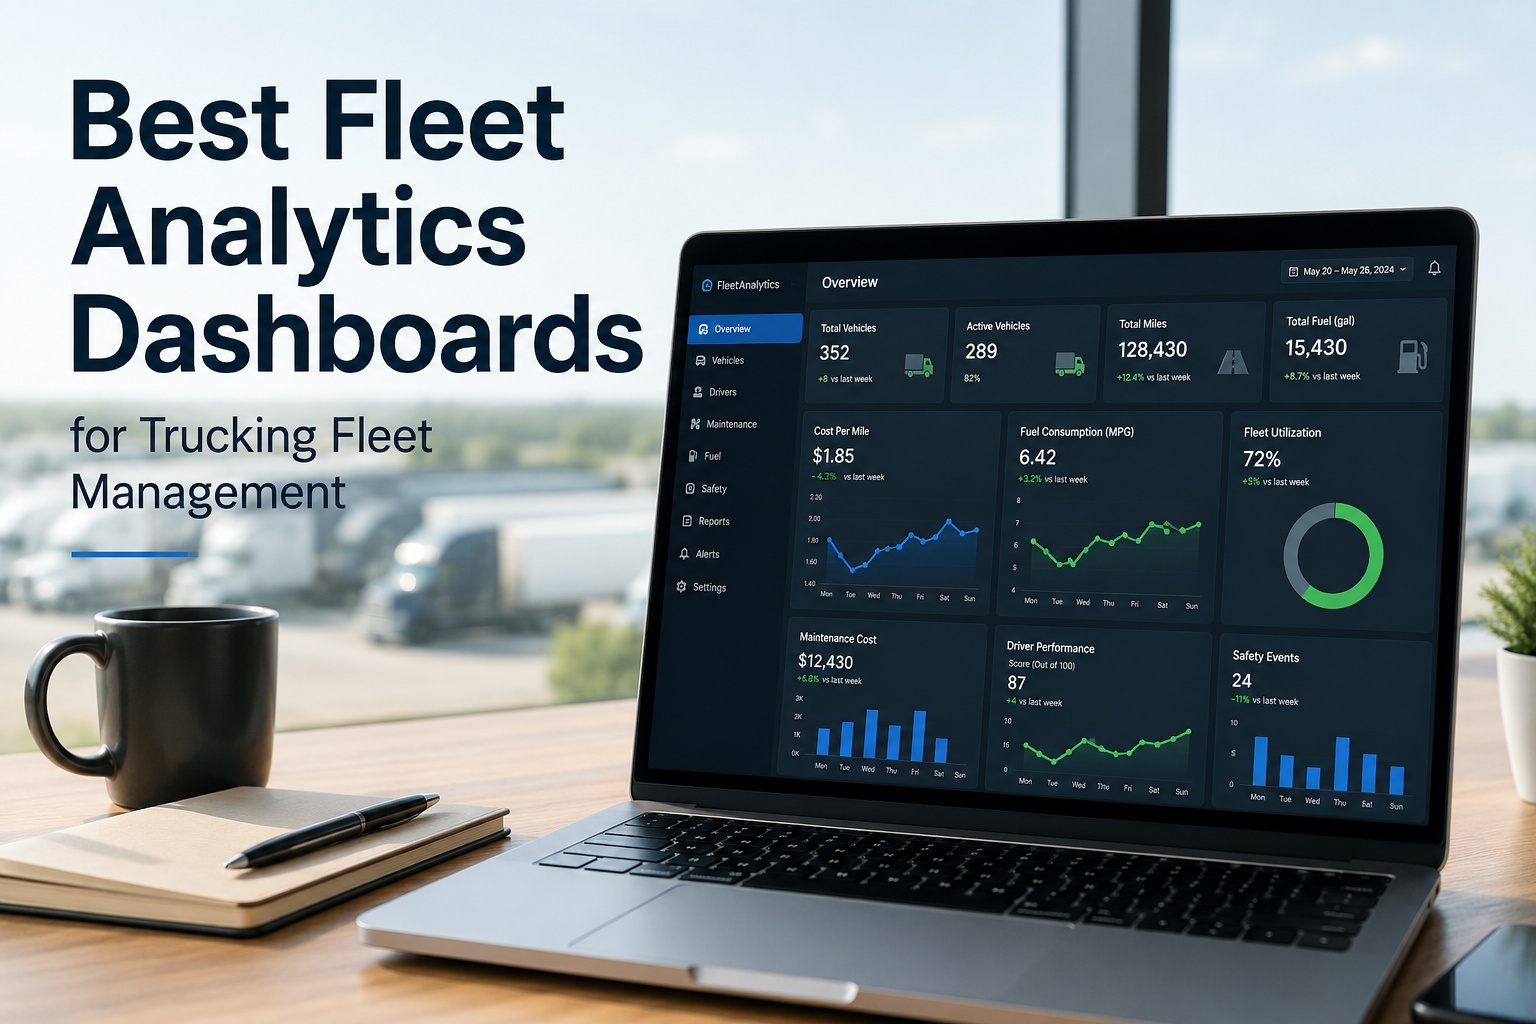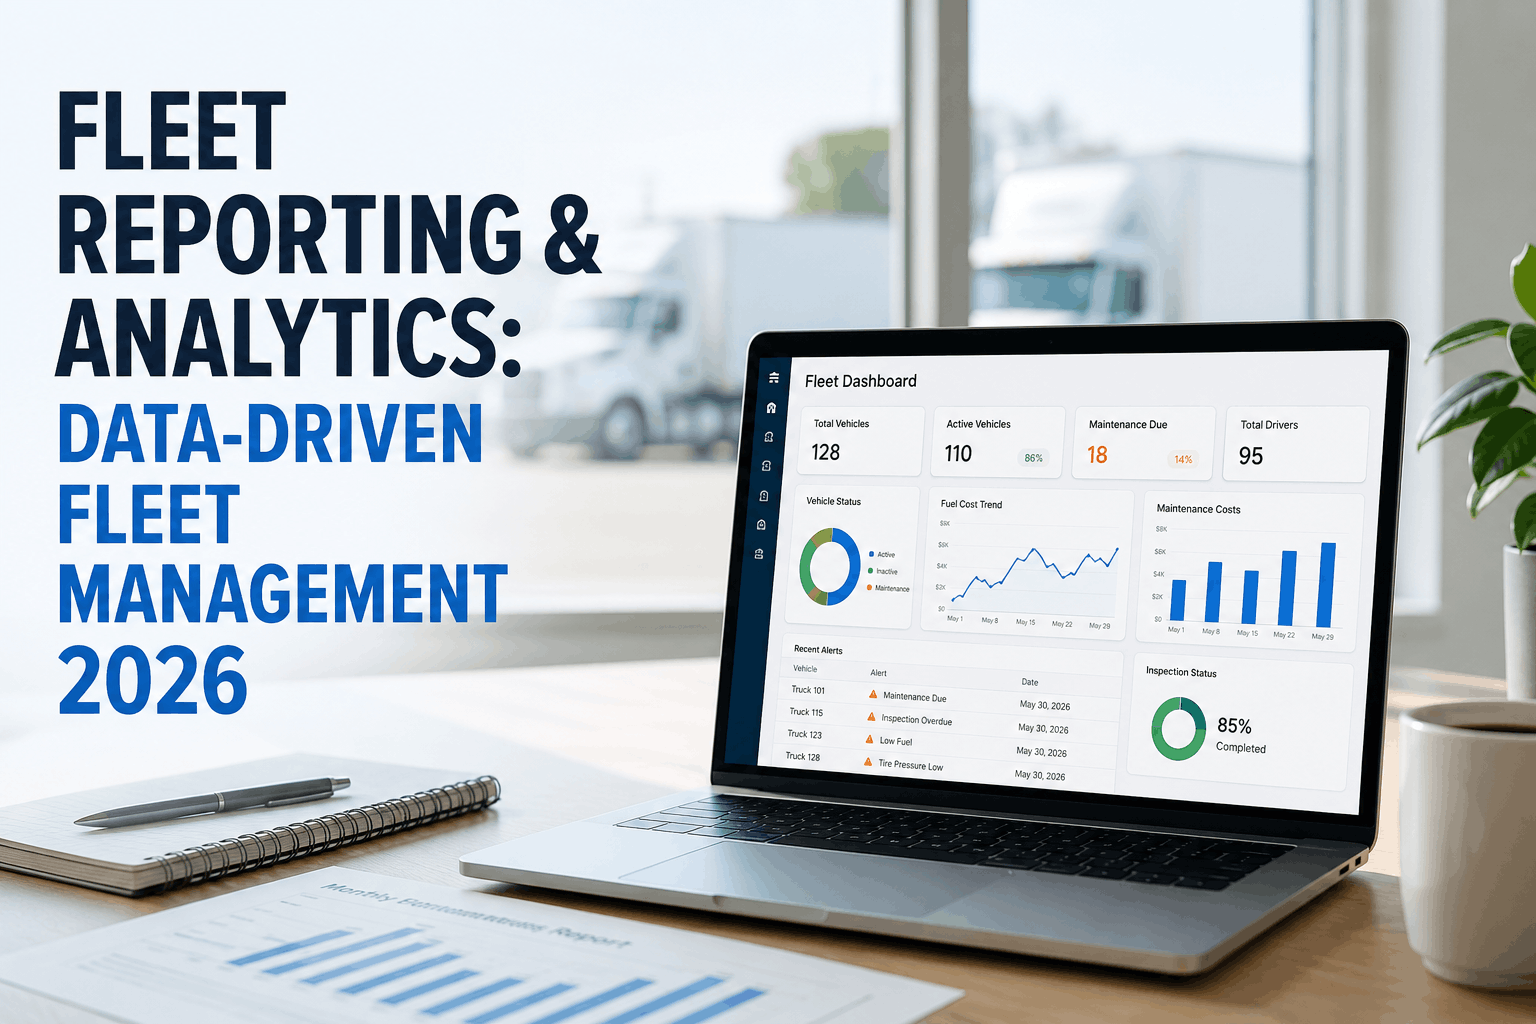
Most fleet reports fail one of two ways — they track four numbers when they should track fifteen, or they track forty when nobody reads past page two. The right answer sits in the middle: a small, disciplined set of KPIs that answer questions leadership actually asks, arranged so the leading indicators (the ones you can still act on) sit above the lagging ones (the ones that just tell you what already happened). This guide is that set — the KPIs that move the needle, the benchmarks that tell you where you stand, and the cadence that turns numbers on a screen into decisions on a Monday morning. Start free and put every KPI below on a live dashboard from day one.
Track Fewer KPIs — Move the Ones That Actually Matter
A wall of forty metrics is a shield against making decisions, not a tool for making them. Truck Inspection & Maintenance Management Software builds the KPI stack the other way around: leading indicators (DVIR completion, PM on-time, defect-to-work-order time) surfaced first because you can still change the outcome, and lagging indicators (MTBF, cost per mile, uptime) tracked as the score that proves the leading work is paying back.
Leading vs Lagging — Read Both, But Act on Leading
The single most useful distinction in fleet analytics is the one between leading indicators (behaviour and process, changeable today) and lagging indicators (outcomes, already baked in). MTBF is a lagging KPI — by the time it moves, months of PM decisions have already happened. PM on-time is a leading KPI — it's the behaviour that will drive MTBF next quarter. Both belong on the dashboard, but the leading indicators are where the fleet manager's attention pays back, because they're the levers still in reach.
The 8 KPIs That Actually Move the Needle
Every KPI below has a formula, a target range, and a place in either the leading or lagging column. Track fewer than these and you can't see the full picture; track more and the important ones get lost. The benchmarks are 2026 industry data for medium-to-heavy commercial fleets and vary by duty cycle — use them as directional targets, not scorecards.
The 2026 CSA Driver-Observed BASIC scores DVIR quality directly. A completion rate below the target means the score cap is already being set below what your fleet can hit.
The single strongest predictor of MTBF next quarter. Below 85% means the shop is firefighting, above 92% means the shop owns its schedule.
Every hour a flagged defect sits without a WO is an hour a truck rolls with a known issue. Modern platforms auto-generate the WO the moment the checkpoint fails.
The single number that tells you whether the shop is running the fleet or the fleet is running the shop. Under 60% planned means chronic firefighting.
The reliability master metric. Trending down means an aging fleet, deteriorating PM discipline, or a duty-cycle mismatch. Correlates strongly with PM on-time.
Efficiency inside the shop. Auto-WO with pre-ordered parts can cut MTTR by more than half. Benchmark against similar work types — brake vs injector aren't the same comparison.
The CFO-facing metric. The 7-point gap between average and top-quartile is worth roughly 27 extra delivery days per vehicle per year.
The number that rolls up almost everything else. Reading CPM against MPG, maintenance CPM, and utilization tells you exactly which lever to pull when it moves.
The Benchmark Tiers — Where Your Fleet Actually Sits
Industry benchmarks are only useful as tiers, not as single targets. A fleet at "world-class" MTBF looks fundamentally different from a fleet at "at-risk" MTBF, and the gap between them is measured in five-figure per-truck cost differences per year. The table below is the 2026 five-tier landscape for four of the metrics above — read across to see where your fleet sits, then read down to see what tier movement is worth.
| KPI | World-Class | Best-in-Class | Industry Avg | Below Avg | At-Risk |
|---|---|---|---|---|---|
| PM Compliance | > 95% | 85–95% | 61–85% | 45–61% | < 45% |
| Fleet Uptime % | > 98% | 94–98% | 89–94% | 83–89% | < 83% |
| MTBF (Class 8) | > 65k mi | 45–65k | 30–45k | 18–30k | < 18k |
| MTTR (hours) | < 2 hr | 2–4 hr | 4–7 hr | 7–10 hr | > 10 hr |
| DVIR Completion | > 96% | 88–96% | 68–88% | 50–68% | < 50% |
The Tier Gap Is Worth Real Money — Close Yours One Metric at a Time
Our software scores your fleet against each tier automatically and flags the specific interventions that move you up: a PM template that lifts on-time compliance from 61% to 92%, a DVIR workflow that pushes completion above 96%, and defect auto-routing that collapses defect-to-work-order time from days to minutes. Small tier moves compound — the difference between industry-average and best-in-class MTBF is worth thousands per truck per year.
The Reporting Cadence — What to Read Daily, Weekly, Monthly, Quarterly
A KPI that gets checked at the wrong cadence is worse than no KPI. DVIR completion checked monthly is a rear-view metric; PM compliance checked daily is noise. The right rhythm is a stack — daily numbers for the shop lead, weekly for the fleet manager, monthly for finance, quarterly for leadership — and each tier only touches the metrics that are actionable at that cadence.
- Open work orders count
- P1 defects from last 24 hrs
- Trucks blocked from dispatch
- DVIRs submitted vs shifts
- PM on-time % (trend)
- Planned vs unplanned ratio
- Defect-to-WO time (trend)
- Top 5 repeat-offender units
- Cost per mile by unit & route
- Maintenance $ per vehicle
- Fuel MPG per driver
- Uptime % against target
- MTBF & MTTR trends
- CSA BASIC percentile
- Fleet age vs CPM curve
- Vehicle replacement cases
Frequently Asked Questions
Stop Watching Numbers — Start Moving Them
The 8 KPIs above on a live dashboard, benchmarked against 2026 industry tiers, updated the moment new work orders and DVIRs land. Fewer metrics, better decisions.