For most logistics operations in 2026, costs are climbing faster than revenue — fuel prices swing unpredictably, insurance premiums rise every year, aging vehicles cost more to maintain, and the driver shortage keeps labor expensive. The fleets that thrive aren't the ones with the biggest budgets; they're the ones with the most discipline. Top-performing logistics operations run 20–35% lower cost-per-mile than industry averages, not through one silver bullet but through a handful of optimization levers applied relentlessly. This guide breaks down where the money actually leaks — fuel, utilization, maintenance, and data blind spots — and the proven strategies that plug each one. Every lever connects back to the same foundation: visibility into what your vehicles are doing and proactive control over what happens next, which is exactly what Truck Inspection & Maintenance is built to deliver. Talk to our team to map these strategies to your fleet.
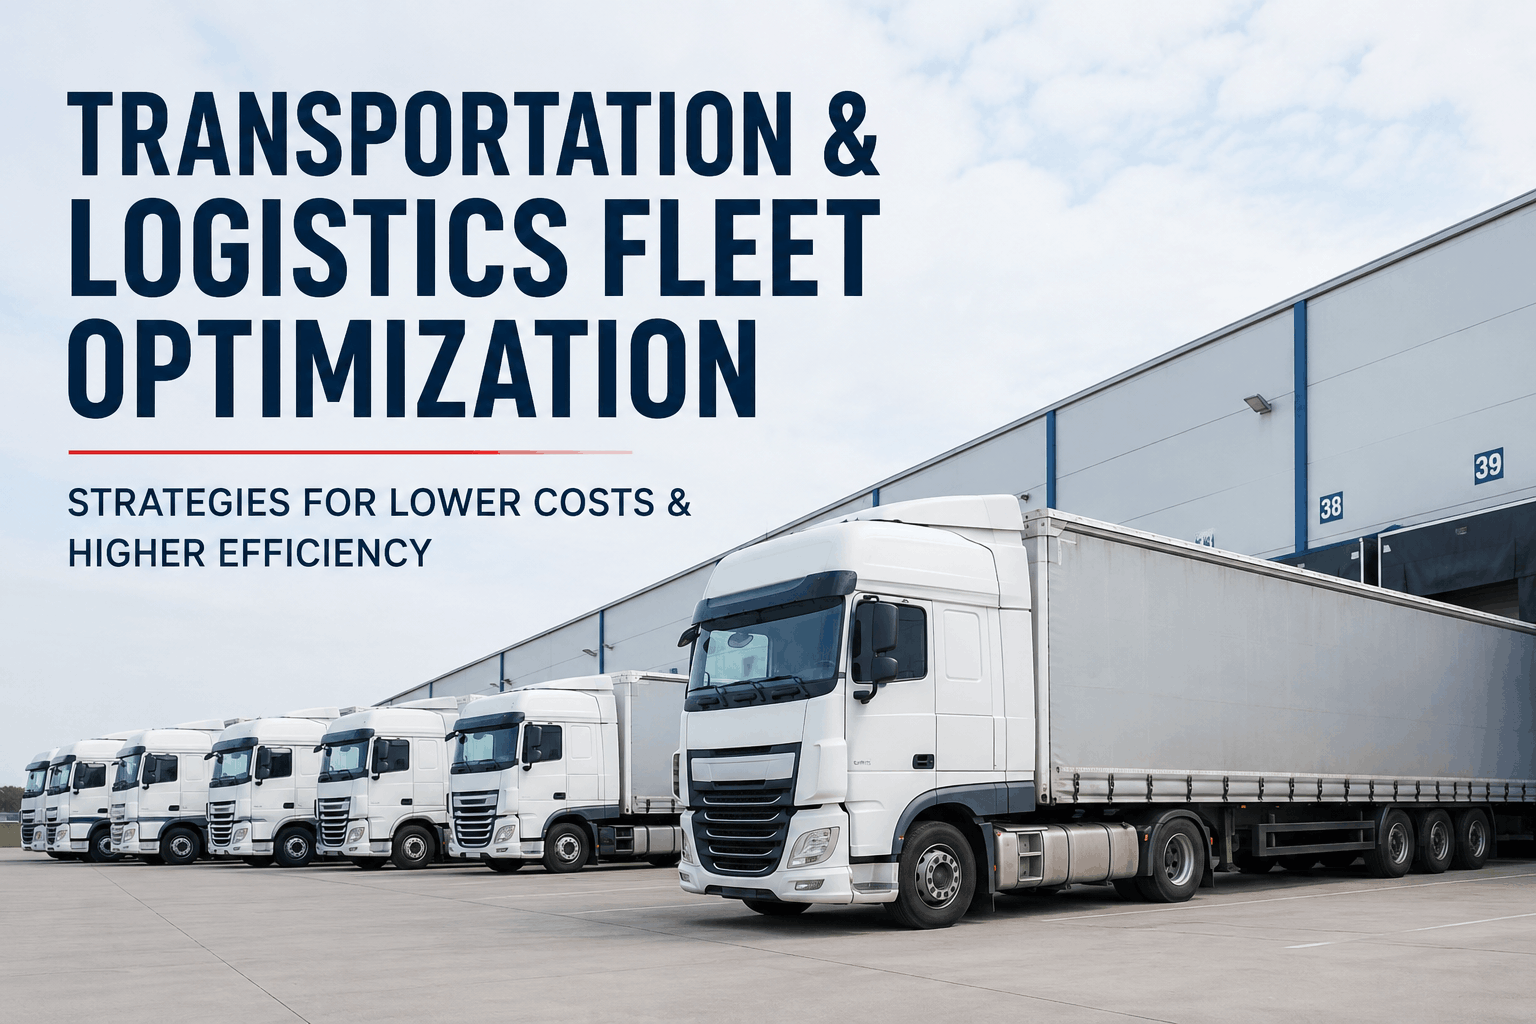
Transportation & Logistics Fleet Optimization
Four cost centers. Four levers. Lower cost-per-mile that compounds.
Where the Money Actually Leaks
Optimization starts with knowing where the dollars go. Fleet operating cost concentrates in four centers, and each one hides waste that stays invisible until you measure it. The breakthrough insight of 2026 is that these aren't separate problems — a poorly maintained truck burns more fuel, an underused asset still costs insurance and depreciation, and without data you can't see any of it. Tackle all four together and the savings compound. In logistics, small improvements stack fast: a 2% utilization gain or a 10-minute ETA improvement turns into major savings at scale.
Fuel
The largest controllable cost — and the most under-optimized. Idle time, detours, and bad routing quietly drain MPG.
Utilization
Underused vehicles still cost insurance, depreciation, and space. Deadheading (empty miles) is pure loss.
Maintenance
Reactive repairs cost 3–9x planned work — and neglected service silently erodes fuel economy too.
Data Blind Spots
What you can't see, you can't fix. Without KPIs, inefficiency hides across every vehicle in the fleet.
Lever 1 — Route Optimization
Routing is the single biggest fuel lever. Static planning calculates a path at dispatch and then leaves drivers to improvise around traffic; dynamic optimization continuously recalculates based on live traffic, weather, and delivery windows. The gap between them is real money — fleets using dynamic optimization cut fuel consumption 12–22% versus static planning, and comprehensive route programs report 10–15% reductions in total operating expense. AI-powered planning pushes it further, with reported fuel-and-cost reductions of up to 50% in the best cases.
Plan once, hope for the best
- ✕Fixed at dispatch — blind to live traffic & weather
- ✕Empty backhauls and unplanned detours
- ✕Drivers improvise; dispatch loses visibility
Recalculate in real time
- ✓Live re-routing around traffic, weather & delays
- ✓Geographically clustered stops cut empty miles
- ✓Deadheading reduced up to 35% with smart assignment
Lever 2 — Asset Utilization
Every vehicle you own costs money whether it moves or not. Utilization analytics expose which assets are underused and could be redeployed or retired, and which are overworked and heading for failure. Logistics companies report 20–30% improved vehicle utilization after integrating AI-driven analysis — that's the same freight moved with fewer trucks, or more freight moved with the same fleet. The fix is visibility: a centralized view of what each asset actually does, day in and day out.
Utilization analytics reveal which vehicles to redeploy, which to retire, and which are overworked — turning a static fleet into a balanced one.
Optimization starts with maintenance you can see
A well-maintained vehicle is a fuel-efficient, fully-utilized vehicle. Truck Inspection & Maintenance gives you digital inspections, PM scheduling, and live fleet health so no truck quietly drains MPG or sits broken. No hardware, no contracts. Sign up free and start closing the leaks today.
Lever 3 — Maintenance as a Fuel Strategy
This is the lever most fleets miss: maintenance and fuel economy aren't separate priorities. A well-maintained vehicle is a fuel-efficient vehicle — neglected service items silently erode MPG, raise emissions, and shorten vehicle lifespan. Treating preventive maintenance as a fuel-saving strategy, not just downtime avoidance, unlocks savings on both fronts at once. And the move from reactive to predictive maintenance — scheduling service on real-time usage and sensor data instead of waiting for failure — is where the biggest fleets are heading. Start a free account to build PM scheduling that protects both uptime and fuel economy.
Lever 4 — Data & KPI Discipline
The thread tying every lever together is measurement. Effective optimization combines technology with process discipline — tools surface inefficiencies, but only if you track the right numbers and act on them. Use telematics and dashboards to monitor these KPIs continuously, so you're deciding on evidence instead of intuition. This is where invisible waste across a large fleet finally becomes visible and fixable. Reach our team to set up the dashboards that matter for your operation.
The 90-Day Optimization Roadmap
You don't optimize everything at once. The fleets that see fast wins sequence the work — visibility first, then the high-impact levers, then continuous refinement. Here's a realistic path from blind to optimized.
Get visibility
Stand up tracking for cost-per-mile, idle time, fuel, and utilization. You can't fix what you can't see — establish the baseline first.
Fix maintenance & fuel
Launch PM scheduling and inspections so no truck drains MPG or sits broken. This is the fastest payback — most fleets cut fuel 15–25% in 90 days.
Optimize routes & loads
Move from static to dynamic routing, cluster stops, and cut deadhead miles with smarter task assignment.
Rebalance & refine
Use utilization data to redeploy or retire assets, then make KPI review a monthly habit. Optimization is continuous, not one-and-done.
Frequently Asked Questions
What's the single highest-impact fleet optimization move?
For most fleets, route optimization delivers the biggest immediate fuel savings — dynamic routing cuts consumption 12–22% over static planning, and fuel is the largest controllable cost. But the fastest payback often comes from maintenance and fuel discipline together, where many fleets save 15–25% within 90 days. The real answer is to attack all four cost centers, since the savings compound.
How does maintenance affect fuel costs?
Directly. A well-maintained vehicle is a fuel-efficient one — underinflated tires, clogged filters, and out-of-tune engines all silently erode MPG and raise emissions. Treating preventive maintenance as a fuel-saving strategy, not just downtime avoidance, saves on both fronts at once. Start a free account to build maintenance that protects fuel economy.
Do I need AI to optimize my fleet?
It helps but isn't required to start. Roughly 48% of fleet managers now use AI for routing, dispatching, and predictive maintenance, and AI routing can cut fuel and costs substantially. But the fundamentals — visibility into KPIs, preventive maintenance, and cutting idle time — deliver major gains on their own. Build the data foundation first, then layer AI on top.
How much can cutting idle time actually save?
More than most expect. Reducing idle time by 30–50% saves roughly $3,000–$8,000 per vehicle annually. Across a fleet of dozens or hundreds, that alone funds the rest of your optimization program — and it's one of the easiest wins once you can measure it. Talk to our team about tracking idle and fuel.
What KPIs should I track first?
Start with cost-per-mile as your master metric, then idle time, fuel consumption, and vehicle utilization. These four surface the waste hiding across every cost center. Centralized dashboards turn data that's scattered and invisible into evidence you can act on — which is the whole point of optimization versus guesswork.
How quickly will I see results?
Fuel and maintenance wins arrive fastest — often within the first 90 days. Routing and utilization gains build over the following months as data accumulates. Because logistics savings compound at scale, even small early improvements turn into meaningful margin. Sign up free to start measuring from day one.
Plug the leaks before they drain another quarter.
Truck Inspection & Maintenance is the foundation every optimization lever sits on — digital inspections, PM scheduling, live fleet health, and audit-ready records in one platform. Free for up to 3 vehicles, no hardware, no contracts. See the difference visibility makes.