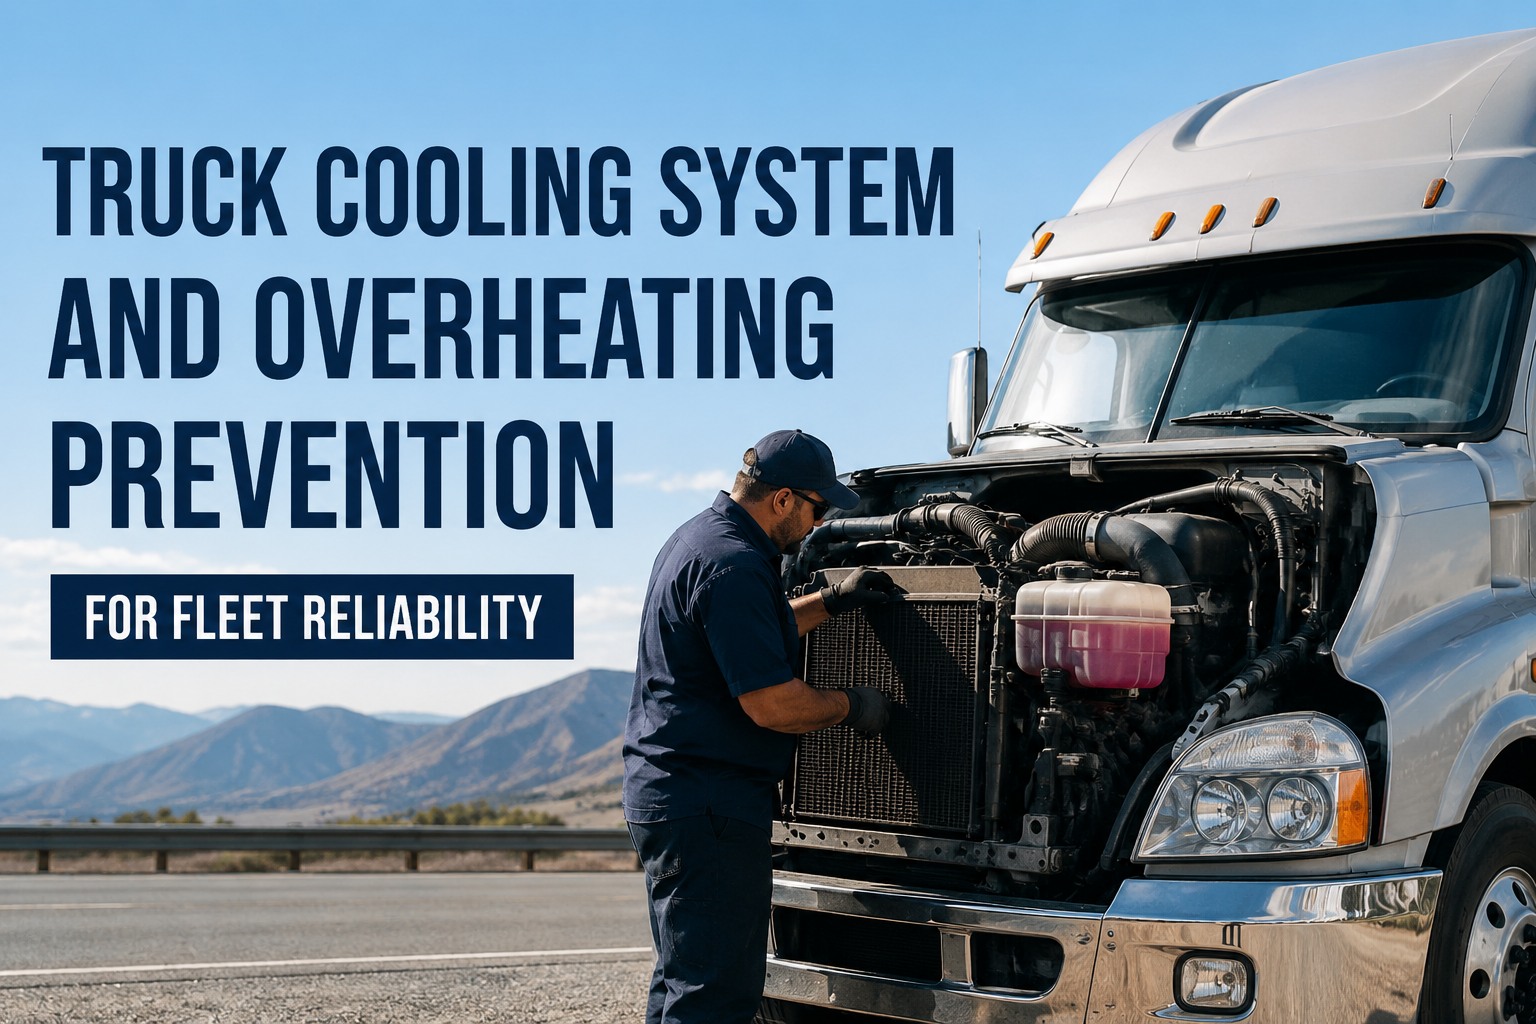
Overheating doesn't usually announce itself — it builds slowly over weeks as a thermostat sticks open and shut, a radiator clogs with bug debris, or a coolant inhibitor depletes silently in the reservoir. Then the truck hits a 6% grade in 95°F summer heat with a 80,000 lb load, and the temp gauge climbs past 230°F in three minutes. Cylinder heads warp, head gaskets blow, and a $400 water pump preventable repair becomes a $15,000 engine rebuild plus a week of downtime. Industry data shows every $1 spent on proactive cooling-system care saves $4-$5 in emergency repair and downtime costs. Truck Inspection & Maintenance tracks coolant condition, temperature trends, hose inspections, and PM intervals on every truck — so a failing water pump gets caught in the yard, not on the shoulder of a highway. Start your free trial and stop letting overheats strand loads.
Truck Cooling System Management
Stop overheating before the temp gauge climbs. Track every hose, every flush, every reading.
What an Overheat Really Costs — And What Our Platform Prevents
The temp gauge climbing is the cheap part. Every minute past safe operating temperature compounds damage exponentially, and the costs that follow live in dozens of line items most fleets never tie back to the cooling system. Truck Inspection & Maintenance ties them all together:
Heavy-duty tow per call, before any parts touch the engine.
Minor overheat damage — labor-heavy and almost always 3-5 days off road.
What sustained overheating turns into. Warped heads, cracked blocks, seized internals.
Parts lead time + shop scheduling + customer rescheduling all roll into one cost line.
The Engine Temperature Zones — Logged Into Every Inspection
Most drivers only watch the temp gauge after something feels wrong. Truck Inspection & Maintenance turns the temperature reading into a logged, trended data point on every pre-trip and post-trip — so the slow drift toward overheating becomes visible weeks before it matters:
The 6 Cooling System Killers — Each One Tracked in the Workflow
Overheating is almost never one big failure — it's the sixth small thing in a chain nobody noticed. Truck Inspection & Maintenance bakes every one of these checks into the standard inspection template so the chain breaks at item one, not item six:
Low Coolant Level
The #1 overheating cause. Slow seepage from hose clamps, water pump weep holes, or radiator pinholes lowers the reservoir until heat dump fails on the next grade.
Clogged Radiator Core
Bug debris, road grime, and bent fins restrict airflow. Engine reads normal at highway speed and overheats the moment the truck slows to climb a grade or pull a hill.
Failing Thermostat
Stuck closed = rapid overheat. Stuck open = chronic underheating + fuel-economy loss. Either way, the warm-up curve gives it away — and our platform tracks warm-up time as a metric.
Worn Water Pump
Bearing whine, weep-hole leak, or impeller erosion. The pump can spin without moving enough coolant — engine reads hot under load but normal at idle. Pre-failure signs come weeks early.
Cracked or Soft Hoses
Upper and lower radiator hoses degrade from heat cycles. A soft hose collapses under suction; a cracked hose dumps coolant on the highway. Both are visible during a 30-second squeeze test.
Degraded Coolant Chemistry
Coolant inhibitors deplete over time even if level looks fine. Low pH eats aluminum components, wrong glycol concentration loses freeze/boil protection. Looks healthy until it isn't.
Early Warning Signs — What Drivers See Before the Overheat
Every overheat event has a warning track. The drivers see it; the question is whether the fleet captures it. Truck Inspection & Maintenance gives drivers a structured defect-reporting flow so these signals don't disappear into the cab radio chatter:
Sweet Smell from Vents
Glycol smell = coolant leak somewhere it shouldn't be. Often a heater core or a hose joint dripping onto a hot surface.
Temp Gauge Drifts on Grades
Climbing 5°F higher than normal on the same grade is the earliest measurable sign. Most fleets never log it. Our platform does.
White Steam at Reservoir Cap
Pressure cap weeping vapor after shutdown. Coolant is at higher pressure than the cap should allow — bad cap or boiling coolant.
Heater Blows Cold
Counterintuitive — when there's not enough coolant in the system, the heater core can't pull heat. A cold cab on a cold morning is a coolant-level warning.
Turn overheats into routine PM tasks.
Truck Inspection & Maintenance logs temperature readings, tracks coolant condition by asset, schedules flushes by mileage, and flags trucks running hot on grades. Free for up to 3 vehicles. Contact support to plan your rollout.
The Coolant Quality Triangle — Three Tests, One Record
"The coolant looks fine" is the most expensive sentence in any shop. Coolant degrades chemically long before it looks bad. Truck Inspection & Maintenance tracks all three quality dimensions per asset, so flushes happen on data, not guesswork:
pH Level
Test strip or meter measures coolant acidity. Below 8.0 means inhibitors depleted and corrosion is eating aluminum.
Glycol Concentration
Refractometer measures freeze/boil protection. Too high reduces heat transfer; too low loses winter protection. The sweet spot is narrow.
Contamination
Visual + lab. Oil = head gasket. Metal flake = internal wear. Discolored = inhibitor breakdown. Each finding routes to a different work order.
Coolant Service Calendar — ELC vs Conventional
Service intervals depend on coolant chemistry, and most fleets either over-service (waste) or under-service (engine damage) because they're running one schedule across mixed assets. Truck Inspection & Maintenance handles different intervals per asset automatically:
Frequently Asked Questions
How does Truck Inspection & Maintenance track cooling-system health?
Every inspection captures temperature reading, coolant level, visible defects, and PM completion status against the specific asset. Coolant test results (pH, glycol %, contamination) get logged with date and mileage. The platform plots temperature trends across runs so the slow drift from 200°F to 215°F over 6 weeks becomes a flagged event — not a surprise overheat.
What temperature is too high for a diesel truck?
Most diesel engines operate safely between 195°F and 220°F. Anything between 220°F and 230°F is the marginal zone — usually load or grade related, but worth investigating. Above 230°F is critical territory where engine damage starts; the driver should pull over safely and the truck needs immediate cooling-system inspection. Sign up free to log temperature trends per asset across your fleet.
Can I just check coolant level and skip the testing?
No — and this is one of the most expensive misconceptions in fleet maintenance. Coolant inhibitors deplete chemically long before the level drops. Low pH eats water pump impellers, cylinder liners, and aluminum heads from the inside out while the reservoir looks full. Refractometer + pH testing on PM C catches what level checks miss.
How often should I flush the cooling system?
Depends on coolant chemistry. Extended Life Coolant (ELC) runs roughly 600,000 miles or 6 years between flushes. Conventional coolant runs 100,000-150,000 miles or 2-3 years. Our platform handles different schedules per asset automatically — no spreadsheet juggling when you mix ELC and conventional across the fleet.
Why do my trucks overheat only on grades?
Almost always a marginal cooling capacity — the system handles flat-road heat dump fine but can't keep up under sustained high-load. Common culprits: clogged radiator fins, slipping fan belt, failing fan clutch, low coolant, or degraded coolant losing heat-transfer efficiency. Our platform flags grade-related temp spikes by correlating temp readings with route data.
Is a CMMS really worth it for cooling-system tracking?
If your fleet has more than 5 trucks running mixed coolant types and PM schedules, spreadsheets fall apart fast. Tracking install dates, test results, hose replacement history, and flush intervals by hand misses things — and overheat events cost $2K-$45K each. Talk to our team about putting cooling-system data on autopilot.
Stop overheating before the gauge climbs.
Truck Inspection & Maintenance tracks temperature trends, coolant condition, hose inspections, and flush intervals on every PM — so cooling problems get caught in the yard, not on a 6% grade. Free for up to 3 vehicles. No hardware. No contracts.