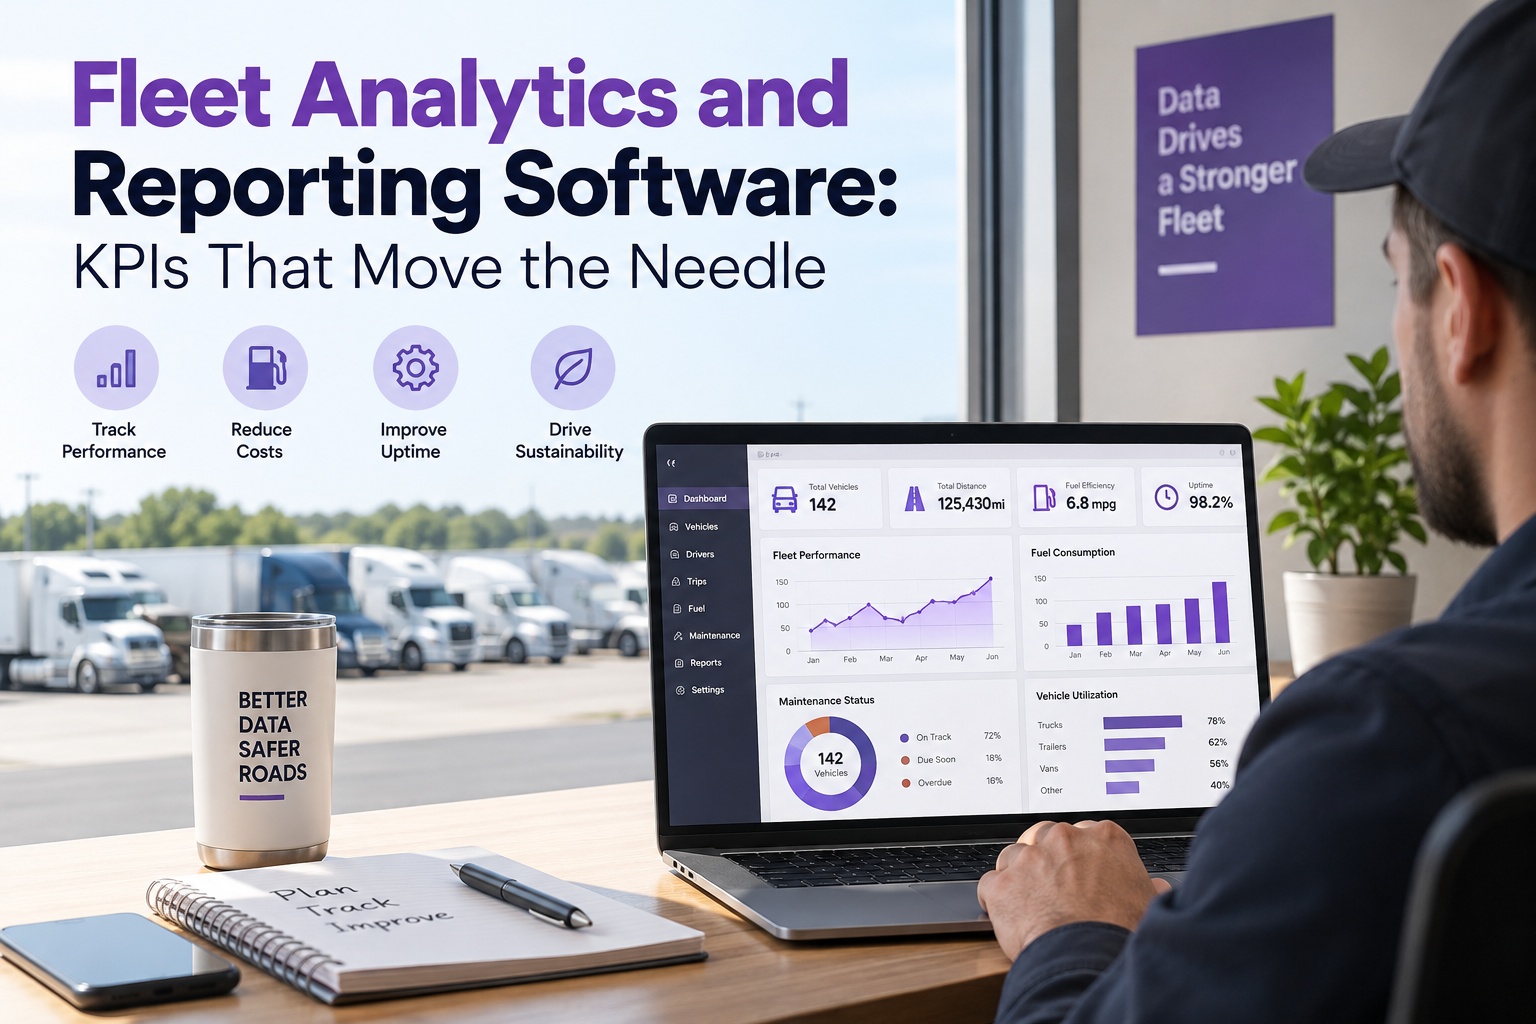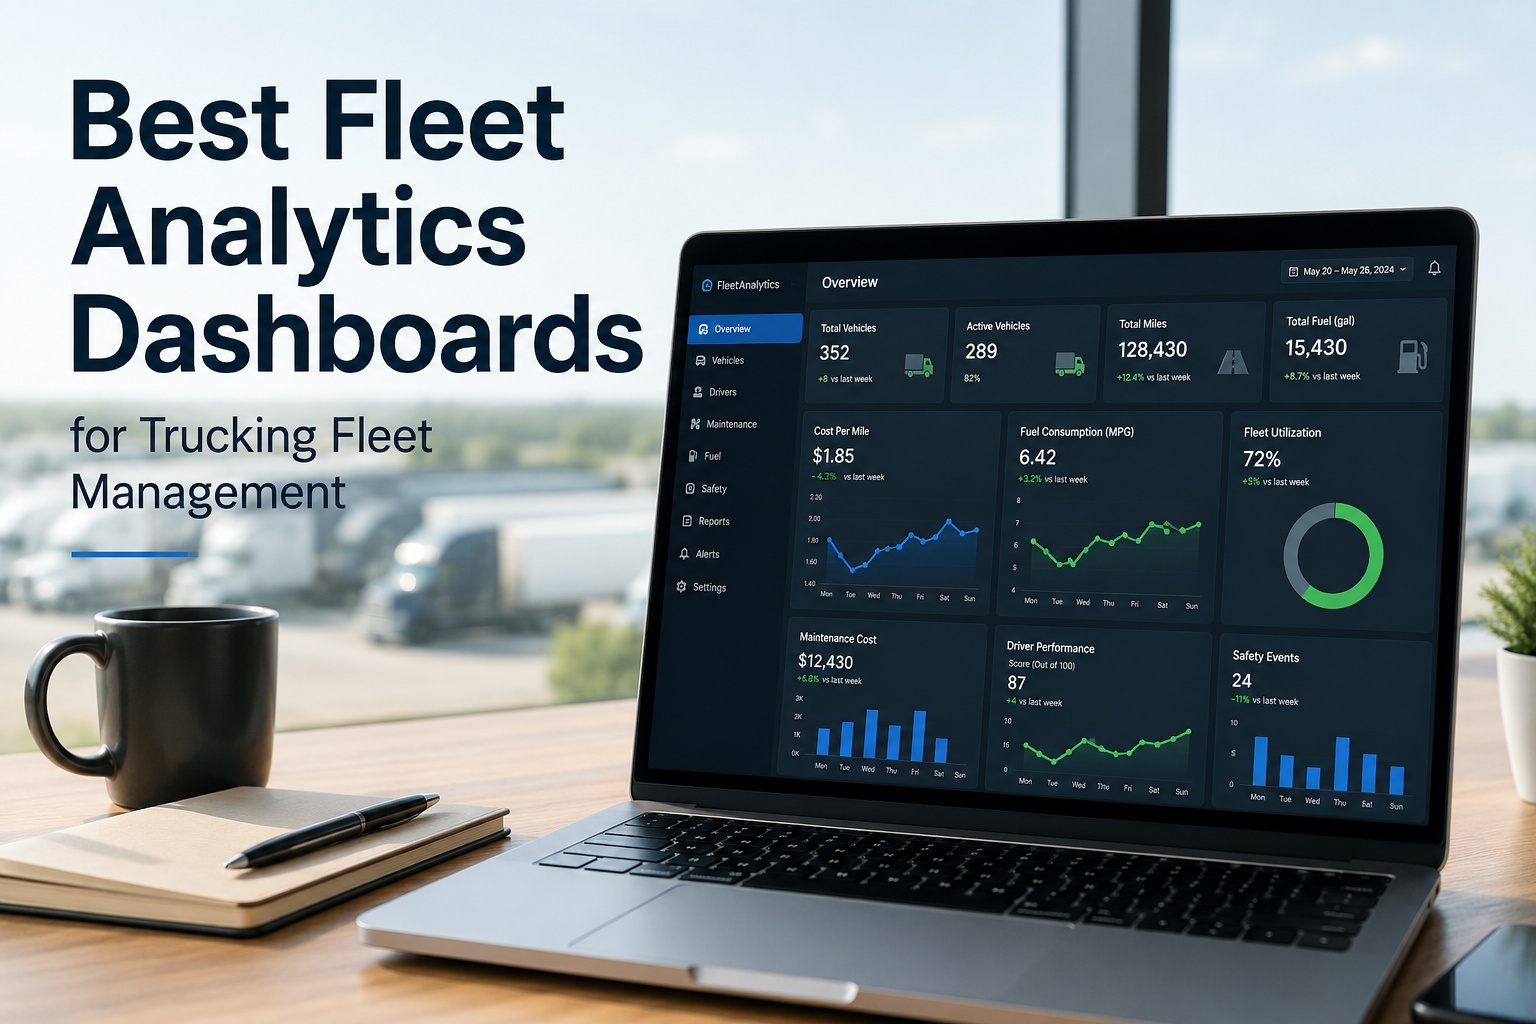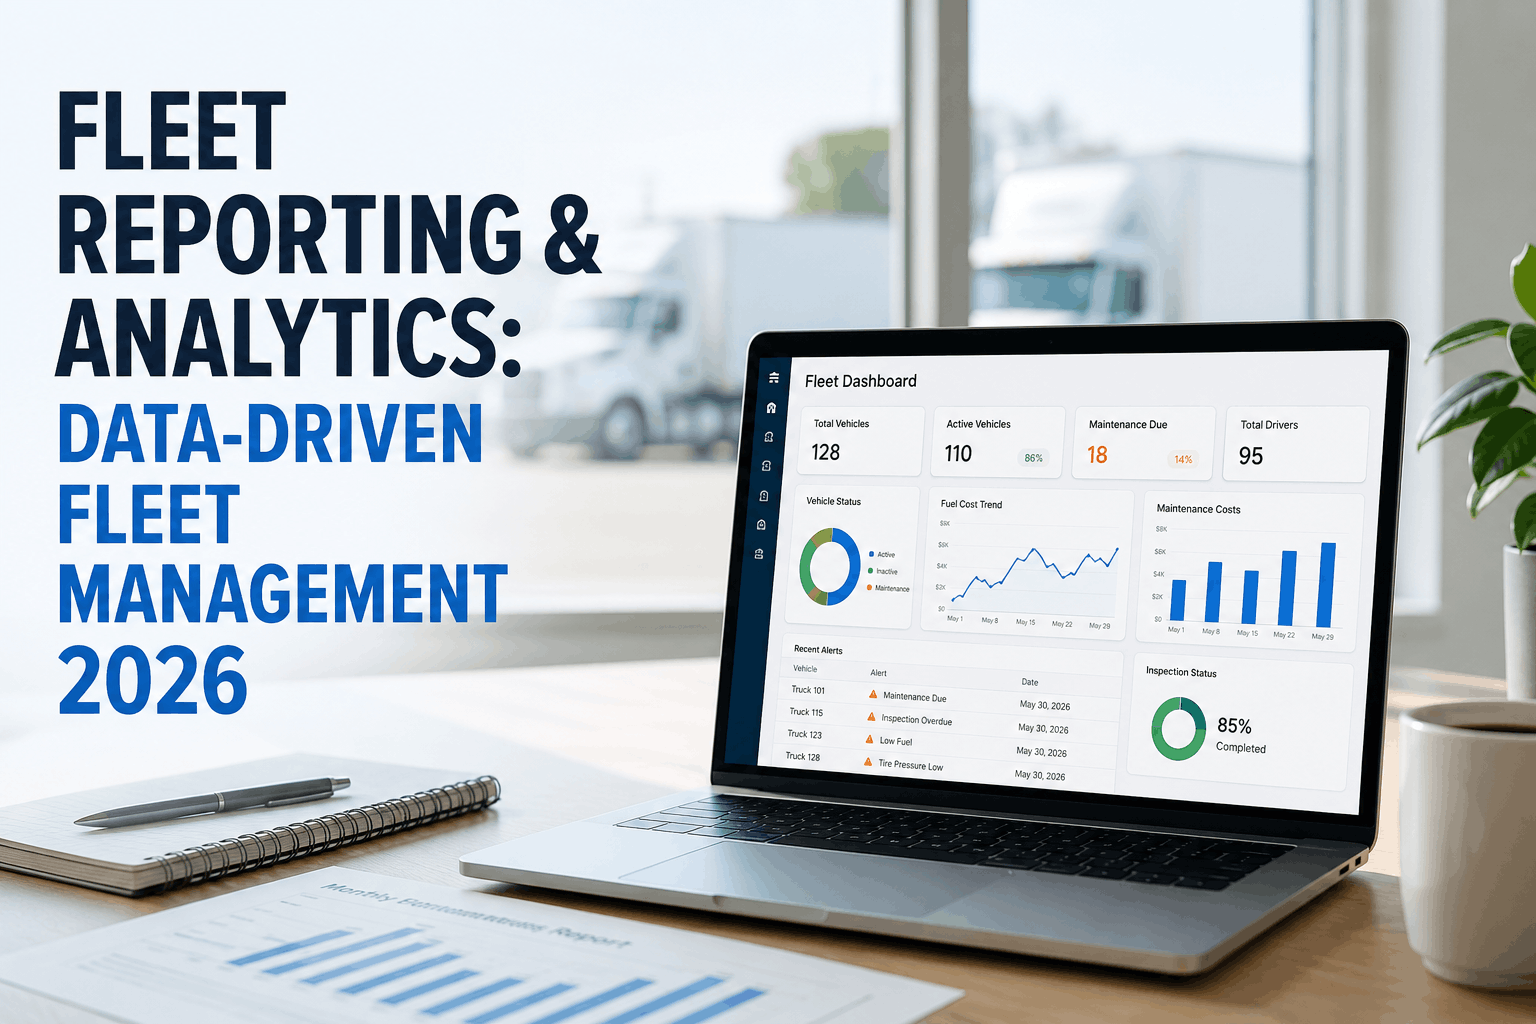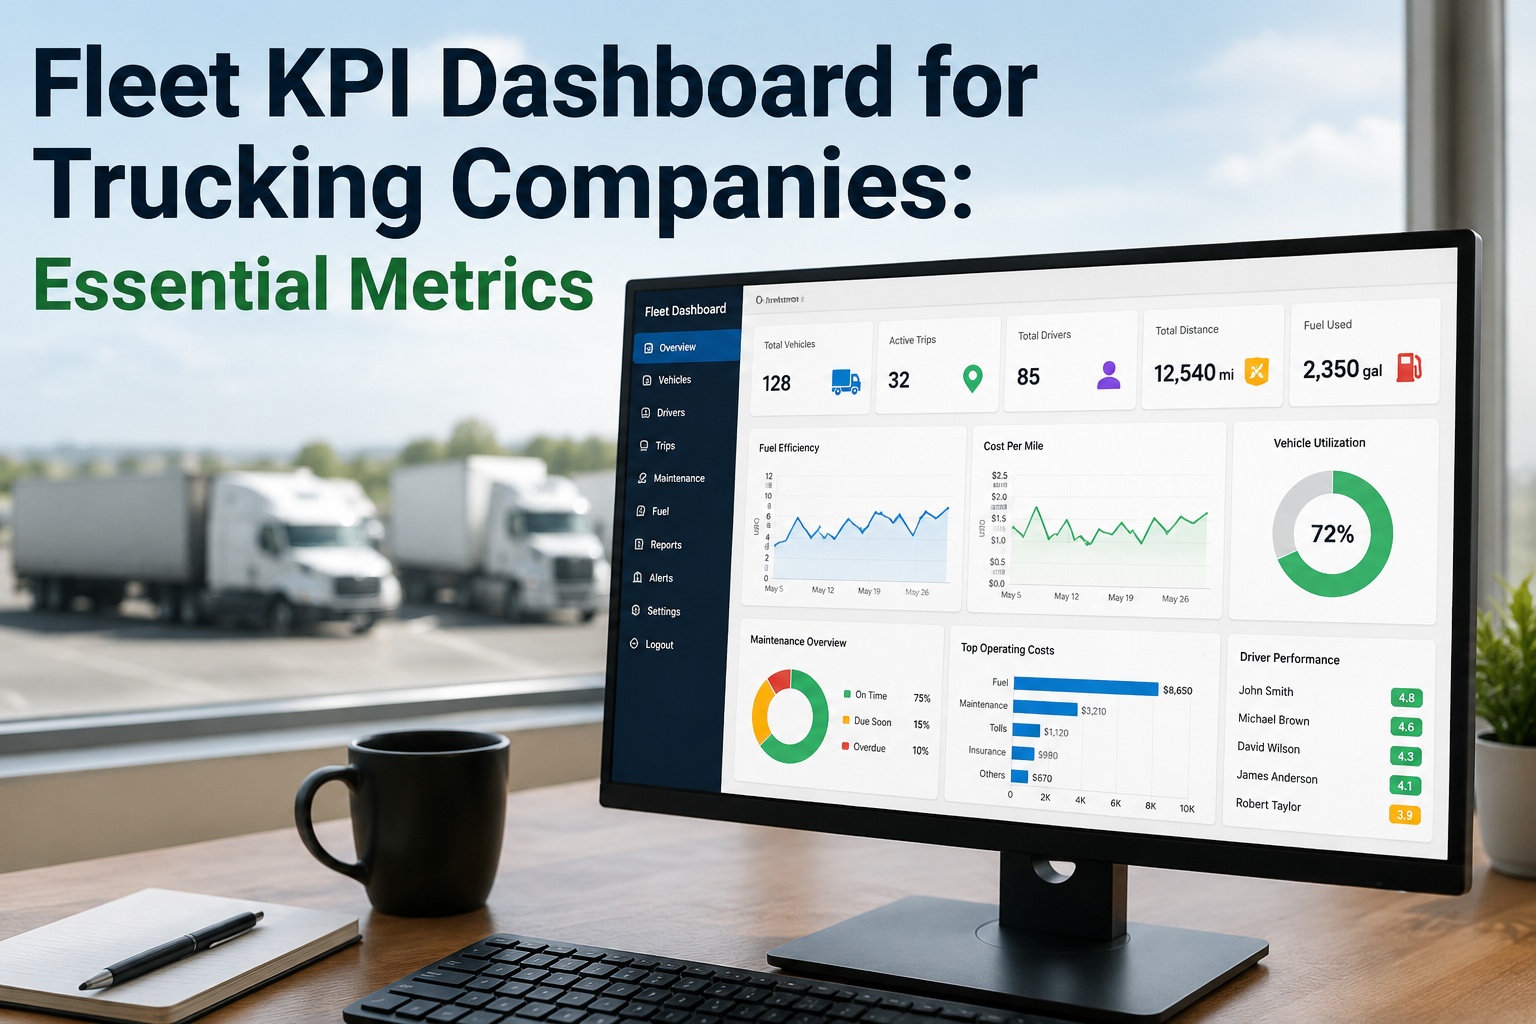
Most operations directors aren't short on fleet data — they're drowning in it. GPS pings, fuel receipts, maintenance invoices, driver logs, and ELD records scatter across six systems, and the only way to make sense of it is a weekly spreadsheet that's already stale by the time it's built. The fleets beating their peers in 2026 aren't working harder; they're seeing faster. They've built a dashboard around the few KPIs that actually move the business, not all forty. This guide walks through the essential trucking fleet KPIs — what each one means, the formula, the 2026 benchmark, and the decision it should trigger — and shows how Truck fleet analytics turns those numbers into a single live screen instead of a monthly spreadsheet grind.
Operations Playbook · Trucking Fleets · 2026
Fleet KPI Dashboard for Trucking Companies: The Essential Metrics
The cost, efficiency, maintenance, and safety KPIs that separate top-performing fleets from the ones still guessing — with the formulas, benchmarks, and actions that make them useful.
$2.26
Avg cost per mile, 2024 — up 38% since 2020
5-10%
Of annual budget wasted on idle assets & poor PM
30-40%
Share of operating costs that is fuel
$448-760
Unplanned downtime cost, per vehicle, per day
The Four Pillars of a Fleet Dashboard
Every fleet KPI falls into one of four strategic categories. Tracking metrics from only one or two creates blind spots — fleets that obsess over cost but ignore safety, or watch utilization while neglecting maintenance, always pay for the gap. The categories are connected: poor maintenance drives up fuel cost, low utilization hides a high cost per mile, and one safety incident wrecks your insurance economics.
Cost
Cost per mile, TCO, maintenance spend per vehicle. Is each asset earning its keep?
Efficiency
Utilization, on-time delivery, fuel economy, idle time. Are assets working hard enough?
Maintenance
PM compliance, MTBF, MTTR, downtime. Is the program extending asset life or burning it?
Safety
Driver safety scores, incident rate, inspection compliance. Are people and liability protected?
The Essential KPIs — Formula, Benchmark, Action
A KPI without a benchmark is just a number, and a benchmark without an action is just trivia. Each metric below comes with all three. These are the cards that belong on your dashboard:
Cost Per Mile (CPM)
CostThe single best predictor of profitability — if it includes every operating cost. CPM lets you compare true efficiency across routes, vehicle classes, and driver cohorts.
Total operating costs ÷ total miles driven
Trigger: Flag any vehicle 25%+ above fleet average before it becomes a replacement debate.
Fuel Efficiency (MPG)
EfficiencyYour largest controllable expense. A truck dropping from 8 to 6 MPG isn't just burning cash — it's signaling a maintenance, loading, or route problem.
Total miles driven ÷ total gallons consumed
Trigger: Telematics reduces fuel use 10-15%. Isolate idle and harsh events, then coach.
Asset Utilization Rate
EfficiencyLow utilization means you're paying insurance, depreciation, and parking on assets that aren't earning. One truck at 52% while others are over-dispatched wastes ~$1,800/month.
(Active hours ÷ available hours) × 100
Trigger: Below 70% consistently makes a vehicle a candidate for redeployment or disposal.
On-Time Delivery Rate
EfficiencyThe KPI your customers feel directly. It ties dispatch quality, route planning, and vehicle reliability into one customer-facing number.
(On-time deliveries ÷ total deliveries) × 100
Trigger: Slipping rate often traces back to a reliability or routing issue, not the driver.
Maintenance Cost Per Mile
MaintenanceSeparates mechanical cost from the rest of the operation. A rising number means aging vehicles or a fleet-wide mechanical pattern worth investigating.
Total maintenance spend ÷ miles driven
Trigger: Watch the planned-vs-reactive split — reactive spend signals a failing PM program.
Driver Safety Score
SafetyA composite of harsh braking, speeding, rapid acceleration, and incidents. It directly drives insurance cost, liability exposure, and retention.
Weighted index of harsh-event & incident data
Trigger: A deteriorating trend predicts accidents before they happen — coach early.
The Maintenance Trio Every Director Watches
Three maintenance KPIs reveal whether your fleet is managed proactively or reactively. Operations leadership watches these most closely because they predict downtime before it lands on the P&L:
PM Compliance
Completed PMs ÷ scheduled PMs
The leading indicator. High compliance extends asset life; slipping compliance is the root of most preventable breakdowns.
Target: 95%+
MTBF
Operating hours ÷ number of failures
Mean Time Between Failures — the gold-standard reliability metric. Rising MTBF means your PM strategy is working; falling means end-of-life or quality slippage.
Critical assets: 500+ hrs
MTTR
Repair hours ÷ number of repairs
Mean Time To Repair — how fast you recover. Often understated because the clock should start when the field reports the fault, not when the work order opens.
Critical assets: under 4 hrs
Free · Up to 3 Trucks
See all four pillars on one live screen
Truck fleet analytics pulls maintenance records, fuel logs, and inspection data into a single dashboard — cost per mile, utilization, PM compliance, and safety scores, recalculated every shift with automatic alerts when a KPI drifts out of range. Sign up free and your first KPIs are live within the hour, no spreadsheet required.
Build It Right: The Layered Dashboard
A dashboard showing 40 metrics with equal visual weight creates "dashboard fatigue" — managers do the cognitive work of prioritizing, then stop looking entirely. The fix is layering: a handful of north-star KPIs at the top, diagnostics one click below.
North-Star KPIs
Cost per mile · Utilization rate · Unplanned downtime % · PM compliance. Four numbers that give a complete health check in a single look.
Diagnostic KPIs
Fuel cost per mile · On-time % by route · MTBF/MTTR · Driver safety scores · Idle time by driver. The "why" behind the north-star trend.
Per-Vehicle & Per-Driver Detail
Individual asset history, work-order backlog, route-level breakdowns. Where a flagged outlier becomes a specific, fixable problem.
From Number to Decision
KPIs earn their place only when they change what you do. Here's the loop the best operations directors run — and the cadence that keeps it from becoming busywork:
Spot the drift
An alert fires when a KPI crosses its target threshold — not at month-end, but the shift it happens.
Find the root cause
Drill from the north-star number into the diagnostic and per-vehicle layers to isolate the real driver.
Act & close the loop
Retire underperformers, replan routes, coach drivers, fix assets — then check next cycle whether the number moved.
Cadence that works: review core KPIs weekly to stay close to the road, run a full performance analysis monthly and quarterly to reveal trends. Most KPI improvements take about 90 days of sustained effort to show real results — discuss exceptions first, and agree on one change per lane.
Why Spreadsheets Cost You Money
The gap between what your data could tell you and what a spreadsheet actually surfaces is where operating cost quietly disappears. Three reasons the manual approach is actively expensive in 2026:
The data is already stale
A weekly export is outdated by the time it's built. Decisions made on last month's numbers can't catch a CPM drift or a utilization gap while it's still cheap to fix.
The categories don't talk
Cost in one tab, maintenance in another, safety in a third. A utilization problem that's really a maintenance problem stays invisible when the pillars live in separate files.
The reporting grind never ends
Hours every week pulling, cleaning, and formatting — time that buys you a snapshot, not insight. Automated dashboards return that time and update themselves.
Frequently Asked Questions
Which fleet KPIs should I start with?
Start with four north-star KPIs: cost per mile, vehicle utilization rate, unplanned downtime percentage, and PM compliance rate. Together they give a complete health check at a glance. Add diagnostics — fuel cost per mile, driver safety scores, MTBF/MTTR — as your program matures. Tracking the right few beats tracking all forty.
What's a good cost per mile for a trucking fleet?
Context matters more than the raw number. The 2024 industry average reached about $2.26 per mile (ATRI), up 38% since 2020, with medium-duty fleets often in the $1.50-$2.10 range. A $1.65 CPM is excellent for long-haul but concerning for regional delivery. Internal trending — are you moving down quarter over quarter — is more actionable than any peer benchmark.
How is asset utilization calculated and what's the target?
Active operating hours divided by total available hours, times 100. Top-tier fleets run 85%+. A vehicle consistently below 70% is a candidate for redeployment or disposal — you're paying insurance, depreciation, and parking on an asset that isn't earning. Truck fleet analytics surfaces under-utilized vehicles automatically.
What is dashboard fatigue and how do I avoid it?
It happens when a dashboard shows too many metrics with equal visual weight, forcing the viewer to prioritize — so they stop looking. Avoid it with a layered architecture: 3-4 north-star KPIs visible at a glance, diagnostics available on drill-down, and role-based views so each user sees only what's relevant to their decisions.
How quickly can a fleet analytics dashboard deliver value?
Faster than most expect. With Truck fleet analytics, your first KPI dashboard is live within an hour of sign-up, populated automatically from inspection and work-order data. Most fleets spot their first actionable insight — an underused vehicle, a maintenance pattern, a high-cost outlier — within the first week, with measurable ROI in 30-90 days. Book a walkthrough to see it on your data.
How often should I review fleet KPIs?
Run a weekly review of core KPIs to stay close to operations, then a fuller analysis monthly and quarterly to spot trends and shape plans. Discuss exceptions first, assign a clear owner to each metric, and commit to one adjustment per lane each cycle. Sustained KPI improvements typically take about 90 days to show. Sign up free to automate the reporting.
Stop Reporting. Start Seeing.
Put your whole fleet on one live dashboard.
Truck fleet analytics tracks cost per mile, utilization, PM compliance, fuel efficiency, MTBF/MTTR, and driver safety — live, per vehicle, with automatic alerts and one-click exports that replace the weekly spreadsheet entirely. Free for up to 3 trucks. Live within the hour. No hardware, no contracts.