Vendor decks promise 10x ROI, 70% fewer breakdowns, and payback in 90 days. Fleet managers who've actually deployed predictive maintenance in trucking report something different: modest, defensible gains that require patience, clean data, and an honest baseline. The gap between the two isn't fraud — it's context. Manufacturing plant numbers get lifted straight into fleet marketing without checking whether trucks behave the same way. This blog cuts through the hype, sources every claim, and gives you the numbers you can actually defend in a budget meeting — plus what's realistic to adopt in a truck fleet today. Start a free trial to build the foundation predictive PM actually needs.
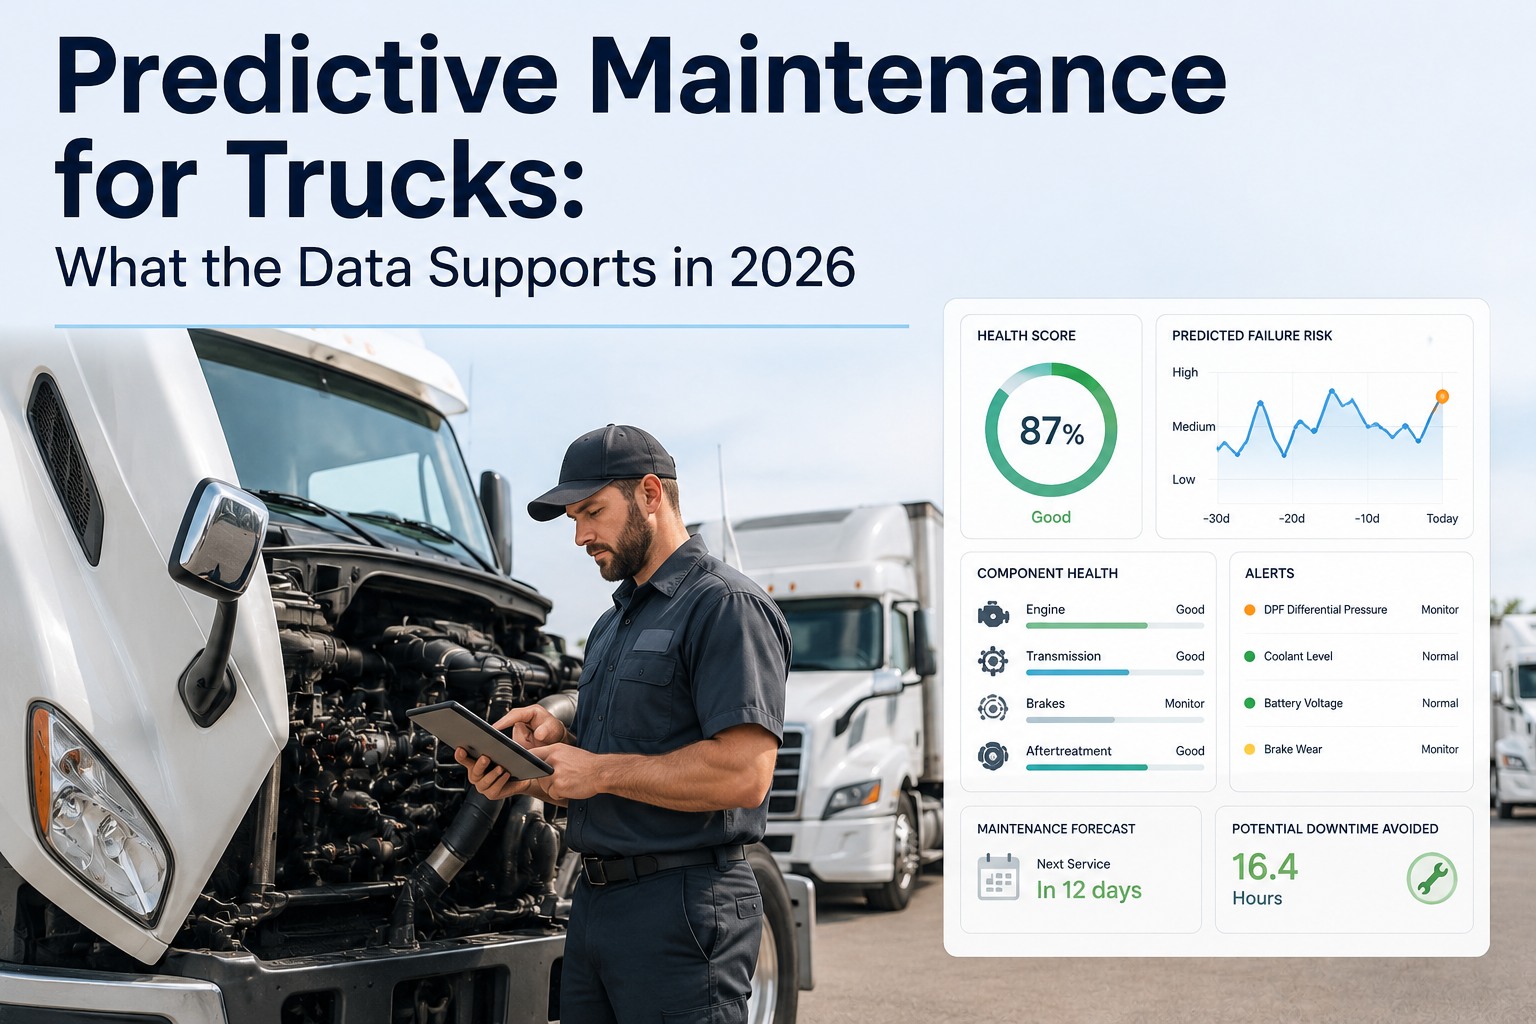
Predictive Maintenance for Trucks: What the Data Supports in 2026
The honest 2026 read on predictive maintenance in trucking — which claims hold up under source review, which don't, and what fleets should actually adopt this year vs wait on.
The Numbers, Sorted by Confidence
Not every "70% fewer breakdowns" statistic deserves the same weight in a budget meeting. Here's what the published research actually supports — separated by source quality, baseline clarity, and how often the figure gets misapplied.
What's Different About Trucks (vs Manufacturing)
Most PdM research comes from manufacturing plants. Trucks are a different environment, and four differences meaningfully change what works and what doesn't.
Three Predictive Approaches Actually Working in Trucks Today
Cut through the vendor language and three approaches actually produce measurable results in truck fleets in 2026. Each uses data trucks already generate — no exotic sensor package required.
What it does: Telematics fault codes above a defined severity trigger an accelerated PM appointment — not a warning email, an actual scheduled work order.
Evidence base: Strong. Fault codes are direct sensor output; correlation with impending failures is well-established.
Realistic gain: 15-25% reduction in unplanned breakdowns within one year for fleets moving from ignore-then-react.
What it does: Weight brake pad and tire PM intervals by driver-behavior event data — harsh braking, hard cornering, rapid acceleration. Units above 150% of fleet baseline get accelerated service.
Evidence base: Strong. Event data has documented correlation with brake and tire wear rates.
Realistic gain: 20-40% brake cost reduction within 6 months for fleets that also action driver coaching.
What it does: Trigger PMs on the driver that actually wears the component — hydraulic cycles for refuse, engine hours for high-idle, mileage for OTR — instead of one calendar for all.
Evidence base: Very strong. Component wear correlates with the right driver more than mileage for most vocational fleets.
Realistic gain: 30-50% reduction in vocational hydraulic failures; 10-20% overall PM cost improvement.
Three Approaches Still Not Ready for Most Fleets
These are what vendor slides promise. In 2026, they're technically possible but rarely worth their cost for a typical truck fleet.
Requires 6-9 months of baseline sensor data per asset class + data science support. Realistic only for very large fleets (500+ units) with a dedicated analytics team.
Popular in manufacturing; adapts poorly to trucks. Road noise generates constant false positives; sensor durability in truck environment adds ongoing maintenance overhead.
Works well for engines under warranty investigation. As a fleet-wide monthly program, cost usually exceeds benefit at 200-truck scale and below.
The Foundation Every PdM Program Needs
Predictive maintenance requires clean baseline data — mobile DVIRs, PM completion records, work order history, fault code capture. Truck Inspection & Maintenance builds that foundation in one platform, so when you're ready for advanced predictive analysis the historical data is already there, structured and searchable.
The Adoption Curve: Where Fleets Actually Are
The gap between "planning to adopt PdM" and "actually operational" is where 2026's competitive advantage lives. The data on where fleets sit today.
The Honest ROI Timeline for a First PdM Program
Not the vendor pitch — what actually happens month by month when a mid-sized truck fleet moves from reactive/preventive to a first predictive layer.
What to Actually Do in 2026
The realistic play for most fleets isn't "deploy machine learning" — it's build the data foundation predictive maintenance eventually requires, and start with the three approaches that already work.
Mobile DVIRs, PM records, work orders, fault code capture — all in one platform, all searchable. No predictive layer works without this.
Highest-evidence, lowest-cost predictive approach. Existing telematics fault codes route to work orders based on severity.
Harsh braking → brake pad PM interval adjustment. Existing data, existing PM system, no new sensors required.
Any serious ML failure prediction needs 6-9 months of clean baseline data anyway. Build that history before writing the check for the fancy platform.
Frequently Asked Questions
Yes — but the context around them matters as much as the numbers themselves. McKinsey's 30-50% downtime reduction describes mature programs running well, not first-year pilots. Deloitte's 5-10% cost reduction is a fleet-wide, all-in figure with a clear baseline. The DOE's 8-12% savings over preventive maintenance is the most conservative and most defensible. All three are real. None is guaranteed for your fleet from a vendor demo. The numbers you can defend in a budget meeting are the single-digit-to-low-double-digit ones. Start free and build the baseline data those numbers depend on.
Two structural reasons. First, trucks generate less native sensor data than plant assets — telematics gives you fault codes and GPS, but not the vibration, thermal, and current-draw signals that drive manufacturing PdM. Second, per-unit downtime cost is lower for trucks than for plant equipment ($500-$2,000/hour vs $5,000-$50,000+), which reduces the ROI ceiling on any prevention investment. Truck PdM works — it just works on a lower ceiling than the plant literature suggests.
Every wrong alert costs a truck roll, a teardown, or a needless part swap. McKinsey documented a program where a 10% false-positive rate canceled out the savings entirely. Below 5% and the program pays off comfortably; between 5-10% and results are marginal; above 10% and you're spending more than you save. Getting to sub-5% takes 6-12 months of model tuning against real fleet data — which is why the "instant results" vendor pitch is usually wrong.
Simple approaches (fault-code triggers, event-weighted PM) work at any fleet size — 20 trucks or 2,000. Advanced ML failure prediction needs enough data volume to train models: realistically 500+ units per unit class before results become reliable. Small and mid-sized fleets get 70-80% of the PdM benefit from the simple approaches at 5-10% of the cost. Advanced ML is a big-fleet play; simple predictive triggers are for everyone. Ask about scaled approaches.
The Foundation Comes Before the Prediction
Truck Inspection & Maintenance is the mobile-first platform that captures the data any future predictive program depends on — DVIRs, PM scheduling, work orders, and compliance records in one system. Whether you're deploying predictive triggers today or building the historical record for tomorrow, the foundation is the same. Start it now.